- GBP/JPY takes offers to refresh intraday low, prints three-day downtrend.
- Bearish MACD signals hint at further downside below immediate DMA support.
- Weekly resistance line holds the key to buyer’s entry, seven-week-long support line appears crucial for bears.
GBP/JPY remains on the back foot for the third consecutive day, despite the sellers' recent struggle to break the 20-DMA support during Thursday’s Asian session. That said, the cross-currency pair refreshes intraday low near 165.50 by the press time.
Given the quote’s sustained weakness, as portrayed by the bearish MACD signal, coupled with the trading below the one-week-old descending resistance line, the GBP/JPY prices are likely to remain weak.
It’s worth noting, however, that a clear downside break of the 20-DMA support near 165.50 becomes necessary for the intraday sellers before they aim for the ascending support line from May 12, at 164.25 by the press time.
Should the GBP/JPY prices remain weak past 164.25, the 50-DMA level of 162.77 can challenge the bears before directing them to the monthly low of 160.00.
Meanwhile, recovery moves need validation from the weekly resistance line, close to 166.40 at the latest.
Following that, the recent swing high and the monthly top, surrounding 167.85 and 168.75 in that order, will challenge the GBP/JPY bulls.
If at all the quote rises past 168.75, the odds of witnessing a run-up towards the 170.00 threshold can’t be ruled out.
GBP/JPY: Daily chart
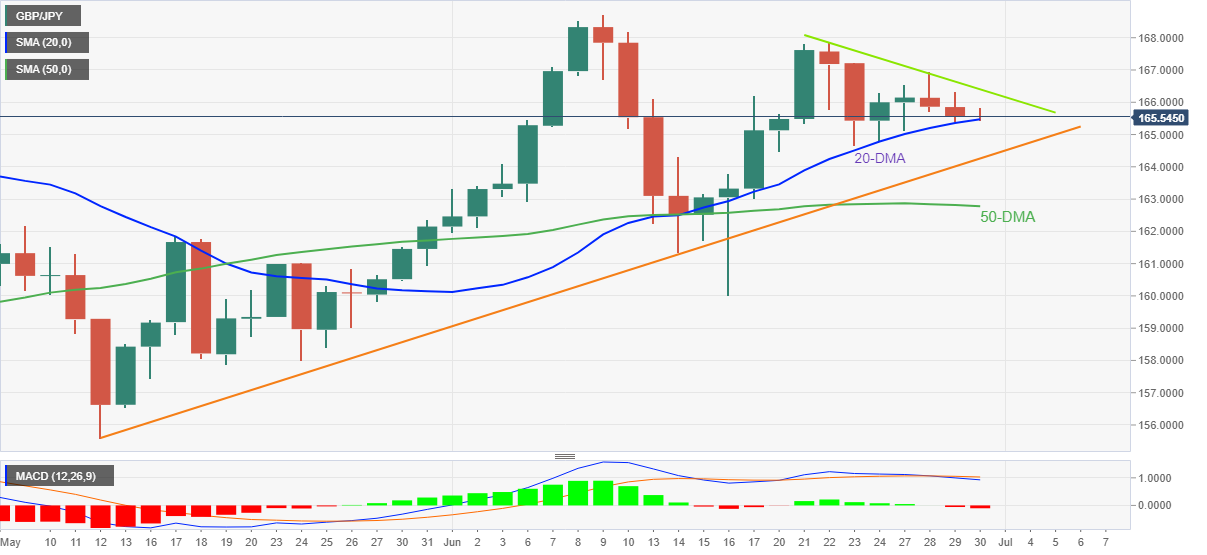
Trend: Further weakness expected
Information on these pages contains forward-looking statements that involve risks and uncertainties. Markets and instruments profiled on this page are for informational purposes only and should not in any way come across as a recommendation to buy or sell in these assets. You should do your own thorough research before making any investment decisions. FXStreet does not in any way guarantee that this information is free from mistakes, errors, or material misstatements. It also does not guarantee that this information is of a timely nature. Investing in Open Markets involves a great deal of risk, including the loss of all or a portion of your investment, as well as emotional distress. All risks, losses and costs associated with investing, including total loss of principal, are your responsibility. The views and opinions expressed in this article are those of the authors and do not necessarily reflect the official policy or position of FXStreet nor its advertisers. The author will not be held responsible for information that is found at the end of links posted on this page.
If not otherwise explicitly mentioned in the body of the article, at the time of writing, the author has no position in any stock mentioned in this article and no business relationship with any company mentioned. The author has not received compensation for writing this article, other than from FXStreet.
FXStreet and the author do not provide personalized recommendations. The author makes no representations as to the accuracy, completeness, or suitability of this information. FXStreet and the author will not be liable for any errors, omissions or any losses, injuries or damages arising from this information and its display or use. Errors and omissions excepted.
The author and FXStreet are not registered investment advisors and nothing in this article is intended to be investment advice.
Recommended content
Editors’ Picks
EUR/USD clings to daily gains above 1.0650

EUR/USD gained traction and turned positive on the day above 1.0650. The improvement seen in risk mood following the earlier flight to safety weighs on the US Dollar ahead of the weekend and helps the pair push higher.
GBP/USD recovers toward 1.2450 after UK Retail Sales data

GBP/USD reversed its direction and advanced to the 1.2450 area after touching a fresh multi-month low below 1.2400 in the Asian session. The positive shift seen in risk mood on easing fears over a deepening Iran-Israel conflict supports the pair.
Gold holds steady at around $2,380 following earlier spike

Gold stabilized near $2,380 after spiking above $2,400 with the immediate reaction to reports of Israel striking Iran. Meanwhile, the pullback seen in the US Treasury bond yields helps XAU/USD hold its ground.
Bitcoin Weekly Forecast: BTC post-halving rally could be partially priced in Premium

Bitcoin price shows no signs of directional bias while it holds above $60,000. The fourth BTC halving is partially priced in, according to Deutsche Bank’s research.
Week ahead – US GDP and BoJ decision on top of next week’s agenda

US GDP, core PCE and PMIs the next tests for the Dollar. Investors await BoJ for guidance about next rate hike. EU and UK PMIs, as well as Australian CPIs also on tap.