- The GBP/JPY three-day rally stalled around the 20-DMA and the 161.00 mark.
- Oscillators suggest the GBP/JPY might continue its downtrend, but a decisive break above 161.00 could set the pair to challenge the 200-DMA.
On Tuesday, the GBP/JPY registered solid gains, but the rally stalled around the 20-day Exponential Moving Average (EMA) at 161.08, as sellers leaning into it stepped in, dragging the GBP/JPY lower. Nevertheless, as Wednesday’s Asian session begins, the GBP/JPY is almost unchanged at around 161.02.
GBP/JPY Price Analysis: Technical outlook
From a daily chart perspective, the GBP/JPY is neutral-to-downward biased. In the last two days, the GBP/JPY has been unable to crack the confluence of two technical indicators: the 20-day EMA and a five-month-old upslope support trendline, which turned resistance around the 161.00 mark. If the GBP/JPY pierces that latter, that would be the first step for higher prices, but its next hurdle would be the January 9 daily high of 161.24. A breach of the latter will clear the space towards the 200-day EMA at 162.50, followed by the 163.00 mark.
If that scenario is to play out, oscillators like the Relative Strength Index (RSI) would need to shift bullish, as it remains in bearish territory, while the Rate of Change (RoC) needs to show that selling pressure is waning. Otherwise, the GBP/JPY downtrend would resume.
Hence, the GBP/JPY first support would be the January 10 swing low of 160.04, followed by essential support levels like this week’s low of 159.30, ahead of 159.00.
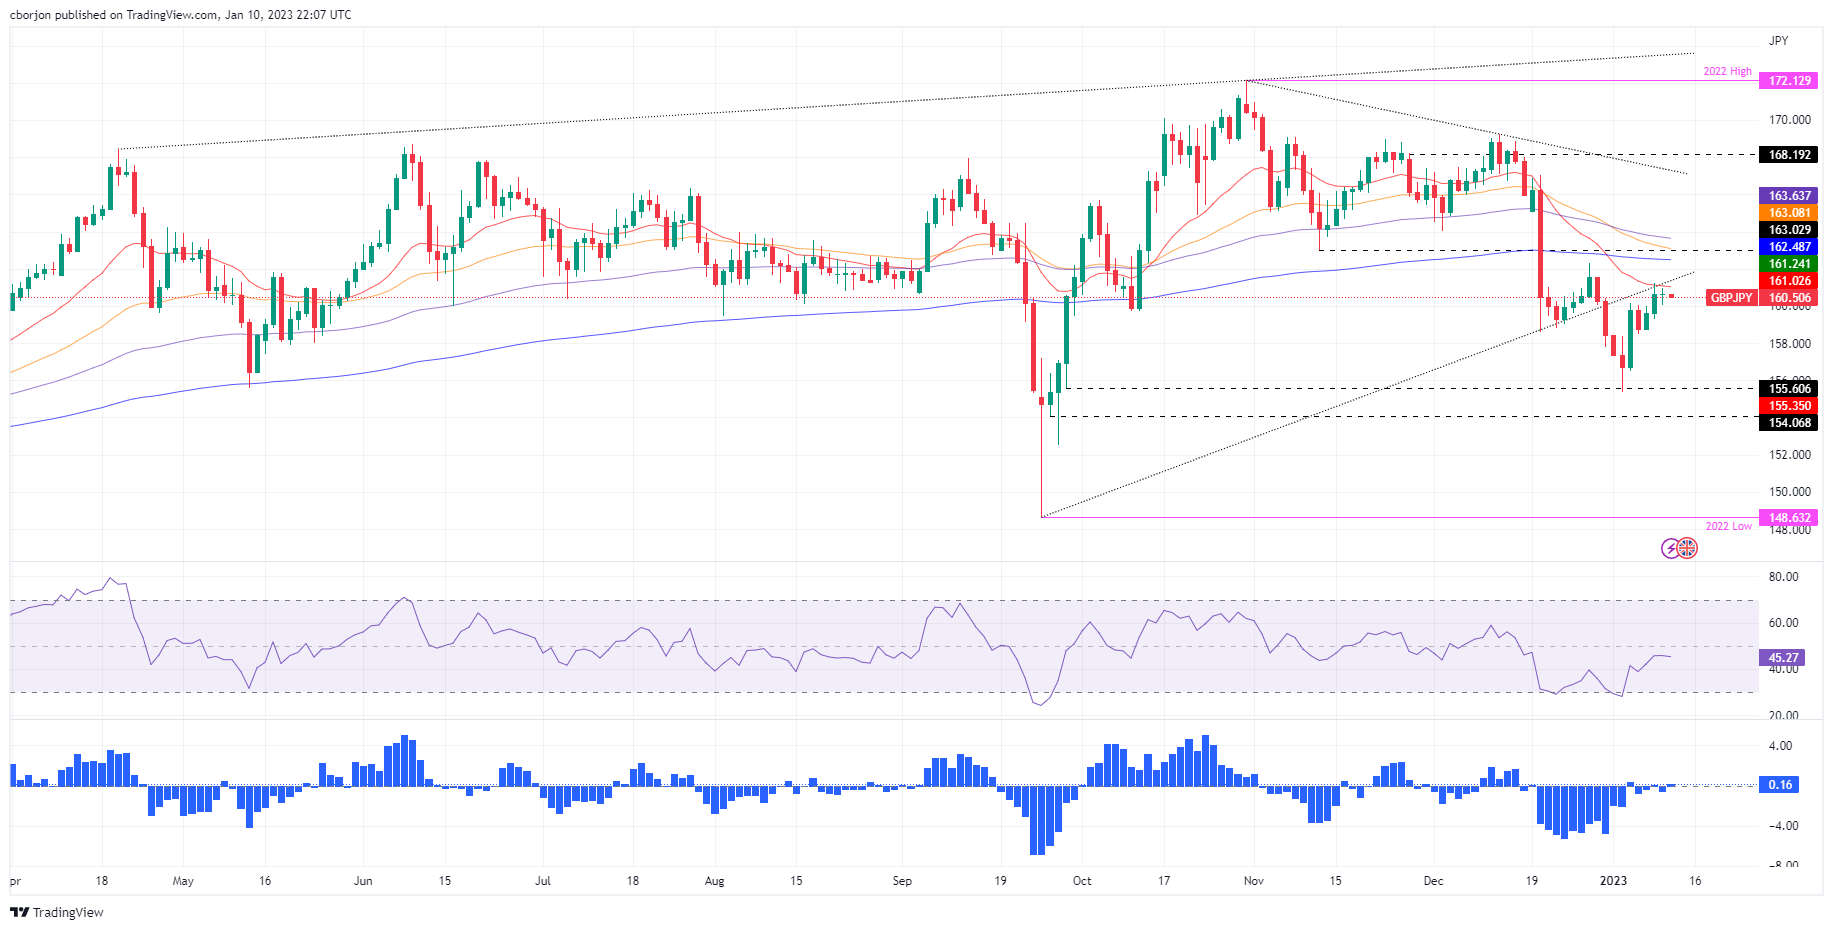
GBP/JPY Key Technical Levels
Information on these pages contains forward-looking statements that involve risks and uncertainties. Markets and instruments profiled on this page are for informational purposes only and should not in any way come across as a recommendation to buy or sell in these assets. You should do your own thorough research before making any investment decisions. FXStreet does not in any way guarantee that this information is free from mistakes, errors, or material misstatements. It also does not guarantee that this information is of a timely nature. Investing in Open Markets involves a great deal of risk, including the loss of all or a portion of your investment, as well as emotional distress. All risks, losses and costs associated with investing, including total loss of principal, are your responsibility. The views and opinions expressed in this article are those of the authors and do not necessarily reflect the official policy or position of FXStreet nor its advertisers. The author will not be held responsible for information that is found at the end of links posted on this page.
If not otherwise explicitly mentioned in the body of the article, at the time of writing, the author has no position in any stock mentioned in this article and no business relationship with any company mentioned. The author has not received compensation for writing this article, other than from FXStreet.
FXStreet and the author do not provide personalized recommendations. The author makes no representations as to the accuracy, completeness, or suitability of this information. FXStreet and the author will not be liable for any errors, omissions or any losses, injuries or damages arising from this information and its display or use. Errors and omissions excepted.
The author and FXStreet are not registered investment advisors and nothing in this article is intended to be investment advice.
Recommended content
Editors’ Picks
AUD/USD remained bid above 0.6500

AUD/USD extended further its bullish performance, advancing for the fourth session in a row on Thursday, although a sustainable breakout of the key 200-day SMA at 0.6526 still remain elusive.
EUR/USD faces a minor resistance near at 1.0750

EUR/USD quickly left behind Wednesday’s small downtick and resumed its uptrend north of 1.0700 the figure, always on the back of the persistent sell-off in the US Dollar ahead of key PCE data on Friday.
Gold holds around $2,330 after dismal US data

Gold fell below $2,320 in the early American session as US yields shot higher after the data showed a significant increase in the US GDP price deflator in Q1. With safe-haven flows dominating the markets, however, XAU/USD reversed its direction and rose above $2,340.
Bitcoin price continues to get rejected from $65K resistance as SEC delays decision on spot BTC ETF options

Bitcoin (BTC) price has markets in disarray, provoking a broader market crash as it slumped to the $62,000 range on Thursday. Meanwhile, reverberations from spot BTC exchange-traded funds (ETFs) continue to influence the market.
US economy: slower growth with stronger inflation

The dollar strengthened, and stocks fell after statistical data from the US. The focus was on the preliminary estimate of GDP for the first quarter. Annualised quarterly growth came in at just 1.6%, down from the 2.5% and 3.4% previously forecast.