![]() HotForex Analysis Team
HotForex Analysis Team
HotForex
Fidelity “FIS” is a global financial services technology company and a leader in providing technology solutions to merchants, banks, and capital market firms worldwide. The company is dedicated to upgrade the way the globe and banks pay and invest by applying their benchmarks, deep expertise, and data-driven insights. On April 30, 2021, it announced a regular quarterly dividend of $0.39 per common share. The dividend is payable on June 25, 2021, to shareholders of record, effective from the end of business on June 11, 2021. Meanwhile, based on Zacks estimates, the company is expected to report weak revenue-growth performance for the Q1, with the overall revenue consensus at $3.16 billion, while EPS is seen at $1.25 per share declining by -2.3%s a year-over-year change.
Fidelity technical analysis
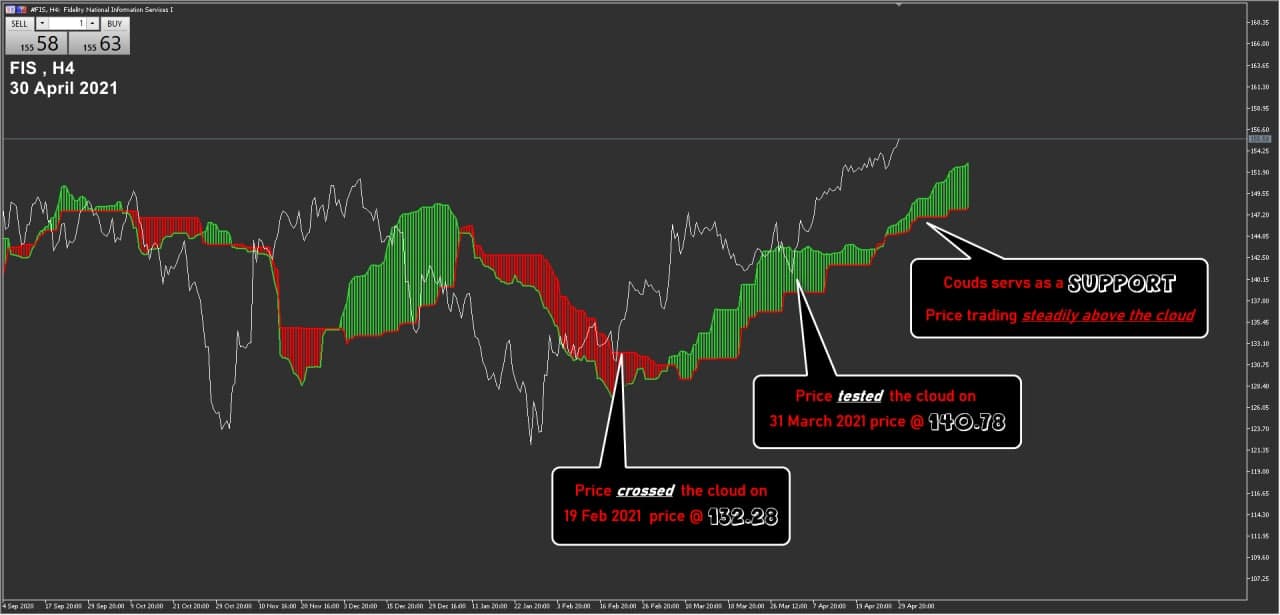
The technical analysis shows the stock price movement of Fidelity above the Ichimoku Cloud; We find that the price crossed and surpassed the cloud higher on February 19, 2021, at 132.28. The price also tested the cloud on March 31 at 140.78. The cloud currently acts as support as the price trades steadily above it.
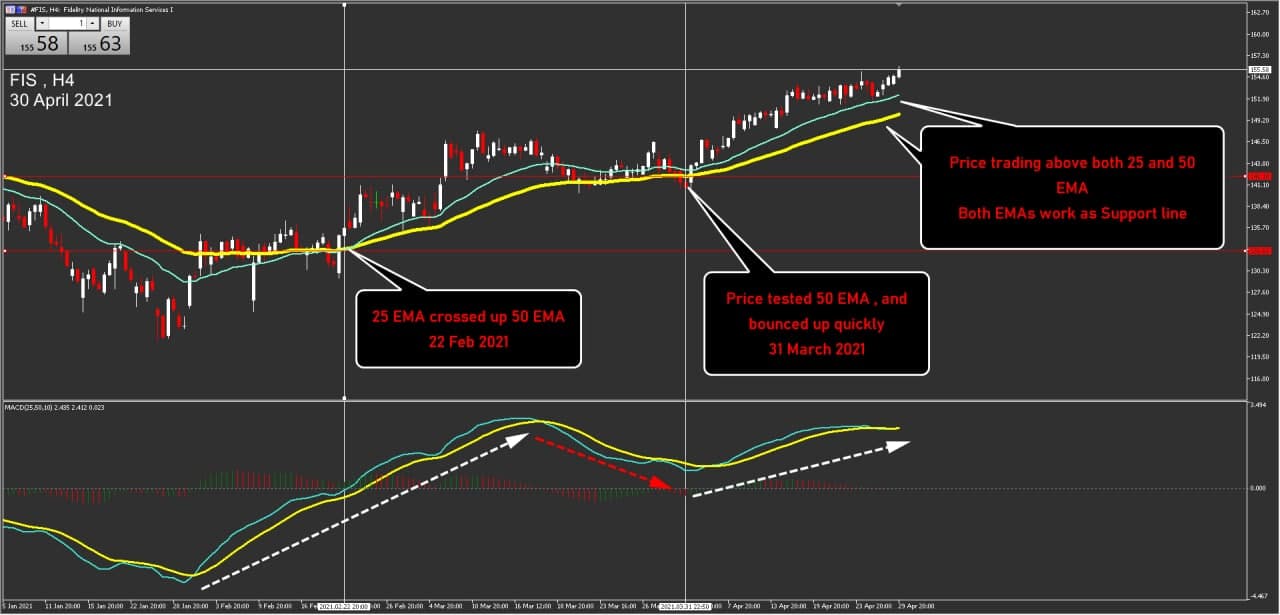
The following chart shows the exponential moving average “EMA” of Fidelity, where the share price is moving in an upward channel on the 4-hour timeframe above the 25- and 50- Exponential Moving Average since the February 22, 2021; The price also retested the 50- Exponential Moving Average on March 31, 2021 and then bounces back up quickly. The price is currently trading above the 25- and 50-Exponential Moving Average and both of them act as support lines for the price.
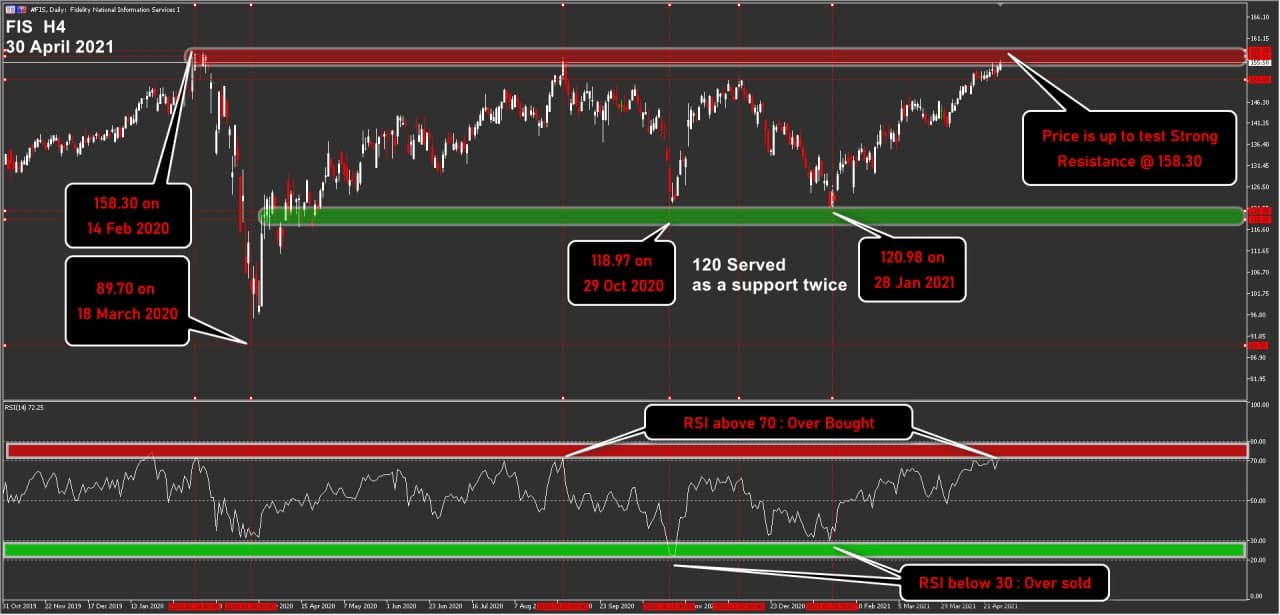
And in the last part of Fidelity’s analysis on a 4-hour timeframe, the chart shows support and resistance lines, as the price rose to 158.30 on February 14, 2020, and then fell sharply on the 18th of the following month to 89.70, to move in a sideways channel posting a double bottom formation, at 118.97-120.98. After the reversal form double bottom the asset held below the resistance at 158.30. In the meantime, the RSI is at 70 (overbought), with the indicator posting two highs above the 70 barrier, at the times where the asset retested the 158 area.
Moderna Corporation is an American pharmaceutical and biotechnology company which focuses on drug discovery, drug development, and mRNA-based vaccine technologies. Moderna is set to generate an estimated $ 9.3 billion in net income in 2021 as it supplies millions of doses of the COVID-19 vaccine according to Moderna announcement. Such profit growth brings the company in a really good financial position after it continuously losing money the past three years. As the big biotech companies are now busy ramping up production to meet the massive demand for Covid-19 vaccine, Moderna recently announced the expansion of its technology center in Massachusetts, in order to achieve an increase of its production by 50%. Overall the outlook for biotech companies looks positive, as pandemic turned beneficiary for them.
The company expected to reveal massive improvements in both earnings and revenue in Q1, with EPS at $2.30 from -0.35 in Q1 2020, while revenue is expected at $2,006.9 millions implying to a rise of around 23,822.7% compared to the year-ago quarter. This will be Moderna’s first quarterly EPS in at least three years.
Moderna key stats
| Estimate for Q1 2021 (FY) | Q1 2020 (FY) | Q1 2019 (FY) | |
| Earnings Per Share ($) | 2.30 | -0.35 | -0.40 |
| Revenue ($M) | 2,006.9 | 8.4 | 16.0 |
What's key for the release ahead is any remarks from the company regarding how our modernity will expand the production of its vaccine to meet the growing demand. In a press release issued on April 29, the company announced that it is investing in manufacturing facilities to reach a global production capacity of 3 billion doses by 2022. The company has also raised its supply forecast for 2021 to between 800 million and 1 billion doses.
Moderna technical analysis
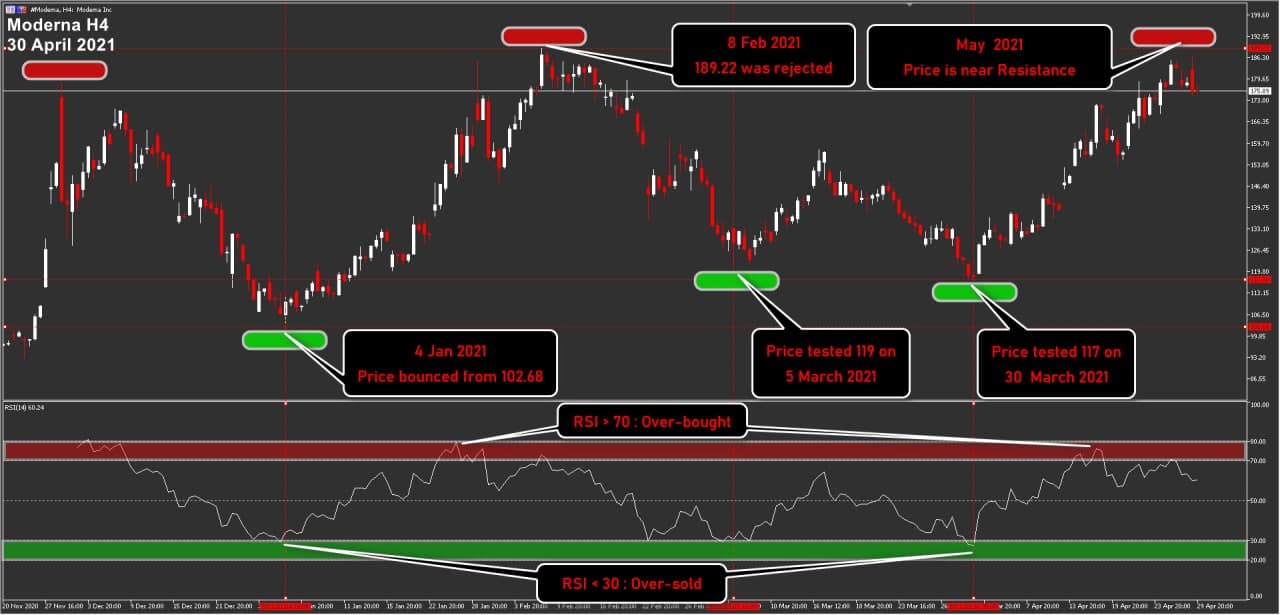
On a 4-hour timeframe Moderna’s share price during the first quarter of this year rebounded from 102.68 on January 4, 2021, to reach its peak on February 8 at 189.22, failing to break that resistance line. The share finds support within 117-119 area. Currently, the momentum indicators are neutral with RSI rejecting the 70 barrier as it sustains above 50.
Nonetheless, another pharmaceutical and biotechnology company reports today, Regeneron Inc. Just a quick briefing that Regeneron is originally focused on neurological factors and regenerative capabilities, it branched out into the study of both cytokine and tyrosine kinase receptors. Today, May 6, 2021, Regeneron is expected to announce its earnings before the market opens as well. The report will be for the fiscal quarter ending March 2021. According to Zacks Investment Research, the overall earnings per share forecast for the quarter is $7.78. Earning per share for the same quarter of last year was $5.87.
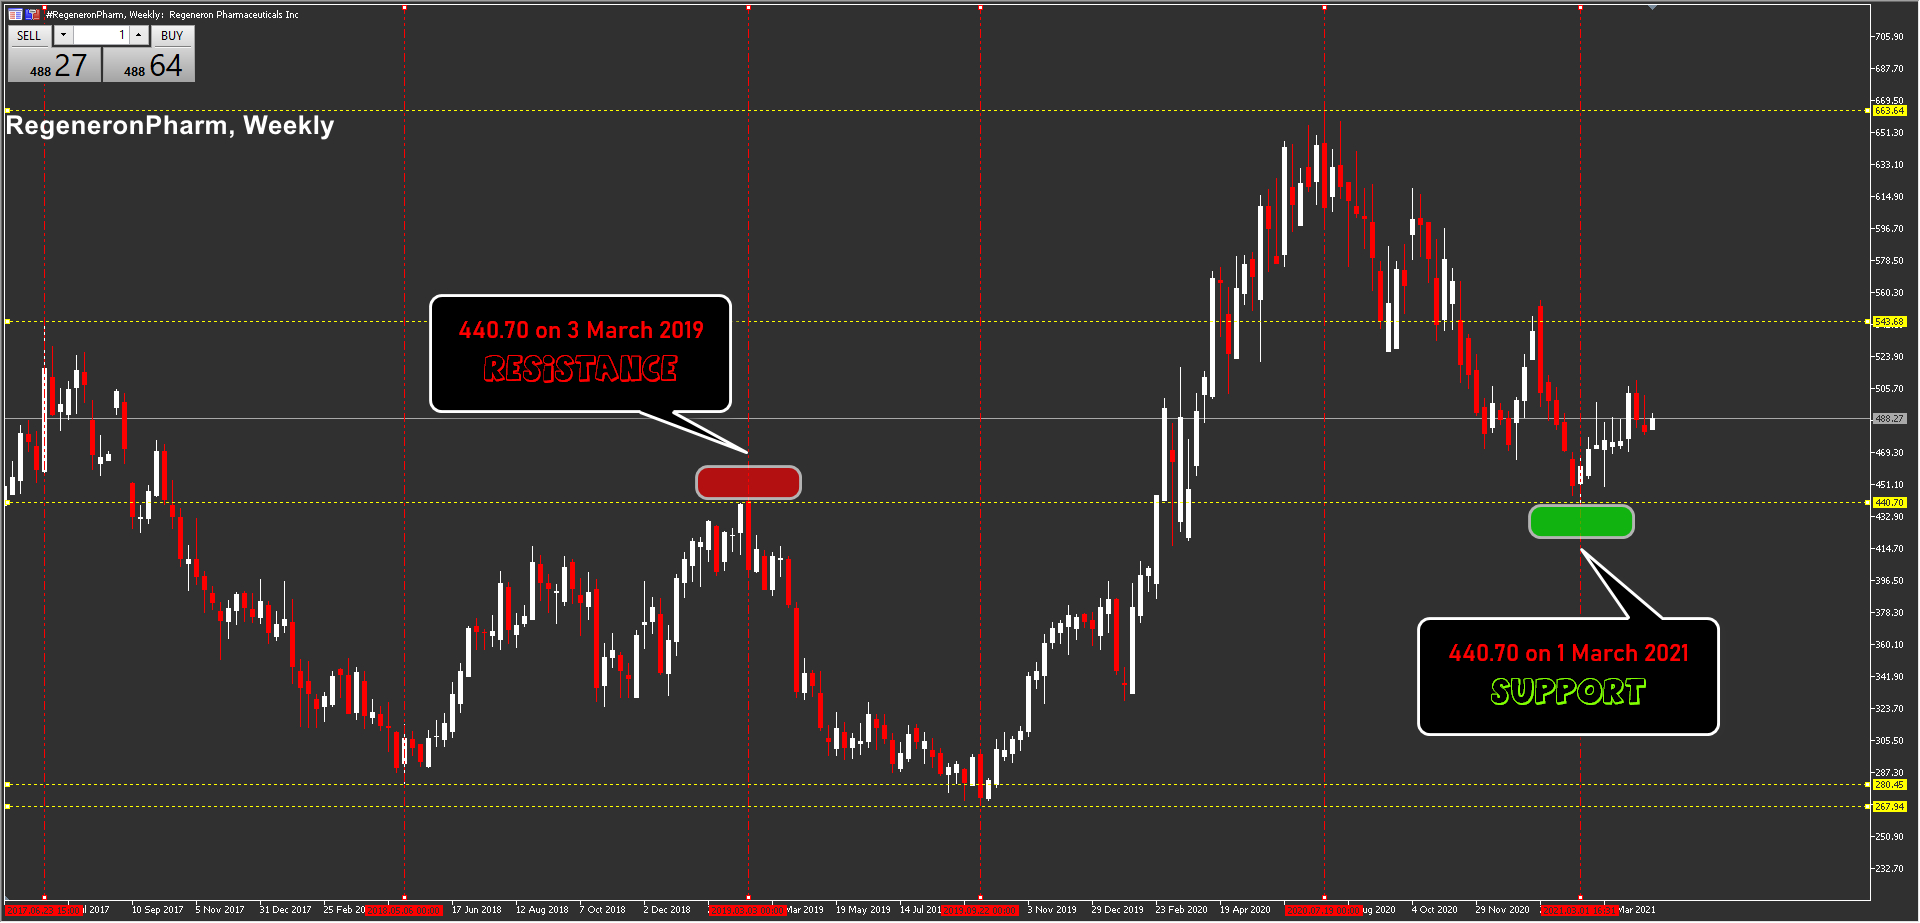
Regeneron technical analysis
Over the last 4 years, the Regeneron stock price char presents a key level at 440 which was a key Resistance for 2019-2020 and now considers to be an immediate Support level for the asset.
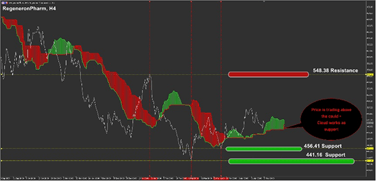
Intraday as shown below the asset is currently moving in a descending channel above Ichimoku cloud that acts as support.
Disclaimer: Nothing in this communication contains, or should be considered as containing, an investment advice or an investment recommendation or a solicitation for the purpose of purchase or sale of any financial instrument.
Recommended content
Editors’ Picks
AUD/USD pressures as Fed officials hold firm on rate policy

The Australian Dollar is on the defensive against the US Dollar, as Friday’s Asian session commences. On Thursday, the antipodean clocked losses of 0.21% against its counterpart, driven by Fed officials emphasizing they’re in no rush to ease policy. The AUD/USD trades around 0.6419.
EUR/USD extends its downside below 1.0650 on hawkish Fed remarks

The EUR/USD extends its downside around 1.0640 after retreating from weekly peaks of 1.0690 on Friday during the early Asian session. The hawkish comments from Federal Reserve officials provide some support to the US Dollar.
Gold price edges higher on risk-off mood hawkish Fed signals

Gold prices advanced late in the North American session on Thursday, underpinned by heightened geopolitical risks involving Iran and Israel. Federal Reserve officials delivered hawkish messages, triggering a jump in US Treasury yields, which boosted the Greenback.
Runes likely to have massive support after BRC-20 and Ordinals frenzy

With all eyes peeled on the halving, Bitcoin is the center of attention in the market. The pioneer cryptocurrency has had three narratives this year already, starting with the spot BTC exchange-traded funds, the recent all-time high of $73,777, and now the halving.
Is the Biden administration trying to destroy the Dollar?

Confidence in Western financial markets has already been shaken enough by the 20% devaluation of the dollar over the last few years. But now the European Commission wants to hand Ukraine $300 billion seized from Russia.