- EUR/USD risk reversals jumped to the highest since June 7, indicating falling demand for puts (bearish bets).
- Eurozone third quarter GDP, due for release at 10:00 GMT, is expected to show that growth rate remained unchanged.
- A better-than-expected US average weekly earnings could push up Treasury yields and the US dollar.
Risk reversals on the EUR, a gauge of calls to puts on the common currency, rose to six-month highs on Thursday, indicating investors are trimming bearish bets in anticipation of a stronger rally.
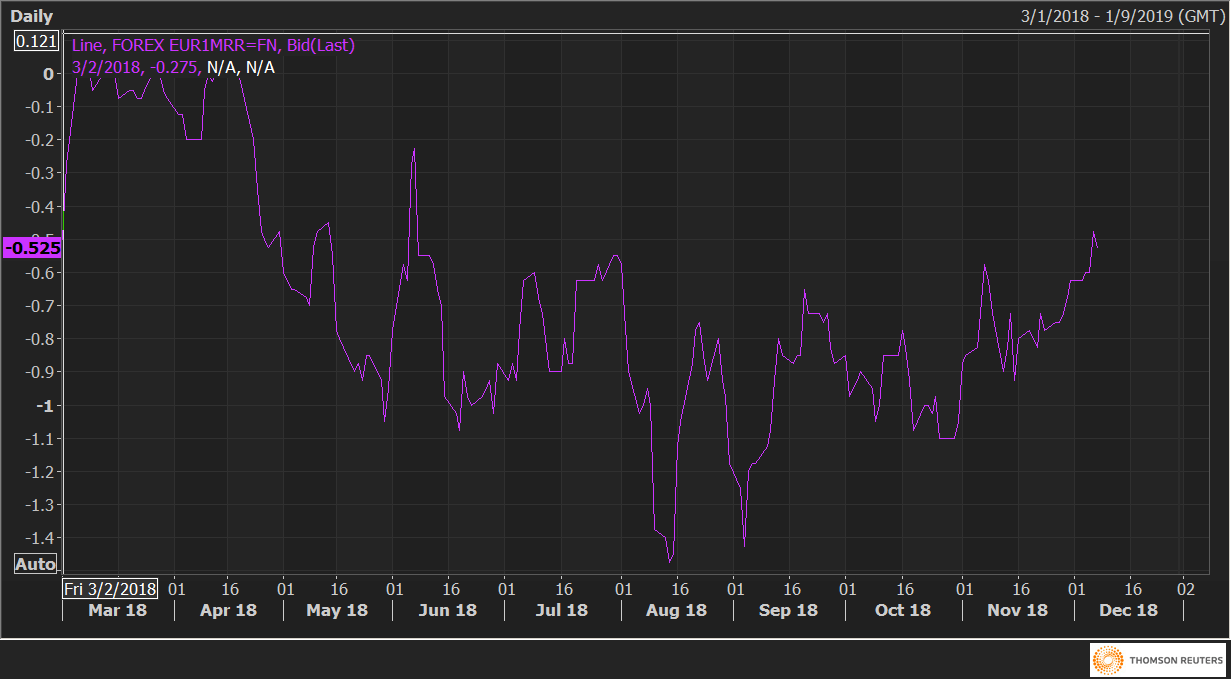
The one-month 25 delta risk reversals (EUR1MRR) rose to -0.475 – the highest level since June 7. The negative print indicates the implied volatility premium (or demand) for the puts (bearish bets) is higher than that for calls (bullish bets).
The value for the puts, however, is at the lowest in six months. Notably, it has dropped sharply in the last three weeks - risk reversals stood at -0.925 on Nov. 15.
So, it seems safe to say that investors are likely expecting the EUR/USD to confirm a symmetrical triangle breakout with a move above 1.1433 (upper edge of the triangle) and hence are unwinding bearish positions.
The bullish move could happen today if the Eurozone GDP prints above estimates and more importantly, the US wage growth cools sharply, forcing the markets to price in a 2019 rate pause. As of now, markets are expecting the Fed to deliver one rate hike next year.
The bull breakout, however, will likely remain elusive if the US wage growth number blows past expectations, pushing the treasury yields higher. The dollar may also remain bid if equities remain risk-averse.
EUR1MRR
EUR/USD Technical Levels
EUR/USD
Overview:
Today Last Price: 1.1375
Today Daily change: -7.0 pips
Today Daily change %: -0.0615%
Today Daily Open: 1.1382
Trends:
Previous Daily SMA20: 1.1349
Previous Daily SMA50: 1.1421
Previous Daily SMA100: 1.1518
Previous Daily SMA200: 1.1746
Levels:
Previous Daily High: 1.1413
Previous Daily Low: 1.1321
Previous Weekly High: 1.1402
Previous Weekly Low: 1.1267
Previous Monthly High: 1.15
Previous Monthly Low: 1.1216
Previous Daily Fibonacci 38.2%: 1.1378
Previous Daily Fibonacci 61.8%: 1.1356
Previous Daily Pivot Point S1: 1.1331
Previous Daily Pivot Point S2: 1.128
Previous Daily Pivot Point S3: 1.124
Previous Daily Pivot Point R1: 1.1423
Previous Daily Pivot Point R2: 1.1464
Previous Daily Pivot Point R3: 1.1515
Information on these pages contains forward-looking statements that involve risks and uncertainties. Markets and instruments profiled on this page are for informational purposes only and should not in any way come across as a recommendation to buy or sell in these assets. You should do your own thorough research before making any investment decisions. FXStreet does not in any way guarantee that this information is free from mistakes, errors, or material misstatements. It also does not guarantee that this information is of a timely nature. Investing in Open Markets involves a great deal of risk, including the loss of all or a portion of your investment, as well as emotional distress. All risks, losses and costs associated with investing, including total loss of principal, are your responsibility. The views and opinions expressed in this article are those of the authors and do not necessarily reflect the official policy or position of FXStreet nor its advertisers. The author will not be held responsible for information that is found at the end of links posted on this page.
If not otherwise explicitly mentioned in the body of the article, at the time of writing, the author has no position in any stock mentioned in this article and no business relationship with any company mentioned. The author has not received compensation for writing this article, other than from FXStreet.
FXStreet and the author do not provide personalized recommendations. The author makes no representations as to the accuracy, completeness, or suitability of this information. FXStreet and the author will not be liable for any errors, omissions or any losses, injuries or damages arising from this information and its display or use. Errors and omissions excepted.
The author and FXStreet are not registered investment advisors and nothing in this article is intended to be investment advice.
Recommended content
Editors’ Picks
AUD/USD hovers around 0.6500 amid light trading, ahead of US GDP

AUD/USD is trading close to 0.6500 in Asian trading on Thursday, lacking a clear directional impetus amid an Anzac Day holiday in Australia. Meanwhile, traders stay cautious due ti risk-aversion and ahead of the key US Q1 GDP release.
USD/JPY finds its highest bids since 1990, near 155.50

USD/JPY keeps breaking into its highest chart territory since June of 1990 early Thursday, testing 155.50 for the first time in 34 years as the Japanese Yen remains vulnerable, despite looming Japanese intervention risks. Focus shifts to Thursday's US GDP report and the BoJ decision on Friday.
Gold price treads water near $2,320, awaits US GDP data

Gold price recovers losses but keeps its range near $2,320 early Thursday. Renewed weakness in the US Dollar and the US Treasury yields allow Gold buyers to breathe a sigh of relief. Gold price stays vulnerable amid Middle East de-escalation, awaiting US Q1 GDP data.
Injective price weakness persists despite over 5.9 million INJ tokens burned
Injective price is trading with a bearish bias, stuck in the lower section of the market range. The bearish outlook abounds despite the network's deflationary efforts to pump the price. Coupled with broader market gloom, INJ token’s doomed days may not be over yet.
Meta Platforms Earnings: META sinks 10% on lower Q2 revenue guidance Premium

This must be "opposites" week. While Doppelganger Tesla rode horrible misses on Tuesday to a double-digit rally, Meta Platforms produced impressive beats above Wall Street consensus after the close on Wednesday, only to watch the share price collapse by nearly 10%.