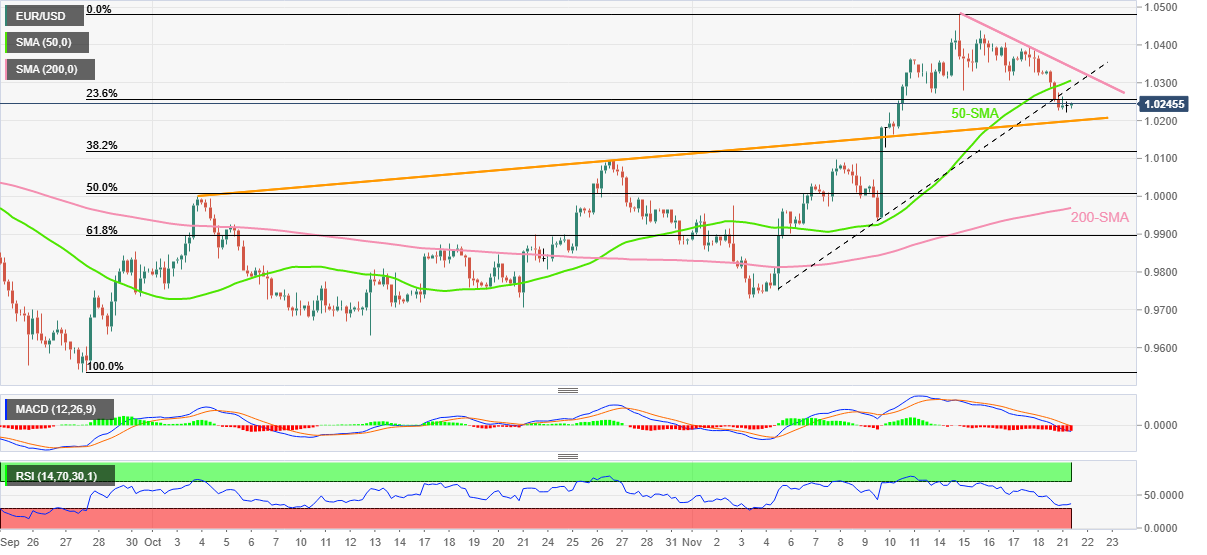
- EUR/USD bears take a breather around one-week low, probes three-day downtrend.
- Clear downside break of 50-SMA, one-week-old ascending trend line favors bears.
- RSI conditions, previous resistance line from early October challenge further downside.
EUR/USD struggles to extend the three-day downtrend while making rounds to the lowest levels in a week, around 1.0250, during early Tuesday.
Even so, the major currency pair remains on the bear’s radar as it defends the previous day’s downside break of the 50-bar Simple Moving Average (SMA) and an upward-sloping trend line from November 04.
In addition to the previous support line from early November and the 50-SMA, respectively around 1.0290 and 1.0310 in that order, a one-week-old descending trend line near 1.0345 also challenges the EUR/USD pair buyers.
Should the quote manage to remain firmer past 1.0345, the monthly high near 1.0480 and the late-June peak surrounding 1.0615 will gain the market’s attention.
Alternatively, the resistance-turned-support from October 04, close to 1.0195 by the press time, could restrict the EUR/USD pair’s immediate downside amid nearly oversold conditions of the Relative Strength Index (RSI) placed at 14.
If the EUR/USD bears keep the reins past 1.0195 support level, tops marked during late October around 1.0095 and the 200-SMA level surrounding 0.9970 will be in the spotlight.
To sum up, EUR/USD is likely to witness further downside but there prevails a lesser room to the south.
EUR/USD: Four-hour chart
Trend: Further downside expected
Information on these pages contains forward-looking statements that involve risks and uncertainties. Markets and instruments profiled on this page are for informational purposes only and should not in any way come across as a recommendation to buy or sell in these assets. You should do your own thorough research before making any investment decisions. FXStreet does not in any way guarantee that this information is free from mistakes, errors, or material misstatements. It also does not guarantee that this information is of a timely nature. Investing in Open Markets involves a great deal of risk, including the loss of all or a portion of your investment, as well as emotional distress. All risks, losses and costs associated with investing, including total loss of principal, are your responsibility. The views and opinions expressed in this article are those of the authors and do not necessarily reflect the official policy or position of FXStreet nor its advertisers. The author will not be held responsible for information that is found at the end of links posted on this page.
If not otherwise explicitly mentioned in the body of the article, at the time of writing, the author has no position in any stock mentioned in this article and no business relationship with any company mentioned. The author has not received compensation for writing this article, other than from FXStreet.
FXStreet and the author do not provide personalized recommendations. The author makes no representations as to the accuracy, completeness, or suitability of this information. FXStreet and the author will not be liable for any errors, omissions or any losses, injuries or damages arising from this information and its display or use. Errors and omissions excepted.
The author and FXStreet are not registered investment advisors and nothing in this article is intended to be investment advice.
Recommended content
Editors’ Picks
AUD/USD remained bid above 0.6500

AUD/USD extended further its bullish performance, advancing for the fourth session in a row on Thursday, although a sustainable breakout of the key 200-day SMA at 0.6526 still remain elusive.
EUR/USD faces a minor resistance near at 1.0750

EUR/USD quickly left behind Wednesday’s small downtick and resumed its uptrend north of 1.0700 the figure, always on the back of the persistent sell-off in the US Dollar ahead of key PCE data on Friday.
Gold holds around $2,330 after dismal US data

Gold fell below $2,320 in the early American session as US yields shot higher after the data showed a significant increase in the US GDP price deflator in Q1. With safe-haven flows dominating the markets, however, XAU/USD reversed its direction and rose above $2,340.
Bitcoin price continues to get rejected from $65K resistance as SEC delays decision on spot BTC ETF options

Bitcoin (BTC) price has markets in disarray, provoking a broader market crash as it slumped to the $62,000 range on Thursday. Meanwhile, reverberations from spot BTC exchange-traded funds (ETFs) continue to influence the market.
US economy: slower growth with stronger inflation

The dollar strengthened, and stocks fell after statistical data from the US. The focus was on the preliminary estimate of GDP for the first quarter. Annualised quarterly growth came in at just 1.6%, down from the 2.5% and 3.4% previously forecast.