- EUR/USD turns north once again, with eyes on the 100-DMA barrier.
- US dollar meets fresh supply amid improving market mood.
- The daily technical setup appears in favor of the EUR bulls.
EUR/USD is back on the bid above 1.2000, snapping three straight days of sluggishness. The US dollar has resumed its downtrend, helping the spot to make another attempt towards 1.2050. Eurozone/US PMIs will offer fresh cues later this Friday.
The greenback is losing ground once again, as the risk sentiment improves, with investors moving past the Bloomberg report, which cited that US President Joe Biden is considering hiking the capital gains to pay for his social plan.
The US tax hike chatters triggered a fresh sell-off in Wall Street indices and yields, boosting the haven demand for the greenback. Meanwhile, the European Central Bank (ECB) monetary policy announcement turned out to be a non-event, which disappointed the hawks and added to the weight on the euro.
EUR/USD technical outlook
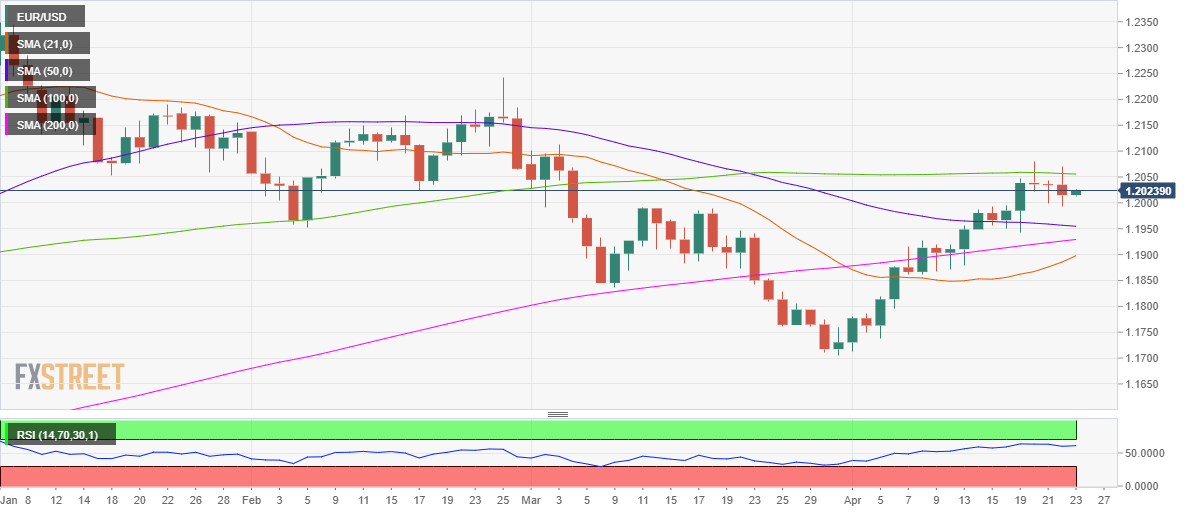
At the time of writing, the EUR/USD pair is challenging daily highs near 1.2025, as the bulls keep their sight once again on the critical 100-daily moving average (DMA) at 1.2055.
Note that the price has failed to find acceptance above that hurdle since March 4.
Recapturing that level is critical to extending the upside towards Thursday’s high of 1.2069.
EUR/USD daily chart
The 14-day Relative Strength Index (RSI) edges slightly higher above the midline, allowing room for more gains.
On the flip side, the mildly bearish 50-DMA at 1.1955 could offer strong support. Ahead of that the sellers could target the 1.2000 psychological mark.
EUR/USD additional levels to watch
Information on these pages contains forward-looking statements that involve risks and uncertainties. Markets and instruments profiled on this page are for informational purposes only and should not in any way come across as a recommendation to buy or sell in these assets. You should do your own thorough research before making any investment decisions. FXStreet does not in any way guarantee that this information is free from mistakes, errors, or material misstatements. It also does not guarantee that this information is of a timely nature. Investing in Open Markets involves a great deal of risk, including the loss of all or a portion of your investment, as well as emotional distress. All risks, losses and costs associated with investing, including total loss of principal, are your responsibility. The views and opinions expressed in this article are those of the authors and do not necessarily reflect the official policy or position of FXStreet nor its advertisers. The author will not be held responsible for information that is found at the end of links posted on this page.
If not otherwise explicitly mentioned in the body of the article, at the time of writing, the author has no position in any stock mentioned in this article and no business relationship with any company mentioned. The author has not received compensation for writing this article, other than from FXStreet.
FXStreet and the author do not provide personalized recommendations. The author makes no representations as to the accuracy, completeness, or suitability of this information. FXStreet and the author will not be liable for any errors, omissions or any losses, injuries or damages arising from this information and its display or use. Errors and omissions excepted.
The author and FXStreet are not registered investment advisors and nothing in this article is intended to be investment advice.
Recommended content
Editors’ Picks
EUR/USD clings to daily gains above 1.0650

EUR/USD gained traction and turned positive on the day above 1.0650. The improvement seen in risk mood following the earlier flight to safety weighs on the US Dollar ahead of the weekend and helps the pair push higher.
GBP/USD recovers toward 1.2450 after UK Retail Sales data

GBP/USD reversed its direction and advanced to the 1.2450 area after touching a fresh multi-month low below 1.2400 in the Asian session. The positive shift seen in risk mood on easing fears over a deepening Iran-Israel conflict supports the pair.
Gold holds steady at around $2,380 following earlier spike

Gold stabilized near $2,380 after spiking above $2,400 with the immediate reaction to reports of Israel striking Iran. Meanwhile, the pullback seen in the US Treasury bond yields helps XAU/USD hold its ground.
Bitcoin Weekly Forecast: BTC post-halving rally could be partially priced in Premium

Bitcoin price shows no signs of directional bias while it holds above $60,000. The fourth BTC halving is partially priced in, according to Deutsche Bank’s research.
Geopolitics once again take centre stage, as UK Retail Sales wither

Nearly a week to the day when Iran sent drones and missiles into Israel, Israel has retaliated and sent a missile into Iran. The initial reports caused a large uptick in the oil price.