- EUR/JPY buyers attack 13-day-old resistance line after flashing a bullish candlestick the previous day.
- Upward sloping SMA, strong RSI line favor the bulls.
- Bears need to break an ascending support line from January 18.
EUR/JPY picks up bids around 130.26, up 0.08% on a day, during Tuesday’s Asian session. In doing so, the pair respects the previous day’s bullish candlestick formation, Dragonfly Doji, amid upbeat RSI conditions.
While the 130.30 immediate hurdle, comprising a downward sloping resistance line from March 18, is on the cusps of an upside break, the previous month’s top, also the highest since October 2018 near 130.67, will be the key to watch afterward.
Although RSI might have turned overbought by then, which in turn suggests pullback, any further rise past-130.67 will not hesitate to cross the 131.00 threshold.
Alternatively, a pullback from the current levels needs to slip beneath Monday’s low of 129.83 to defy the bullish candle. However, the pair’s consolidation towards the 130.00 can’t be ruled out.
It should, however, be noted that the EUR/JPY sellers will remain cautious before breaking an ascending support line from mid-January, around 128.90. Though, fresh short-term selling could be initiated on the downside break of 10-day SMA, near 129.50 by the press time.
To sum up, EUR/JPY remains on the bull’s radar and is ready to escalate the run-up but a rally in the prices is less likely.
EUR/JPY daily chart
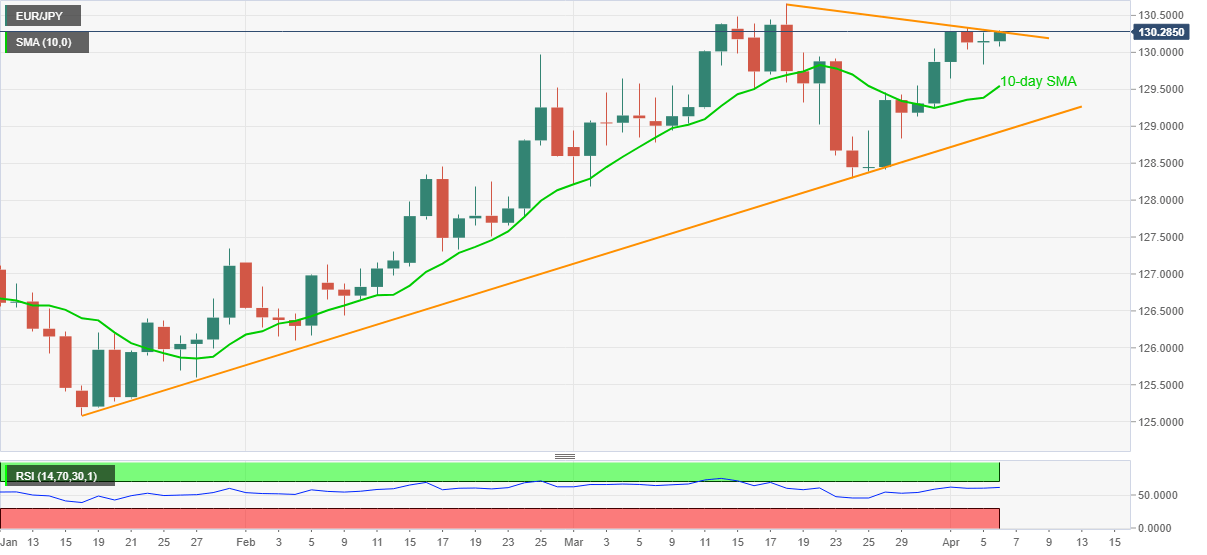
Trend: Bullish
Information on these pages contains forward-looking statements that involve risks and uncertainties. Markets and instruments profiled on this page are for informational purposes only and should not in any way come across as a recommendation to buy or sell in these assets. You should do your own thorough research before making any investment decisions. FXStreet does not in any way guarantee that this information is free from mistakes, errors, or material misstatements. It also does not guarantee that this information is of a timely nature. Investing in Open Markets involves a great deal of risk, including the loss of all or a portion of your investment, as well as emotional distress. All risks, losses and costs associated with investing, including total loss of principal, are your responsibility. The views and opinions expressed in this article are those of the authors and do not necessarily reflect the official policy or position of FXStreet nor its advertisers. The author will not be held responsible for information that is found at the end of links posted on this page.
If not otherwise explicitly mentioned in the body of the article, at the time of writing, the author has no position in any stock mentioned in this article and no business relationship with any company mentioned. The author has not received compensation for writing this article, other than from FXStreet.
FXStreet and the author do not provide personalized recommendations. The author makes no representations as to the accuracy, completeness, or suitability of this information. FXStreet and the author will not be liable for any errors, omissions or any losses, injuries or damages arising from this information and its display or use. Errors and omissions excepted.
The author and FXStreet are not registered investment advisors and nothing in this article is intended to be investment advice.
Recommended content
Editors’ Picks
EUR/USD regains traction, recovers above 1.0700

EUR/USD regained its traction and turned positive on the day above 1.0700 in the American session. The US Dollar struggles to preserve its strength after the data from the US showed that the economy grew at a softer pace than expected in Q1.
GBP/USD returns to 1.2500 area in volatile session

GBP/USD reversed its direction and recovered to 1.2500 after falling to the 1.2450 area earlier in the day. Although markets remain risk-averse, the US Dollar struggles to find demand following the disappointing GDP data.
Gold holds around $2,330 after dismal US data

Gold fell below $2,320 in the early American session as US yields shot higher after the data showed a significant increase in the US GDP price deflator in Q1. With safe-haven flows dominating the markets, however, XAU/USD reversed its direction and rose above $2,340.
XRP extends its decline, crypto experts comment on Ripple stablecoin and benefits for XRP Ledger

Ripple extends decline to $0.52 on Thursday, wipes out weekly gains. Crypto expert asks Ripple CTO how the stablecoin will benefit the XRP Ledger and native token XRP.
After the US close, it’s the Tokyo CPI

After the US close, it’s the Tokyo CPI, a reliable indicator of the national number and then the BoJ policy announcement. Tokyo CPI ex food and energy in Japan was a rise to 2.90% in March from 2.50%.