- EUR/JPY is set to finish the week with decent gains of 0.88% after being down 2.40%.
- Short term, an EUR/JPY break above 147.00 will expose the YTD high; otherwise, a fall toward 146.00 is on the cards.
The EUR/JPY rebounds from a one-month-old upslope trendline and climbs back above 146.00, following the European Central Bank (ECB) monetary policy decision, which ended with the ECB lifting rates and laying the ground for subsequent hikes. However, the markets perceived a dovish hike, as the Euro dived against most G8 currencies. At the time of writing, the EUR/JPY is trading at 146.81, gaining 0.76%.
EUR/JPY Price Analysis: Technical outlook
The EUR/JPY daily chart illustrates the pair as upward biased, even though the Bank of Japan (BoJ) intervention was fruitful with the USD/JPY, dragging alongside some other Japanese Yen (JPY) crosses, including the EUR/JPY. However, since reaching a weekly low at 143.72, the cross-currency pair rallied 300 pips, set for weekly gains of almost 1%.
However, it should be noted that the Relative Strength Index (RSI), albeit in bullish territory, it has a downward slope. So, as price action registers successive series of higher highs, the RSI does the opposite, setting the pair for a negative divergence.
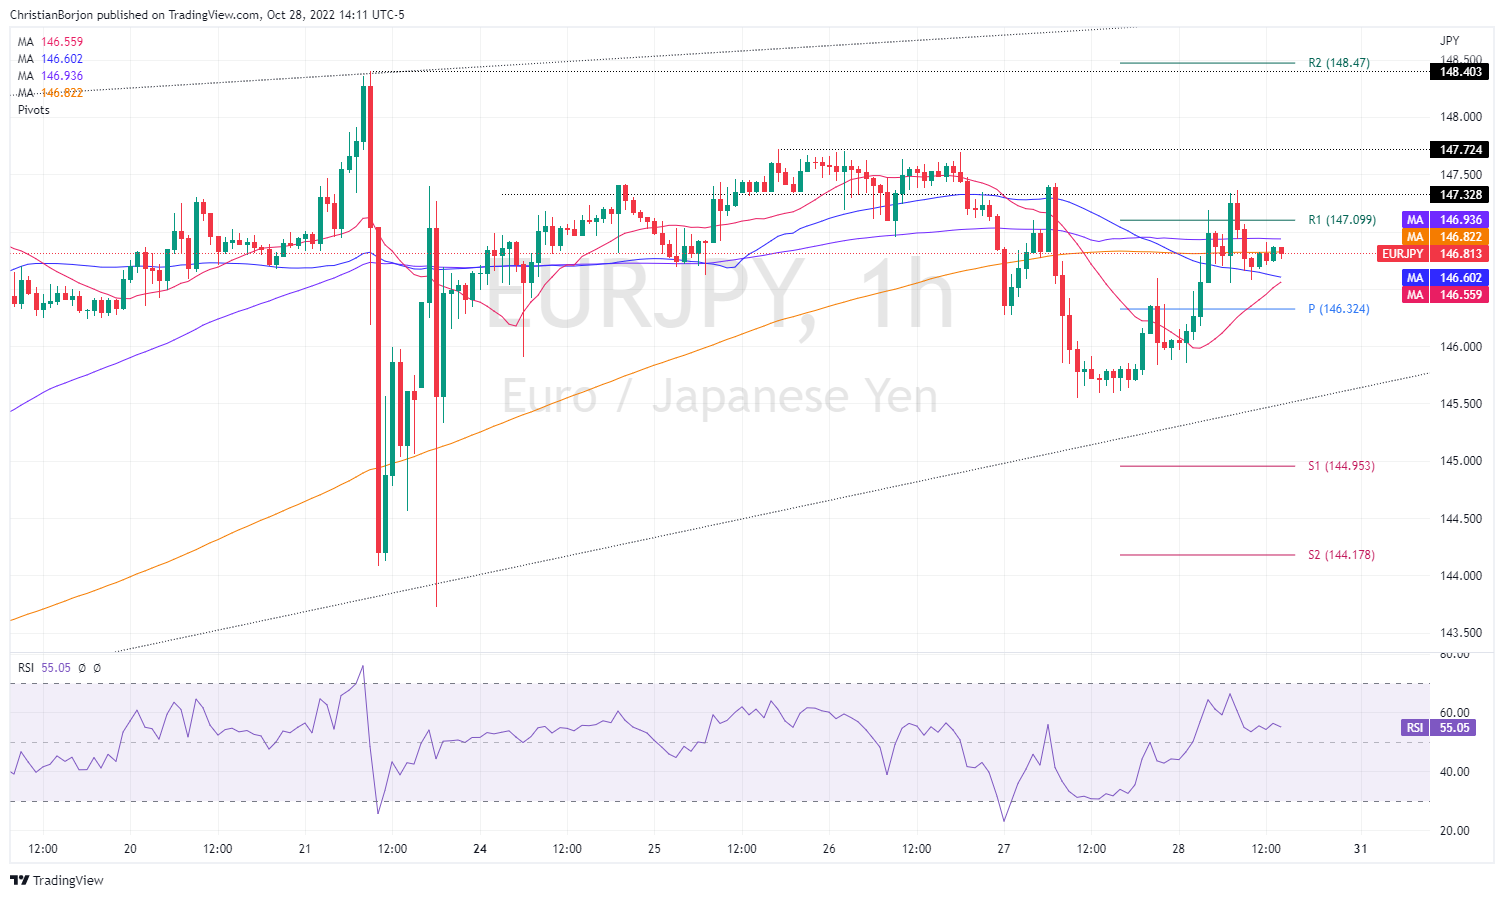
Short term, the EUR/JPY hourly chart portrays the pair as range-bound, with risks skewed to the upside due to the Exponential Moving Averages (EMAs) lying below the spot price, except for the 100-EMA, which sits around 146.93, a difficult resistance level to hurdle. But once it’s cleared, the next resistance would be 147.00, followed by the October 25 daily high at 147.72, ahead of the YTD high at 148.40.
On the flip side, if the EUR/JPY tumbles below the 200-EMA, the next demand area would be the confluence of the 20 and 50-EMAs around 146.55/60, once cleared, could lay the way towards the daily pivot at 146.32, ahead of the 146.00 figure.
EUR/JPY Key Technical Levels
Information on these pages contains forward-looking statements that involve risks and uncertainties. Markets and instruments profiled on this page are for informational purposes only and should not in any way come across as a recommendation to buy or sell in these assets. You should do your own thorough research before making any investment decisions. FXStreet does not in any way guarantee that this information is free from mistakes, errors, or material misstatements. It also does not guarantee that this information is of a timely nature. Investing in Open Markets involves a great deal of risk, including the loss of all or a portion of your investment, as well as emotional distress. All risks, losses and costs associated with investing, including total loss of principal, are your responsibility. The views and opinions expressed in this article are those of the authors and do not necessarily reflect the official policy or position of FXStreet nor its advertisers. The author will not be held responsible for information that is found at the end of links posted on this page.
If not otherwise explicitly mentioned in the body of the article, at the time of writing, the author has no position in any stock mentioned in this article and no business relationship with any company mentioned. The author has not received compensation for writing this article, other than from FXStreet.
FXStreet and the author do not provide personalized recommendations. The author makes no representations as to the accuracy, completeness, or suitability of this information. FXStreet and the author will not be liable for any errors, omissions or any losses, injuries or damages arising from this information and its display or use. Errors and omissions excepted.
The author and FXStreet are not registered investment advisors and nothing in this article is intended to be investment advice.
Recommended content
Editors’ Picks
EUR/USD clings to gains near 1.0700, awaits key US data

EUR/USD clings to gains near the 1.0700 level in early Europe on Thursday. Renewed US Dollar weakness offsets the risk-off market environment, supporting the pair ahead of the key US GDP and PCE inflation data.
USD/JPY keeps pushing higher, eyes 156.00 ahead of US GDP data

USD/JPY keeps breaking into its highest chart territory since June of 1990 early Thursday, recapturing 155.50 for the first time in 34 years as the Japanese Yen remains vulnerable, despite looming intervention risks. The focus shifts to Thursday's US GDP report and the BoJ decision on Friday.
Gold price lacks firm intraday direction, holds steady above $2,300 ahead of US data

Gold price remains confined in a narrow band for the second straight day on Thursday. Reduced Fed rate cut bets and a positive risk tone cap the upside for the commodity. Traders now await key US macro data before positioning for the near-term trajectory.
Injective price weakness persists despite over 5.9 million INJ tokens burned
Injective price is trading with a bearish bias, stuck in the lower section of the market range. The bearish outlook abounds despite the network's deflationary efforts to pump the price. Coupled with broader market gloom, INJ token’s doomed days may not be over yet.
Meta takes a guidance slide amidst the battle between yields and earnings

Meta's disappointing outlook cast doubt on whether the market's enthusiasm for artificial intelligence. Investors now brace for significant macroeconomic challenges ahead, particularly with the release of first-quarter gross domestic product (GDP) data on Thursday.