- EUR/JPY consolidates gains in the Asian session.
- Cross is in a continuous uptrend since April.
- Momentum oscillator in overbought zone warns of aggressive bets.
The EUR/JPY price trades cautiously on Thursday morning in the Asian trading hours. The cross-currency pair moves in a very narrow trade band.
As of writing, EUR/JPY trades at 133.51 with 0.02% gains on the day.
EUR/JPY daily chart
-637588790511478292.png)
On the daily chart, the EUR/JPY pair has been trading in a monthly upward trend beginning in late April.
For instance, the following prior analysis, EUR/JPY Price Analysis: Bulls seek break of 21-D EMA, had earmarked the confluence of the 61.8% Fibo and the neckline of the M-formation near 133.65 as a target for the bulls as follows:
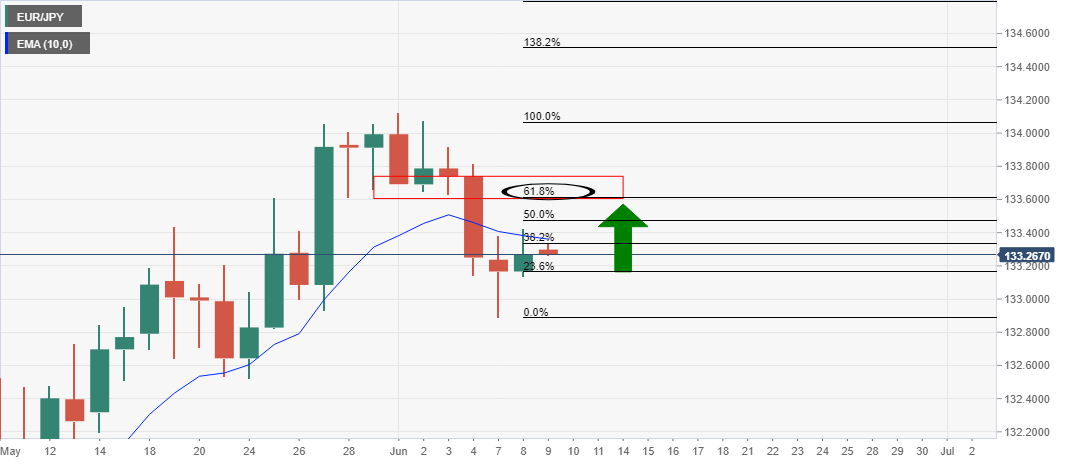
Meanwhile, EUR/JPY faces rejection near the 134.00 mark and consolidates in a broader trading range of 133.00-134.15.
If the price sustains above the session’s high at 133.56, then it has the potential to reach the June 4 high at 133.81 followed by the June 2 high at 134.07.
The Moving Average Convergence (MACD) indicator holds onto an overbought trajectory with bearish momentum. Any uptick in the MACD would prompt EUR/JPY bulls to aim for the levels last seen in 2017. The pair would seek November 2017 high at 134.15.
Alternatively, if the price moves lower, then it could first target the 20-day Simple Moving Average (SMA) at 133.06. It would mark the breach of the 20-day SMA. The cross would spot the next target at the 23.6% Fibonacci retracement, which extends from the lows of 129.59, at 132.92.
The price action would encourage EUR bears to attract the May 24 low at 132.52.
EUR/JPY additional levels
Note: All information on this page is subject to change. The use of this website constitutes acceptance of our user agreement. Please read our privacy policy and legal disclaimer. Opinions expressed at FXstreet.com are those of the individual authors and do not necessarily represent the opinion of FXstreet.com or its management. Risk Disclosure: Trading foreign exchange on margin carries a high level of risk, and may not be suitable for all investors. The high degree of leverage can work against you as well as for you. Before deciding to invest in foreign exchange you should carefully consider your investment objectives, level of experience, and risk appetite. The possibility exists that you could sustain a loss of some or all of your initial investment and therefore you should not invest money that you cannot afford to lose. You should be aware of all the risks associated with foreign exchange trading, and seek advice from an independent financial advisor if you have any doubts.
Recommended content
Editors’ Picks
EUR/USD clings to daily gains above 1.0650

EUR/USD gained traction and turned positive on the day above 1.0650. The improvement seen in risk mood following the earlier flight to safety weighs on the US Dollar ahead of the weekend and helps the pair push higher.
GBP/USD recovers toward 1.2450 after UK Retail Sales data

GBP/USD reversed its direction and advanced to the 1.2450 area after touching a fresh multi-month low below 1.2400 in the Asian session. The positive shift seen in risk mood on easing fears over a deepening Iran-Israel conflict supports the pair.
Gold holds steady at around $2,380 following earlier spike

Gold stabilized near $2,380 after spiking above $2,400 with the immediate reaction to reports of Israel striking Iran. Meanwhile, the pullback seen in the US Treasury bond yields helps XAU/USD hold its ground.
Bitcoin Weekly Forecast: BTC post-halving rally could be partially priced in Premium

Bitcoin price shows no signs of directional bias while it holds above $60,000. The fourth BTC halving is partially priced in, according to Deutsche Bank’s research.
Week ahead – US GDP and BoJ decision on top of next week’s agenda

US GDP, core PCE and PMIs the next tests for the Dollar. Investors await BoJ for guidance about next rate hike. EU and UK PMIs, as well as Australian CPIs also on tap.