- AUD/USD fades bounce off intraday low, mildly offered around January’s peak.
- Resistance-turned-support from mid-November, 50% Fibonacci retracement limits further downside.
- Multiple hurdles to challenge bulls below 0.7371, oscillators favor upside momentum.
AUD/USD bulls take a breather around a seven-week high, pressured towards the intraday low of 0.7275 during early Thursday morning in Europe.
In doing so, the Aussie pair takes a U-turn from the multi-day high marked the previous day.
However, the quote holds on to the latest breakout of a descending trend line from November 15.
Other than the trend line breakout, bullish MACD signals and firmer RSI line also favor the AUD/USD buyers until the quote drops back below the previous resistance line, near 0.7260 at the latest. It’s worth noting that the 50% Fibonacci retracement of the pair’s downside from October 2021 to January 2022 adds strength to the 0.7260 support.
Even if the quote breaks lower, the 100-DMA support level of 0.7230 will try to defend the AUD/USD bulls, failing to which can recall the early January’s low near 0.7130 to the chart.
Meanwhile, the pair’s fresh upside will aim for January’s top of 0.7315 but the 200-DMA and 61.8% Fibo, close 0.7330-35, will challenge the pair bulls afterward.
In a case where the AUD/USD prices rise past 0.7335, the November 15 swing high of 0.7371 will be crucial resistance to watch.
AUD/USD: Daily chart
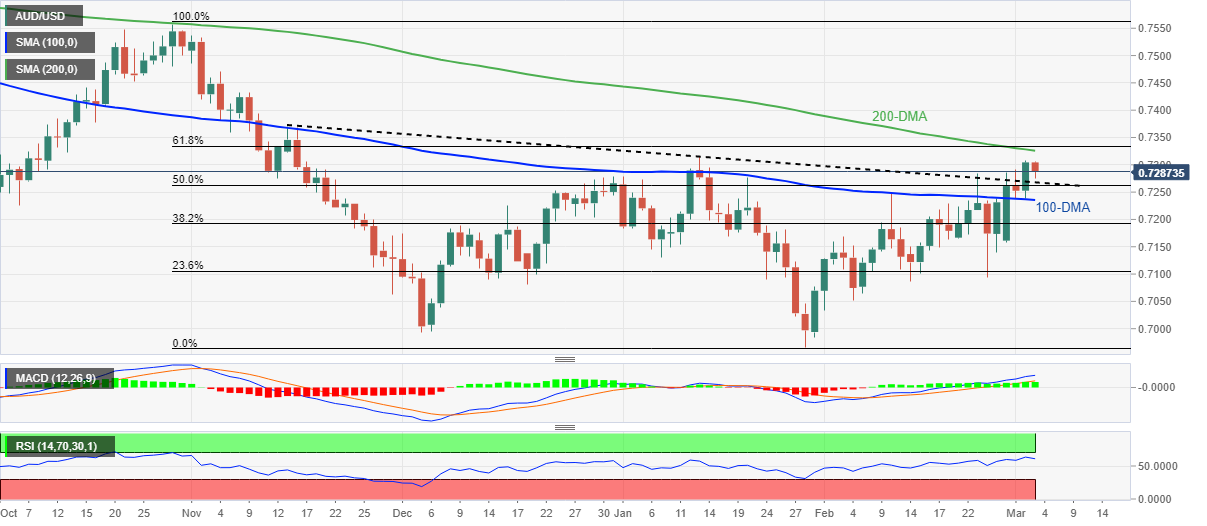
Trend: Further upside expected
Information on these pages contains forward-looking statements that involve risks and uncertainties. Markets and instruments profiled on this page are for informational purposes only and should not in any way come across as a recommendation to buy or sell in these assets. You should do your own thorough research before making any investment decisions. FXStreet does not in any way guarantee that this information is free from mistakes, errors, or material misstatements. It also does not guarantee that this information is of a timely nature. Investing in Open Markets involves a great deal of risk, including the loss of all or a portion of your investment, as well as emotional distress. All risks, losses and costs associated with investing, including total loss of principal, are your responsibility. The views and opinions expressed in this article are those of the authors and do not necessarily reflect the official policy or position of FXStreet nor its advertisers. The author will not be held responsible for information that is found at the end of links posted on this page.
If not otherwise explicitly mentioned in the body of the article, at the time of writing, the author has no position in any stock mentioned in this article and no business relationship with any company mentioned. The author has not received compensation for writing this article, other than from FXStreet.
FXStreet and the author do not provide personalized recommendations. The author makes no representations as to the accuracy, completeness, or suitability of this information. FXStreet and the author will not be liable for any errors, omissions or any losses, injuries or damages arising from this information and its display or use. Errors and omissions excepted.
The author and FXStreet are not registered investment advisors and nothing in this article is intended to be investment advice.
Recommended content
Editors’ Picks
How will US Dollar react to Q1 GDP data? – LIVE

The US' GDP is forecast to grow at an annual rate of 2.5% in the first quarter of the year. The US Dollar struggles to find demand as investors stay on the sidelines, while waiting to assess the impact of the US economic performance on the Fed rate outlook.
EUR/USD holds gains above 1.0700, as key US data loom

EUR/USD holds gains above 1.0700 in the European session on Thursday. Renewed US Dollar weakness offsets the risk-off market environment, supporting the pair ahead of the key US GDP and PCE inflation data.
GBP/USD extends recovery above 1.2500, awaits US GDP data

GBP/USD is catching a fresh bid wave, rising above 1.2500 in European trading on Thursday. The US Dollar resumes its corrective downside, as traders resort to repositioning ahead of the high-impact US advance GDP data for the first quarter.
Gold price edges higher amid weaker USD and softer risk tone, focus remains on US GDP

Gold price (XAU/USD) attracts some dip-buying in the vicinity of the $2,300 mark on Thursday and for now, seems to have snapped a three-day losing streak, though the upside potential seems limited.
XRP extends its decline, crypto experts comment on Ripple stablecoin and benefits for XRP Ledger

Ripple extends decline to $0.52 on Thursday, wipes out weekly gains. Crypto expert asks Ripple CTO how the stablecoin will benefit the XRP Ledger and native token XRP.