- AUD/USD witnessed heavy selling for the third straight day and tumbled to fresh multi-month lows.
- The set-up remains tilted in favour of bearish traders and supports prospects for further weakness.
- Only a sustained move back above the 0.7765-70 region will negate the near-term bearish outlook.
The AUD/USD pair witnessed some heavy selling during the early European session and dropped to fresh multi-week lows, around the 0.7675 region in the last hour. The downfall marked the third consecutive day of a negative move and was exclusively sponsored by a broad-based US dollar strength.
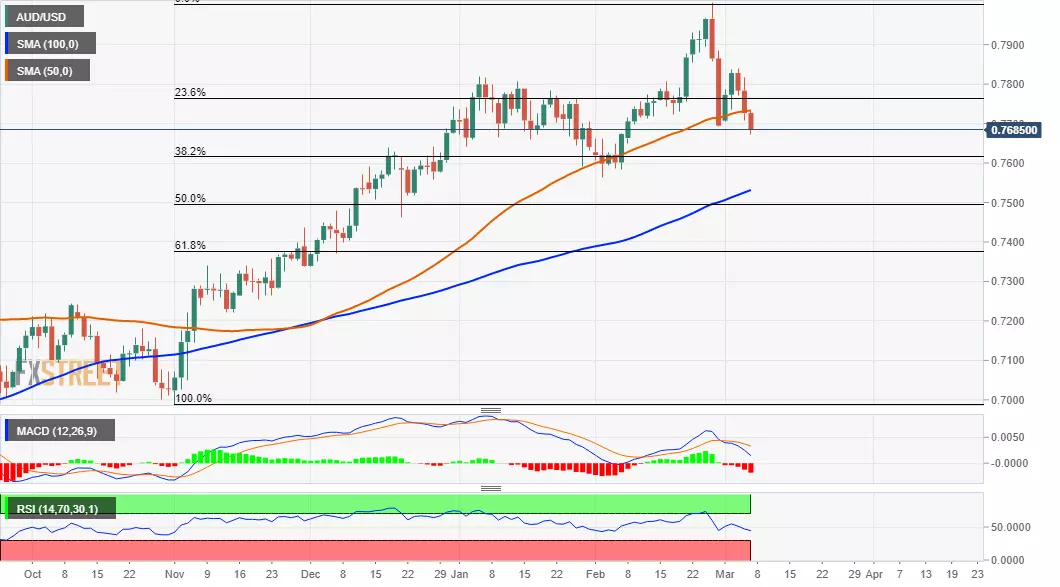
From a technical perspective, bearish acceptance below the 0.7700 round-figure mark might have already set the stage for an extension of the recent downward trajectory. The AUD/USD pair seems all set to extend the recent sharp rejection slide from the key 0.8000 psychological mark, or three-year tops.
The bearish outlook is further reinforced by the fact that technical indicators on the daily chart have just started drifting into negative territory. Hence, a subsequent fall towards testing intermediate support, around the 0.7610-0.7600 congestion zone, remains a distinct possibility.
The latter coincides with the 38.2% Fibonacci level of the 0.6990-0.8008 strong positive move. Some follow-through weakness below will be seen as a fresh trigger for bearish traders. The AUD/USD pair might then accelerate the slide towards the 50% Fibo. level, around the 0.7500 round-figure mark.
On the flip side, the 0.7700 level now seems to act as immediate strong resistance. Any further recovery beyond the mentioned handle might still be seen as a selling opportunity and runs the risk of fizzling out rather quickly near the 23.6% Fibo. level, around the 0.7765-70 region.
The AUD/USD pair needs to decisively break through the said hurdle to negate the near-term bearish outlook. This, in turn, might trigger a short-covering move, which should assist bulls to reclaim the 0.7800 mark and aim to test the next relevant resistance near the 0.7835-40 supply zone.
AUD/USD daily chart
Technical levels to watch
Information on these pages contains forward-looking statements that involve risks and uncertainties. Markets and instruments profiled on this page are for informational purposes only and should not in any way come across as a recommendation to buy or sell in these assets. You should do your own thorough research before making any investment decisions. FXStreet does not in any way guarantee that this information is free from mistakes, errors, or material misstatements. It also does not guarantee that this information is of a timely nature. Investing in Open Markets involves a great deal of risk, including the loss of all or a portion of your investment, as well as emotional distress. All risks, losses and costs associated with investing, including total loss of principal, are your responsibility. The views and opinions expressed in this article are those of the authors and do not necessarily reflect the official policy or position of FXStreet nor its advertisers. The author will not be held responsible for information that is found at the end of links posted on this page.
If not otherwise explicitly mentioned in the body of the article, at the time of writing, the author has no position in any stock mentioned in this article and no business relationship with any company mentioned. The author has not received compensation for writing this article, other than from FXStreet.
FXStreet and the author do not provide personalized recommendations. The author makes no representations as to the accuracy, completeness, or suitability of this information. FXStreet and the author will not be liable for any errors, omissions or any losses, injuries or damages arising from this information and its display or use. Errors and omissions excepted.
The author and FXStreet are not registered investment advisors and nothing in this article is intended to be investment advice.
Recommended content
Editors’ Picks
EUR/USD regains traction, recovers above 1.0700

EUR/USD regained its traction and turned positive on the day above 1.0700 in the American session. The US Dollar struggles to preserve its strength after the data from the US showed that the economy grew at a softer pace than expected in Q1.
GBP/USD returns to 1.2500 area in volatile session

GBP/USD reversed its direction and recovered to 1.2500 after falling to the 1.2450 area earlier in the day. Although markets remain risk-averse, the US Dollar struggles to find demand following the disappointing GDP data.
Gold holds around $2,330 after dismal US data

Gold fell below $2,320 in the early American session as US yields shot higher after the data showed a significant increase in the US GDP price deflator in Q1. With safe-haven flows dominating the markets, however, XAU/USD reversed its direction and rose above $2,340.
XRP extends its decline, crypto experts comment on Ripple stablecoin and benefits for XRP Ledger

Ripple extends decline to $0.52 on Thursday, wipes out weekly gains. Crypto expert asks Ripple CTO how the stablecoin will benefit the XRP Ledger and native token XRP.
After the US close, it’s the Tokyo CPI

After the US close, it’s the Tokyo CPI, a reliable indicator of the national number and then the BoJ policy announcement. Tokyo CPI ex food and energy in Japan was a rise to 2.90% in March from 2.50%.