- AUD/JPY keeps the upside break of two-day-old resistance line, now support, to refresh intraday high after RBA.
- RBA left monetary policy unchanged with a 0.25% cash rate, decision-makers showed readiness for further policy accommodation.
- Sustained break of the two-week-old falling trend line, bullish MACD favors the buyers.
AUD/JPY refreshes the intraday high to 75.71, currently around 75.62, following the RBA’s status-quo, during the early Tuesday. The pair carries its early-Asian break of a falling trend line from Friday while also stretching the run-up after crossing the downward sloping trend line from July 22.
Read: RBA: Accommodative approach will be maintained as long as it is required
Considering the market’s upbeat reaction to the RBA monetary policy meeting, coupled with the technical breakout, the quote is likely to attack 76.00 during its further rise. Though, the initial July 23 bottom surrounding 76.40 and the July month top near 76.90 could challenge the bulls afterward.
In a case where the pair manages to cross 76.90, it needs to sustain the run-up beyond 77.00 to aim for February low near 77.45.
On the contrary, the resistance-turned-supports around 75.50 and 74.90, comprising respective trend lines from July 31 and 22, will join an ascending support line from July 30, near 75.25 to challenge the quote’s immediate downside.
If at all the bears dominate past-74.90, the previous month’s bottom near 73.90 will be in the spotlight.
AUD/JPY hourly chart
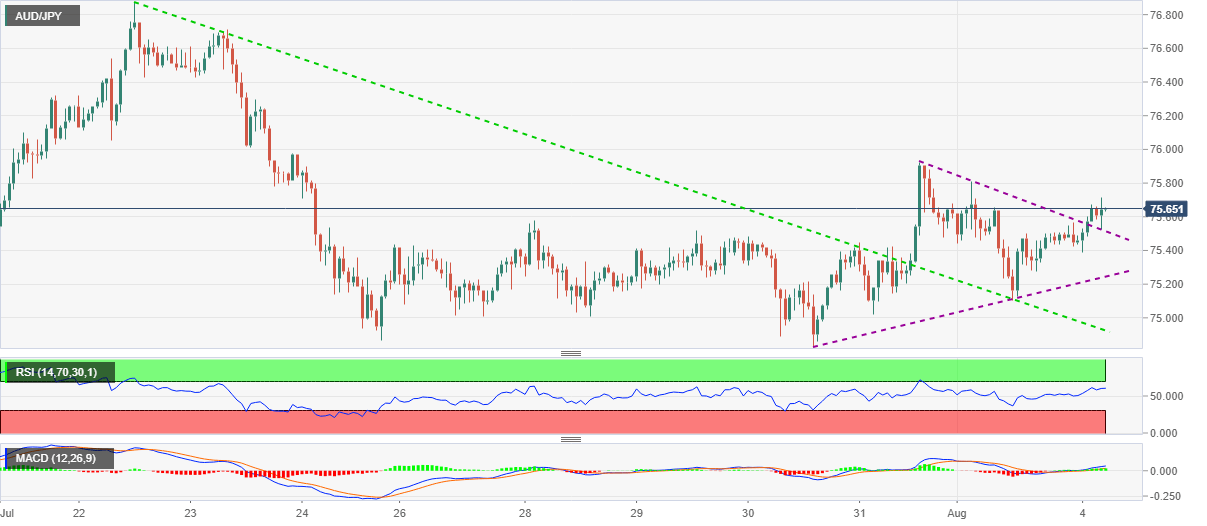
Trend: Bullish
Information on these pages contains forward-looking statements that involve risks and uncertainties. Markets and instruments profiled on this page are for informational purposes only and should not in any way come across as a recommendation to buy or sell in these assets. You should do your own thorough research before making any investment decisions. FXStreet does not in any way guarantee that this information is free from mistakes, errors, or material misstatements. It also does not guarantee that this information is of a timely nature. Investing in Open Markets involves a great deal of risk, including the loss of all or a portion of your investment, as well as emotional distress. All risks, losses and costs associated with investing, including total loss of principal, are your responsibility. The views and opinions expressed in this article are those of the authors and do not necessarily reflect the official policy or position of FXStreet nor its advertisers. The author will not be held responsible for information that is found at the end of links posted on this page.
If not otherwise explicitly mentioned in the body of the article, at the time of writing, the author has no position in any stock mentioned in this article and no business relationship with any company mentioned. The author has not received compensation for writing this article, other than from FXStreet.
FXStreet and the author do not provide personalized recommendations. The author makes no representations as to the accuracy, completeness, or suitability of this information. FXStreet and the author will not be liable for any errors, omissions or any losses, injuries or damages arising from this information and its display or use. Errors and omissions excepted.
The author and FXStreet are not registered investment advisors and nothing in this article is intended to be investment advice.
Recommended content
Editors’ Picks
EUR/USD clings to daily gains above 1.0650

EUR/USD gained traction and turned positive on the day above 1.0650. The improvement seen in risk mood following the earlier flight to safety weighs on the US Dollar ahead of the weekend and helps the pair push higher.
GBP/USD recovers toward 1.2450 after UK Retail Sales data

GBP/USD reversed its direction and advanced to the 1.2450 area after touching a fresh multi-month low below 1.2400 in the Asian session. The positive shift seen in risk mood on easing fears over a deepening Iran-Israel conflict supports the pair.
Gold holds steady at around $2,380 following earlier spike

Gold stabilized near $2,380 after spiking above $2,400 with the immediate reaction to reports of Israel striking Iran. Meanwhile, the pullback seen in the US Treasury bond yields helps XAU/USD hold its ground.
Bitcoin Weekly Forecast: BTC post-halving rally could be partially priced in Premium

Bitcoin price shows no signs of directional bias while it holds above $60,000. The fourth BTC halving is partially priced in, according to Deutsche Bank’s research.
Week ahead – US GDP and BoJ decision on top of next week’s agenda

US GDP, core PCE and PMIs the next tests for the Dollar. Investors await BoJ for guidance about next rate hike. EU and UK PMIs, as well as Australian CPIs also on tap.