- BABA stock rallies over 10% on Monday in broad rally.
- Chinese names have suffered as DIDI delisting hits sentiment.
- BABA and others rally on Monday as China cuts commercial bank reserve requirements.
Chinese stocks are nothing if not volatile, and this continued on Monday with huge rallies in most names. The reason was that China cut the reserve requirement for commercial banks in an effort to try and pump liquidity into the system. This can be taken two ways, and investors chose to see the positives.
China is struggling to contain problems in the banking and property sectors from spreading, and the travails of Evergrande Group have been well documented. Evergrande was due to pay $82.5 million on Monday, but we are still in the dark on whether it met this latest payment or not. Bloomberg is reporting that another Chinese developer, Kaisa Group Holdings, received a forbearance proposal from bondholders on Tuesday. A forbearance proposal would be a form of an agreed delay or reduction in repayments. If agreed by both bondholders and the company, it averts a formal debt default.
-637744752707374632.png)
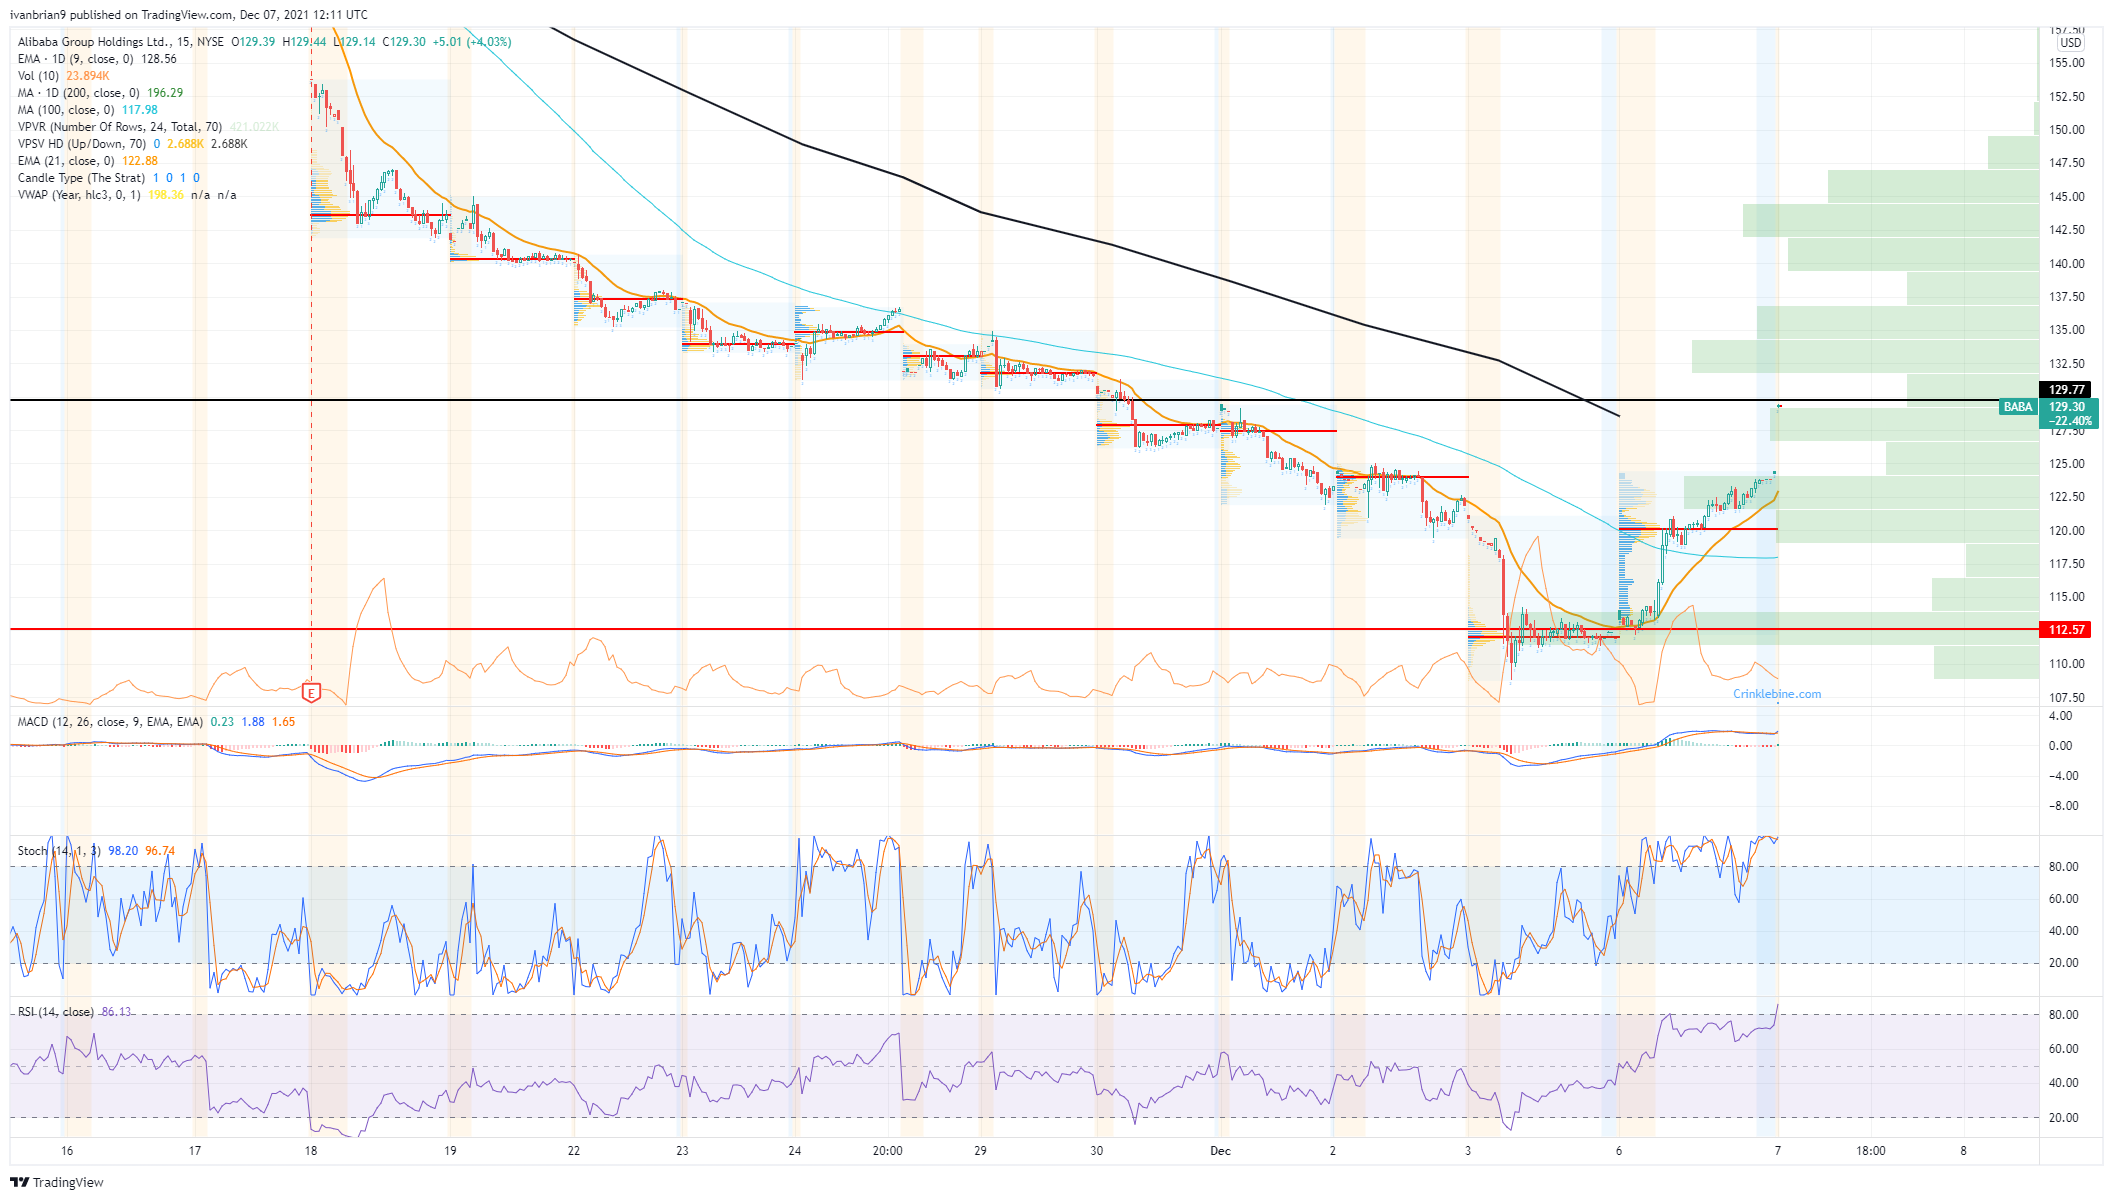
BABA chart, 15-minute
Alibaba (BABA) stock news
BABA stock has been under pressure throughout 2021 as a wave of negative sentiment hit Chinese equities and in particular Chinese tech names. This was kickstarted by BABA itself as it had to shelve the proposed spin-off IPO of ANT Group late in 2020. China then began taking a more cautious approach to its tech sector as worries over the huge amounts of data generated by them escalated. Didi Group (DIDI) did manage to get its IPO off the ground in New York but now plans to delist to Hong Kong. Alibaba stock is down 47% so far in 2021 and 22% over the last month as the sell-off has accelerated.
Alibaba (BABA) stock forecast
Investors may rejoice at the current bounce in Chinese tech stocks, but this has all the makings of yet another dead cat bounce. Take a look at the monthly chart below. BABA has broken the huge $130 level, which was really the last hope of support. Now it is lookout below until $100. The longer-term view is strongly negative until $169 is broken to the upside.
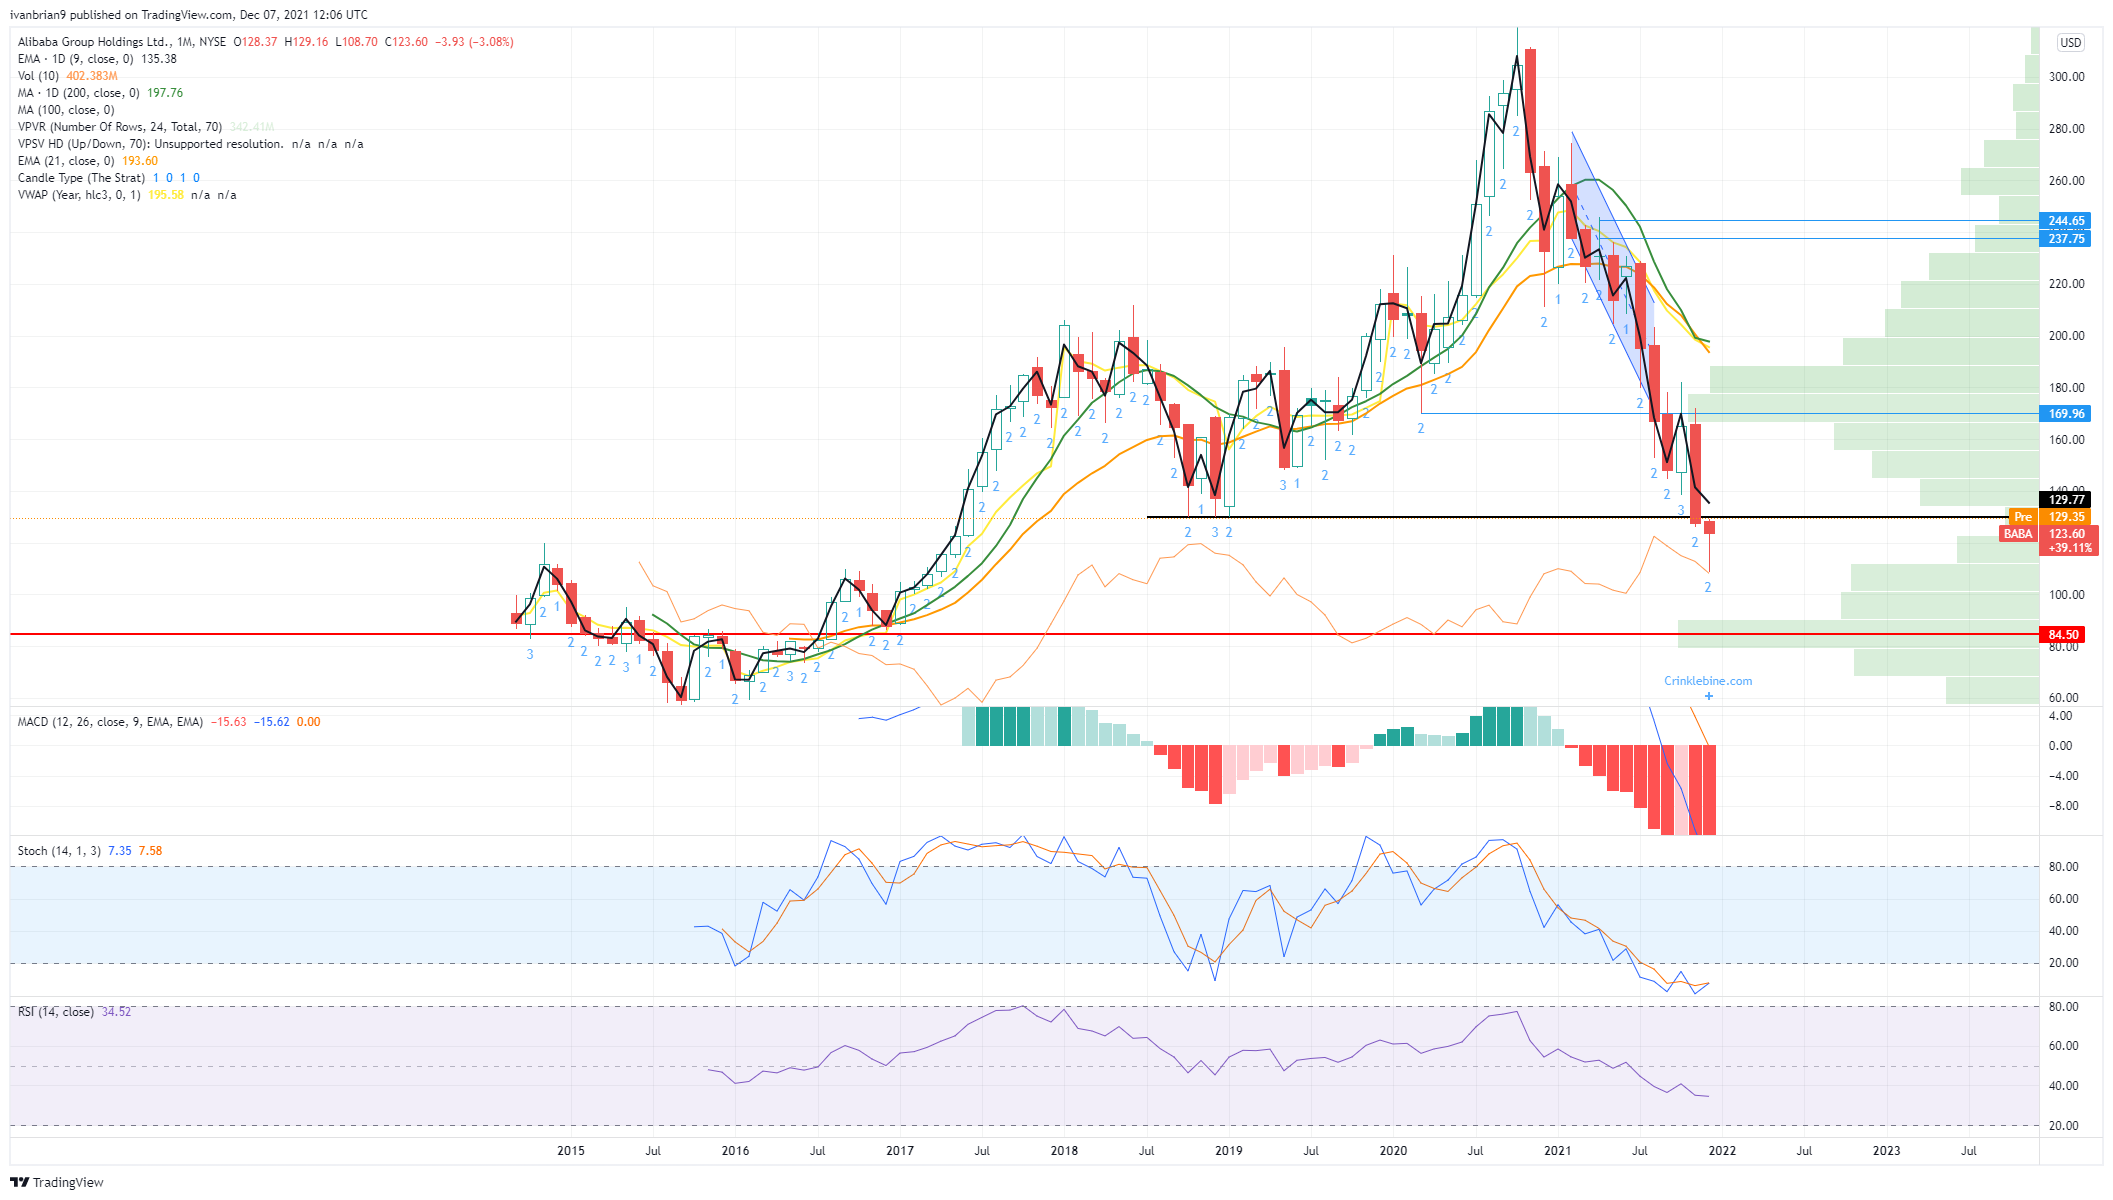
Alibaba chart, monthly
Shorter-term traders will be aware of the 9-day moving average offering resistance at $127.56. The MACD, stochastics and RSI all remain in bearish territory. The 15-minute chart does show short-term support at $112 with a large amount of volume at that level on Friday that provided a base for Monday's rally. This may carry on for Tuesday as risk assets are due to bounce, but $130 will likely cap any further gains.
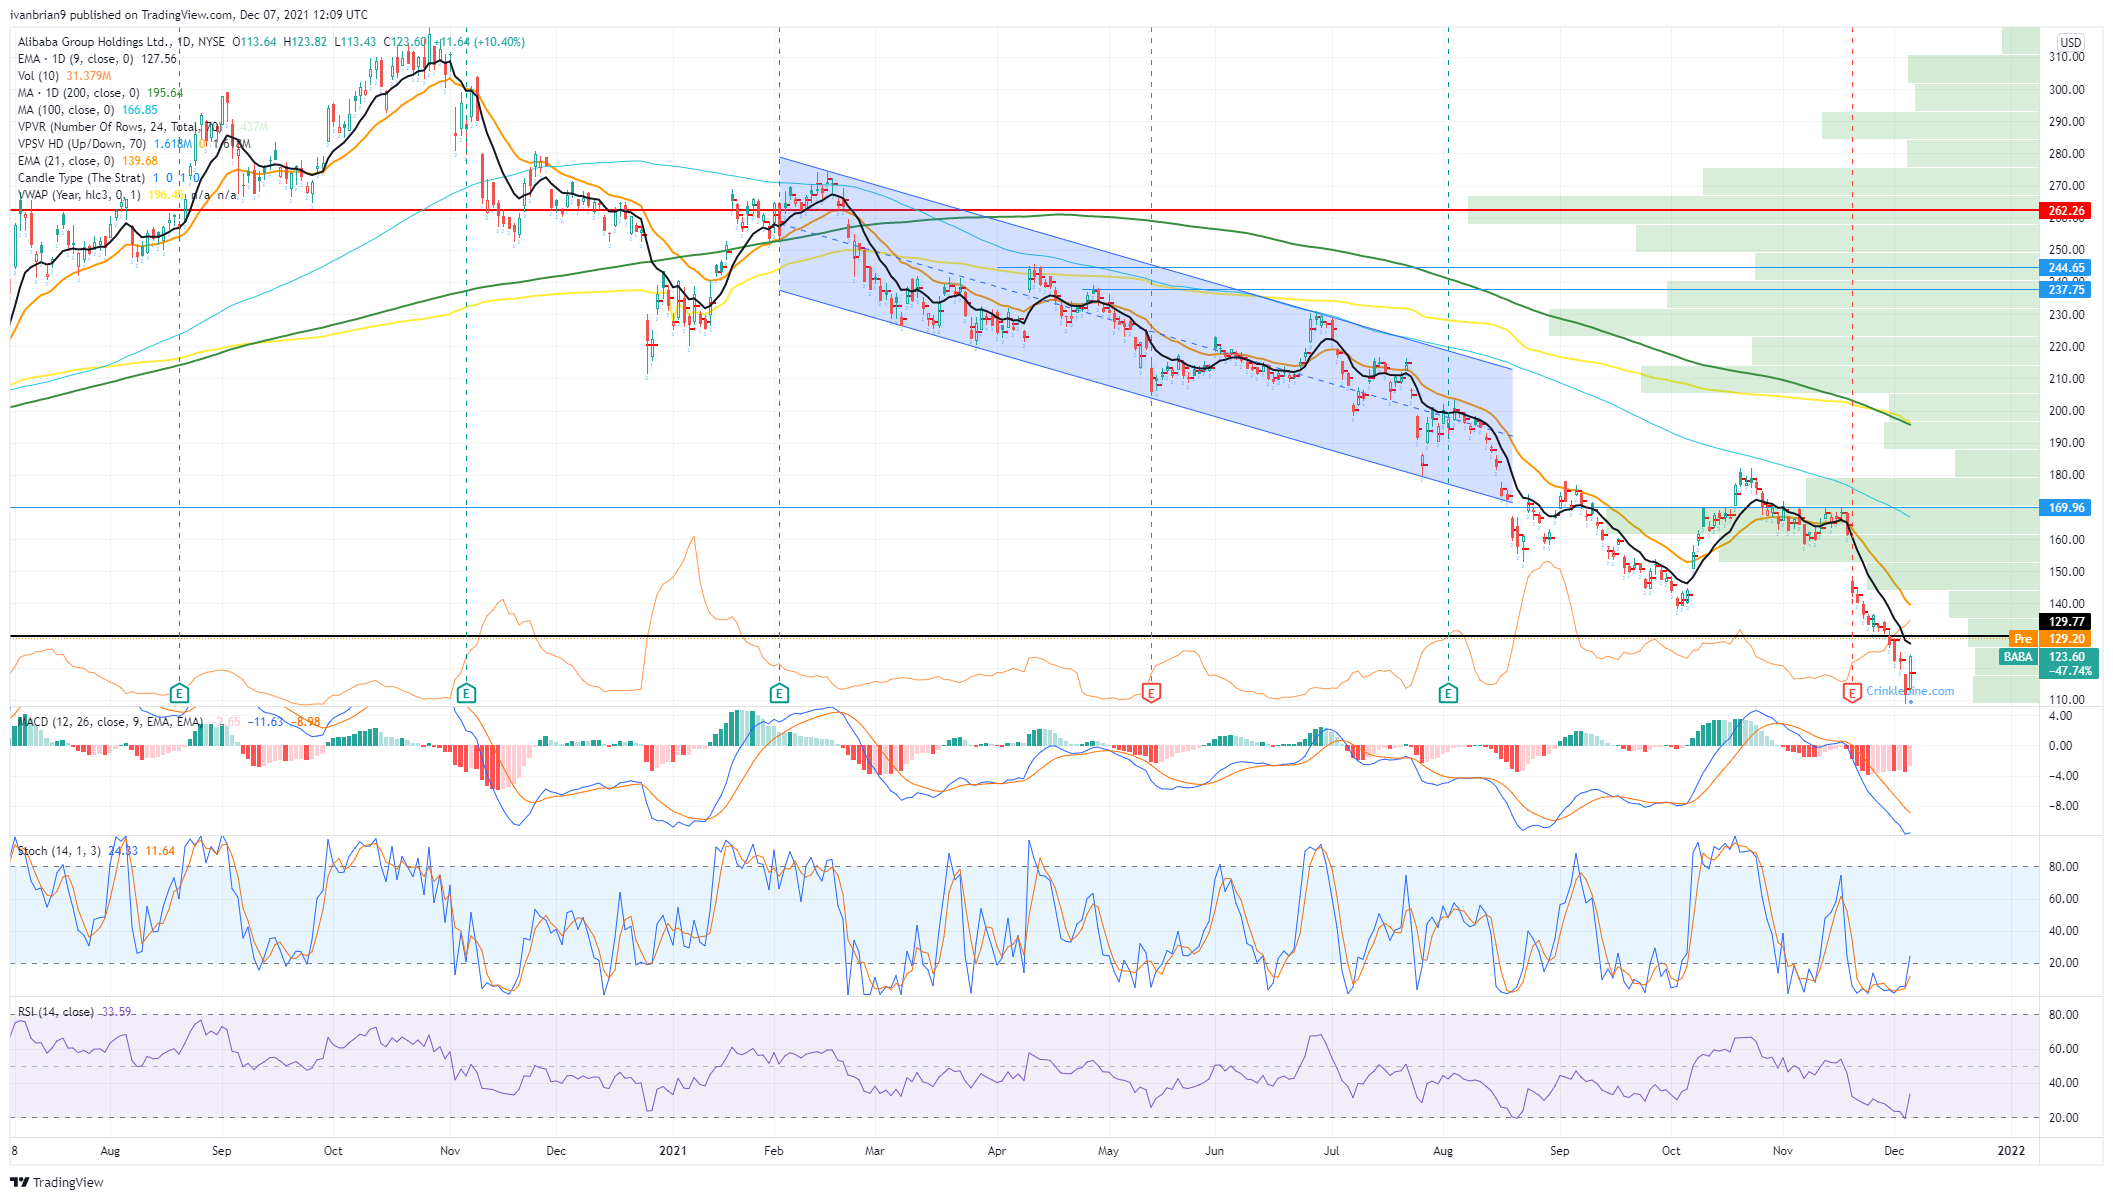
Alibaba daily chart above and the 15-minute chart below. The 15-minute shows the large support volume at $112.
Like this article? Help us with some feedback by answering this survey:
Information on these pages contains forward-looking statements that involve risks and uncertainties. Markets and instruments profiled on this page are for informational purposes only and should not in any way come across as a recommendation to buy or sell in these assets. You should do your own thorough research before making any investment decisions. FXStreet does not in any way guarantee that this information is free from mistakes, errors, or material misstatements. It also does not guarantee that this information is of a timely nature. Investing in Open Markets involves a great deal of risk, including the loss of all or a portion of your investment, as well as emotional distress. All risks, losses and costs associated with investing, including total loss of principal, are your responsibility. The views and opinions expressed in this article are those of the authors and do not necessarily reflect the official policy or position of FXStreet nor its advertisers. The author will not be held responsible for information that is found at the end of links posted on this page.
If not otherwise explicitly mentioned in the body of the article, at the time of writing, the author has no position in any stock mentioned in this article and no business relationship with any company mentioned. The author has not received compensation for writing this article, other than from FXStreet.
FXStreet and the author do not provide personalized recommendations. The author makes no representations as to the accuracy, completeness, or suitability of this information. FXStreet and the author will not be liable for any errors, omissions or any losses, injuries or damages arising from this information and its display or use. Errors and omissions excepted.
The author and FXStreet are not registered investment advisors and nothing in this article is intended to be investment advice.
Recommended content
Editors’ Picks
AUD/USD could extend the recovery to 0.6500 and above

The enhanced risk appetite and the weakening of the Greenback enabled AUD/USD to build on the promising start to the week and trade closer to the key barrier at 0.6500 the figure ahead of key inflation figures in Australia.
EUR/USD now refocuses on the 200-day SMA

EUR/USD extended its positive momentum and rose above the 1.0700 yardstick, driven by the intense PMI-led retracement in the US Dollar as well as a prevailing risk-friendly environment in the FX universe.
Gold struggles around $2,325 despite broad US Dollar’s weakness

Gold reversed its direction and rose to the $2,320 area, erasing a large portion of its daily losses in the process. The benchmark 10-year US Treasury bond yield stays in the red below 4.6% following the weak US PMI data and supports XAU/USD.
Bitcoin price makes run for previous cycle highs as Morgan Stanley pushes BTC ETF exposure

Bitcoin (BTC) price strength continues to grow, three days after the fourth halving. Optimism continues to abound in the market as Bitcoiners envision a reclamation of previous cycle highs.
US versus the Eurozone: Inflation divergence causes monetary desynchronization

Historically there is a very close correlation between changes in US Treasury yields and German Bund yields. This is relevant at the current juncture, considering that the recent hawkish twist in the tone of the Federal Reserve might continue to push US long-term interest rates higher and put upward pressure on bond yields in the Eurozone.