Chart patterns are one of the most effective trading tools for a trader. They are pure price-action, and form on the basis of underlying buying and selling pressure. Chart patterns have a proven track-record, and traders use them to identify continuation or reversal signals, to open positions and identify price targets.
Introduction-Top 10 Chart Patterns Every Trader Should Know
Chart patterns are specific price formations on a chart that predict future price movements. As technical analysis is based on the assumption that history repeats itself, popular chart patterns have shown that a specific price movement is following a particular formation of price (chart pattern) with high probability. Therefore, chart pattners are grouped into (1) continuation patterns – that signal a continuation in the underlying trend, and (2) reversal patterns – that signal reversal of the underlying trend.
In this article, we will show the top 10 chart patterns that every trader should know. The first part will reveal the reversal patterns and how they are used.
Part 1 Reversal patterns
- Head and Shoulders
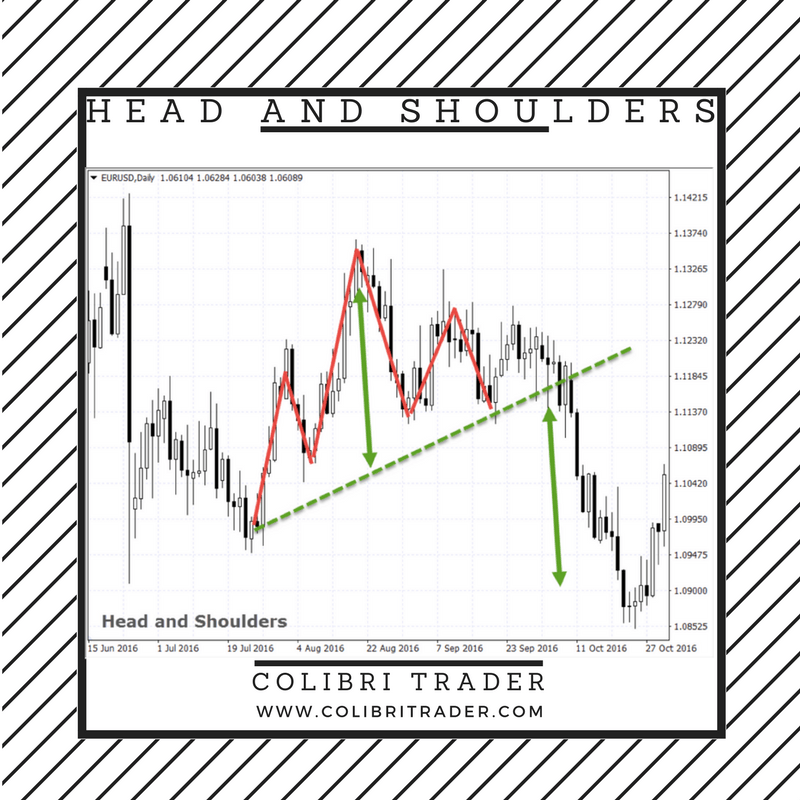
Head and Shoulders is a reversal chart pattern, that indicates the underlying trend is about to change. It consists of three swing highs, with the middle swing high being the highest (red lines on the chart). After the middle swing high, a lower high occurs which signals that buyers didn’t have enough strength to pull the price higher. The pattern looks like a head with a left and right shoulder (the three swing highs), and that’s how it got its name. The neckline is connecting the two shoulders, and a break-out below the neckline is considered a selling signal, with a price target being the distance from the top of the head to the neckline (green arrows). If the Head and Shoulders pattern occurs during a downtrend, the same inverse pattern (with three swing lows) is called an Inverse Head and Shoulders pattern.
- Double Top and Double Bottom
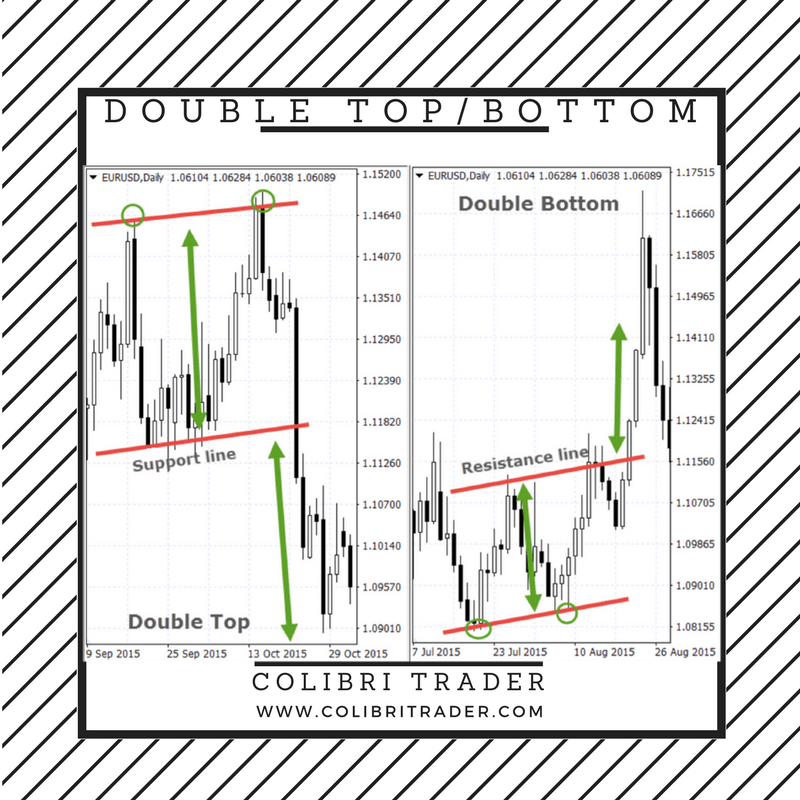
Double Top and Double Bottom are another reversal pattern, occuring during up- and downtrend, respectively. A double top, as the name suggests, has two swing highs at about the same, or slighty different price. It shows that buyers didn’t manage to push the price higher, and a trend reversal might be ahead. The trigger signal for opening a sell position is the break of the support line, with target price being the distance between the top and the support line of the formation. A double bottom pattern is the opposite, with two swing lows. Sellers didn’t have the power to move the price more downward. The trigger signal is the break of the resistance line, with the target price being the distance between the bottom and the resistance line.
- Triple Top and Triple Bottom
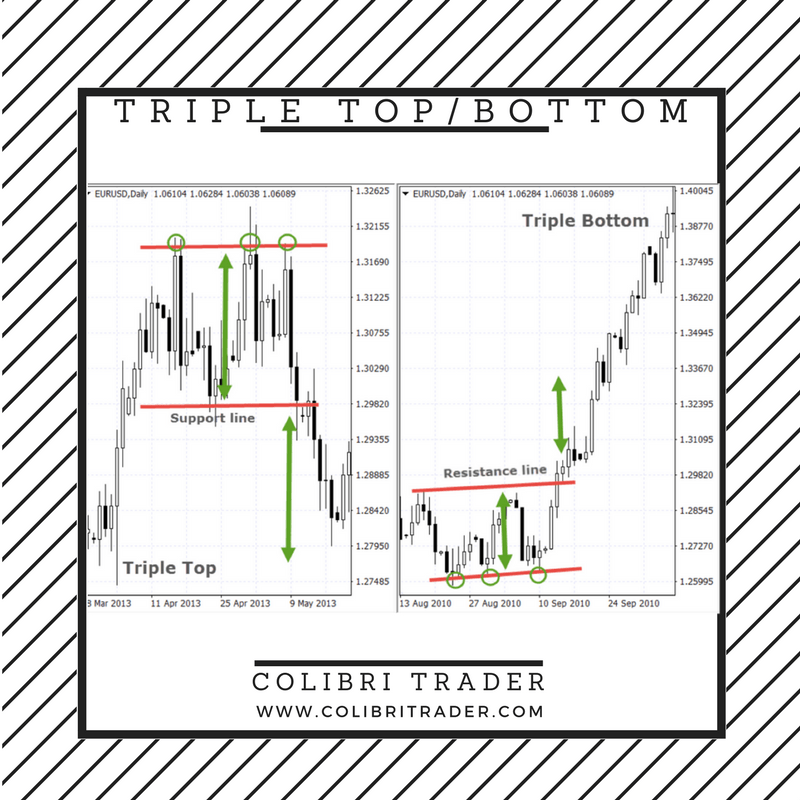
Triple Top and Tripple Bottom formations are basically the same as Double Top and Double Bottom formations. Both are reversal patterns, with the difference that Triple Tops and Bottoms have three swing highs and swing lows, respectively. Trigger signals are again the break of support and resistance lines, with target prices being the distance between the top and support line (for Triple Tops), and bottom and resistance line (for Triple Bottoms).
- Rounding Top
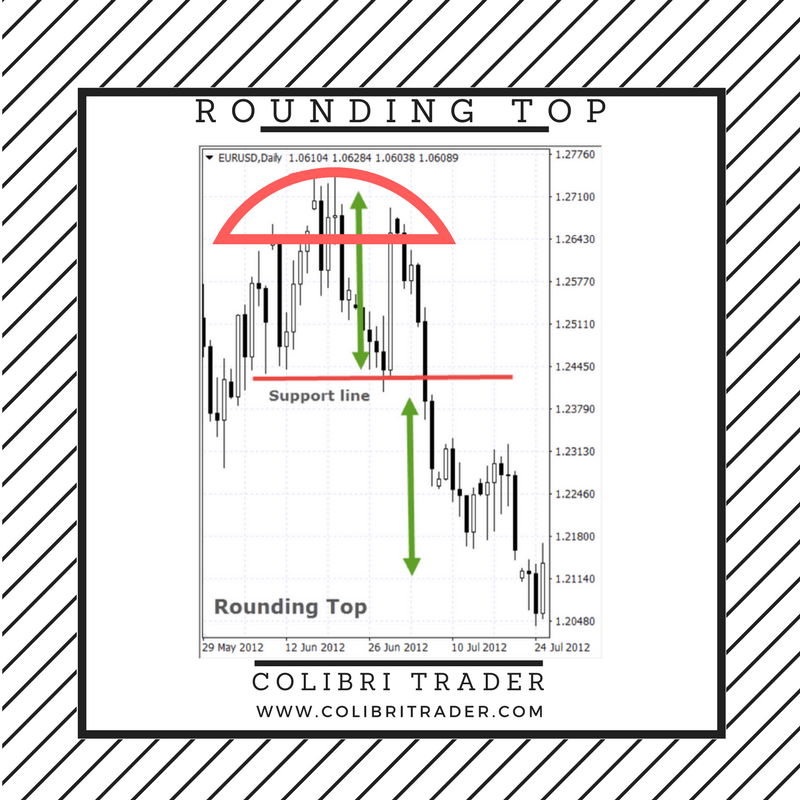
A Rounding Top pattern takes a little longer to form then the other mentioned chart patterns. It shows a gradual change of the sentiment from bullish to bearish. The price forms gradually a „rounded top“, as can be seen on the chart. The trigger for entering a short position is the break of the support line, with the price target equal the distance from the top to the support line.
- Rounding Bottom
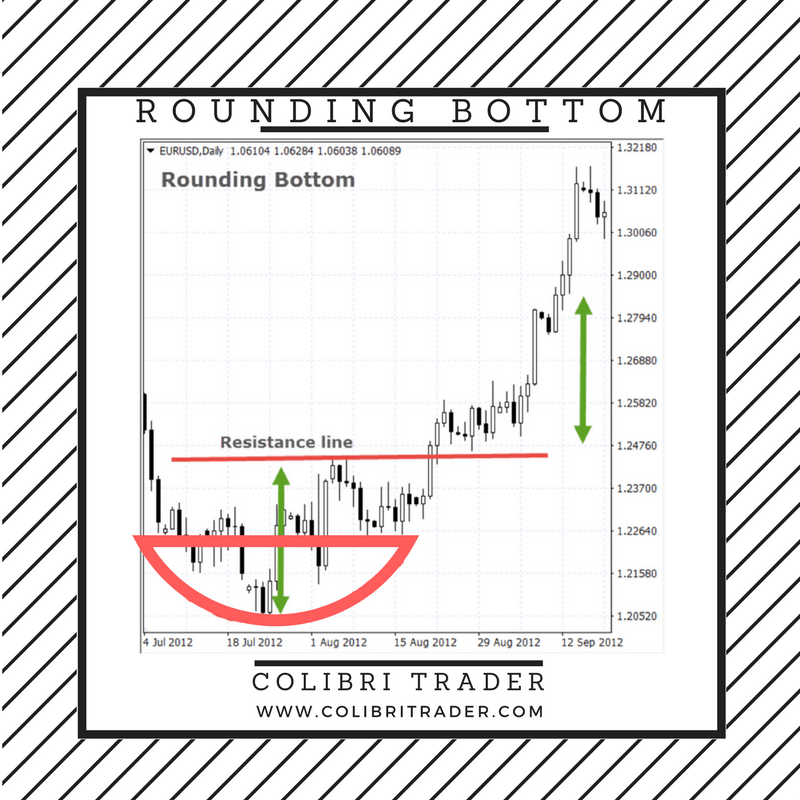
A Rounding Bottom is a Rounding Top flipped vertically. The price made a gradual change from the previous downtrend, indicated by a „rounded bottom“. The trigger signals are the same as by the Rounding Top, i.e. the break of the resistance line. Price target is the distance between the bottom and the resistance line.
Part 2 Continuation Chart Patterns
In this part, I will reveal the most popular continuation chart patterns. Continuation patterns are as important as reversal patterns. They are more suitable for a different style of trading- trend following. While reversal patterns are good for contrarian traders and swing traders, continuation patterns are considered to be great for finding a good entry point to follow the trend. The next few patterns will reveal a new angle to trading to you. I will start with the first one, which is the rectangle:
- Rectangles
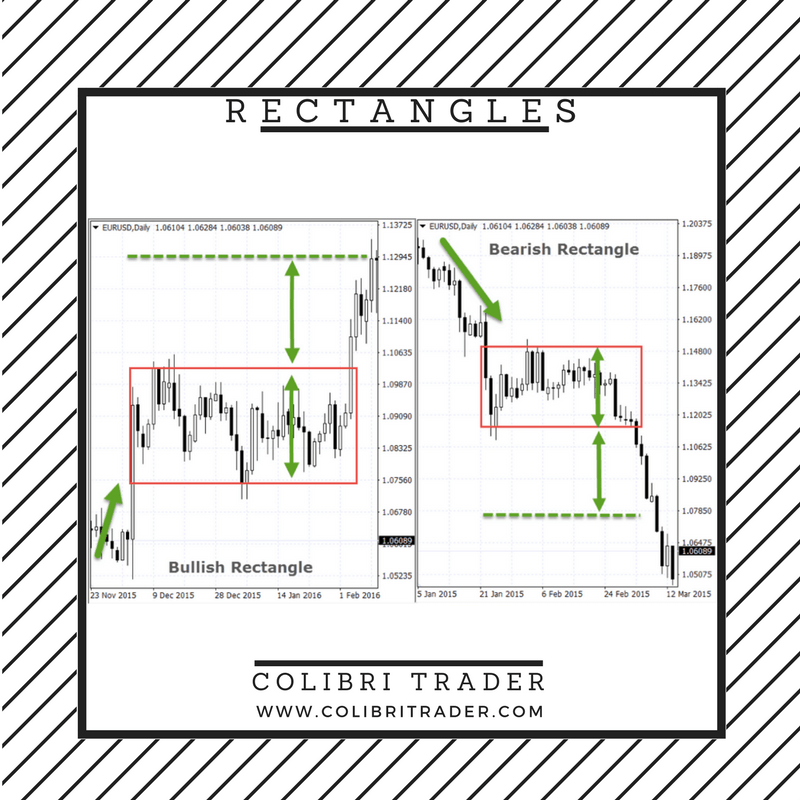
A rectangle is a continuation pattern, which means it confirms that the underlying trend should continue. It is divided into bullish and bearish rectangles, depending on the underlying trend. A bullish rectangle appears during an uptrend, when the price enters a congestion phase, during a sideways trading. The price will likely break out in the direction of the preceding trend. The trigger signal is the break of the upper line of the rectangle, with the price target being the height of the rectangle. For the bearish rectangle, the opposite rules apply. It forms during a prevailing downtrend, when the price enters a congestion phase and trades sideways. This means the trend will most likely continue downwards, with the break of the lower rectangle line. The price target is again the height of the rectangle.
- Wedges
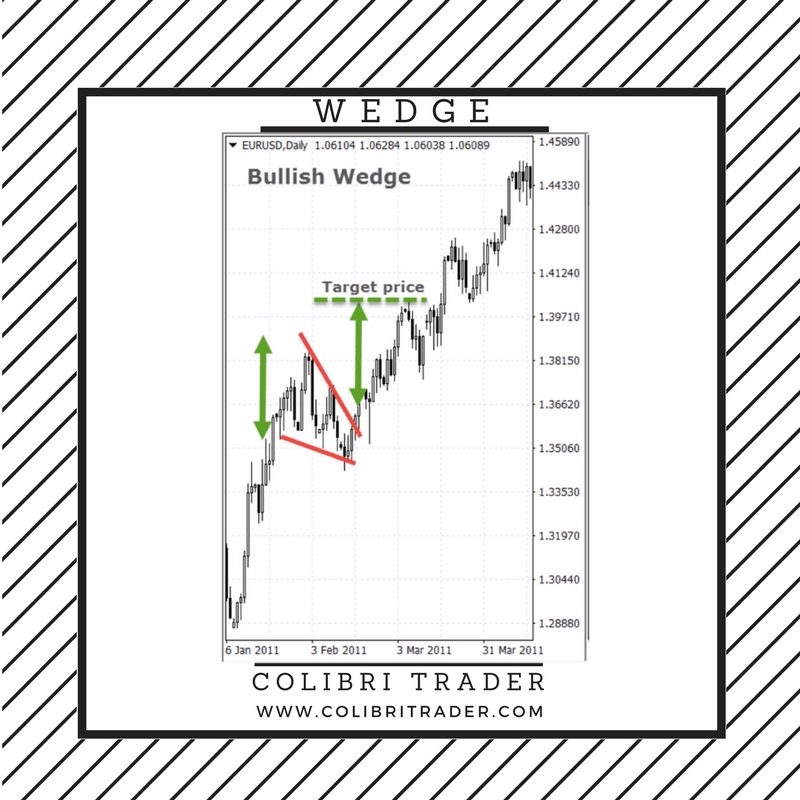
A wedge is another continuation pattern. A bullish wedge forms during an uptrend, as the price trades inside converging trendlines. These converging trendlines imply that sellers are trying to push the price lower, but don’t have enough strength to win against the buyers. Ultimately, the buyers win and the price breaks through the upper trendline, indicating that the uptrend will resume. Target prices are calculated as the maximal height of the wedge, which is then projected to the point of break-out. A bearish wedge is similar to a bullish one, with the difference that it is appearing during downtrends, and the slope of the wedge is up. Converging trendlines are again showing that buyers interrupted the downtrend, trying to push prices higher. A break-out through the lower trendline indicates that sellers won the battle, and the downtrend is resuming. The target price is, like by bullish wedges, the maximal height of the wedge which is then projected to the point of break-out.
- Flags
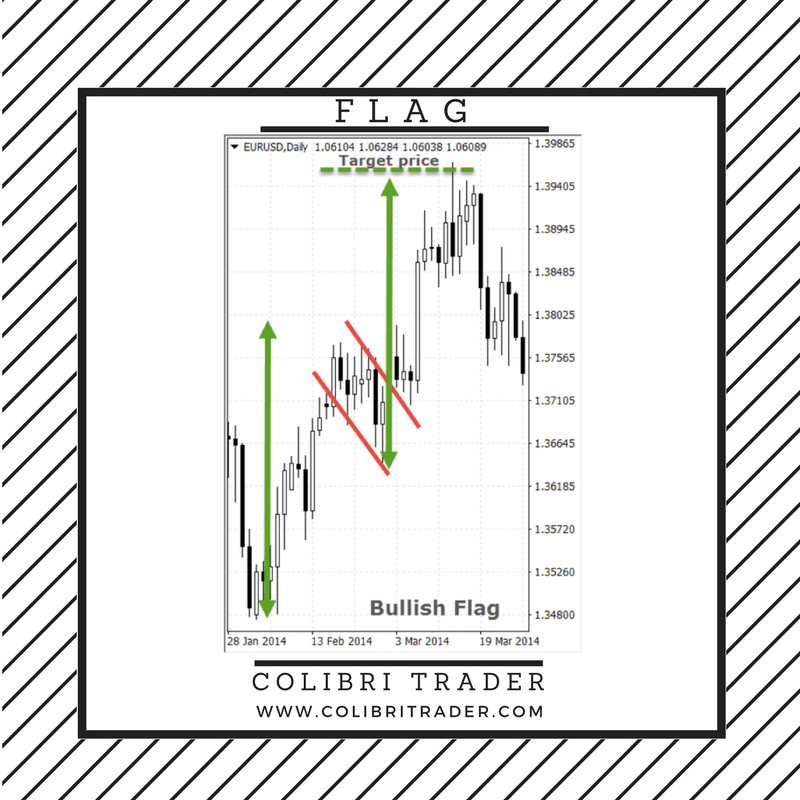
A flag is very similar to a wedge, with the difference that the trendlines which form the flag are parallel, and not converging. A flag pole is also a part of the flag pattern, because the target price is measured in a different way than by other chart patterns. Flags can be bullish and bearish, with a bullish flag shown on the chart above. A bullish flag forms during an uptrend, with parallel trendlines above and below the price-action, which form a down slope. A break-out above confirms that the uptrend is resuming. A bearish flag is pretty much the same as a bullish flag, with the difference that it forms during downtrends and has an up slope. The price target is measured as the height of the flagpole (green arrow) to the top of the flag, which is then projected to the lowest point of a bullish flag (or heighest point of a bearish flag).
- Triangles
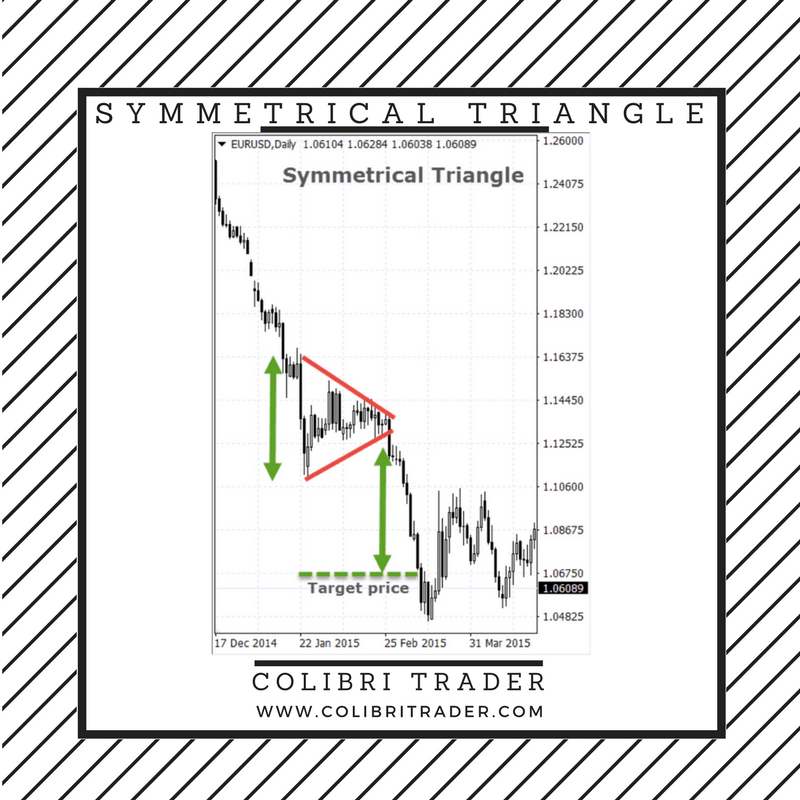
Triangles can be ascending, descending and symmetrical. All three types of triangles look pretty much the same, with the difference that ascending triangles have a flat upper trendline, and descending triangles a flat lower trendline. A symmetrical trendline is the most common, and forms during both up- and downtrends. It has converging trendlines, just like a wedge pattern, but the slope is neither pointing up or down. The breakout point of the lower trendline during downtrends confirms that the downtrend is resuming, while a breakout of the upper trendline during uptrends confirm the underlying uptrend. The target price is the height of the triangle, projected to the point of the breakout.
- Cup and Handle
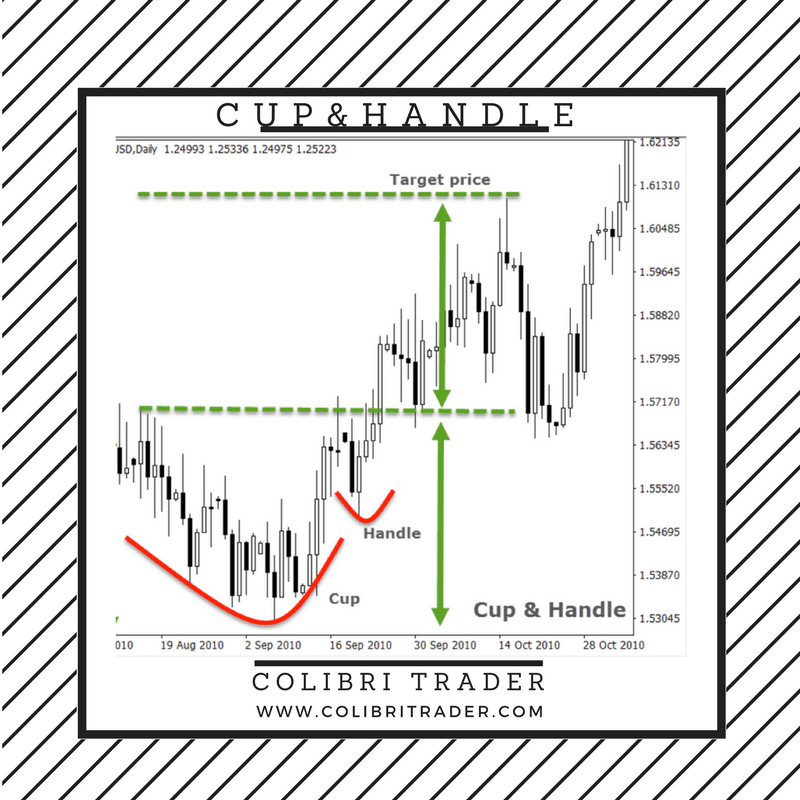
A Cup and Handle pattern is a Rounding Top pattern with an additional pullback (the handle). It is a continuation pattern which shows that in middle of an uptrend, the sellers tried to push the price lower, but the sentiment is again gradually changing from the sellers to the buyers. Additionally, a pullback occurs as the last attempt of the sellers to dominate. After a break-out of the resistance line (green dotted line), the target price is calculated as the height of the Cup & Handle pattern. An Inverse Cup & Handle pattern appears during downtrends, and the inverse rules of a regular Cup & Handle apply for it.
Conclusion-Top 10 Chart Patterns Every Trader Should Know
I have written this article with the main aim to show you another angle of trading. As can be seen, these chart patterns might help you determine trend direction, but you should not rely solely on them. I have covered the major 10 chart patterns every trader should know. I believe that these are the most important ones, but if you feel like I have omitted an important one, please share with the rest of us in the comments below. Once again- as I have outlined in my previous articles, you should take everything with a grain of salt. No indicator is good by itself or trading system is successful enough if placed in the wrong hands. You should find what works for you and stick to it.
This material is written for educational purposes only. By no means do any of its contents recommend, advocate or urge the buying, selling or holding of any financial instrument whatsoever. Trading and Investing involves high levels of risk. The author expresses personal opinions and will not assume any responsibility whatsoever for the actions of the reader. The author may or may not have positions in Financial Instruments discussed in this newsletter. Future results can be dramatically different from the opinions expressed herein. Past performance does not guarantee future results.
Editors’ Picks
EUR/USD clings to daily gains above 1.0650

EUR/USD gained traction and turned positive on the day above 1.0650. The improvement seen in risk mood following the earlier flight to safety weighs on the US Dollar ahead of the weekend and helps the pair push higher.
GBP/USD recovers toward 1.2450 after UK Retail Sales data

GBP/USD reversed its direction and advanced to the 1.2450 area after touching a fresh multi-month low below 1.2400 in the Asian session. The positive shift seen in risk mood on easing fears over a deepening Iran-Israel conflict supports the pair.
USD/JPY goes on a roller-coaster ride prompted by geopolitical risk

USD/JPY whipsaws lower and then higher on alternating risk-on risk-off caused by Middle East tensions. Governor Ueda talks about defending the Yen from further weakness and currency-induced imported inflation. USD/JPY price chart shows bearish Hanging Man forming, boding ill for future price action.
Editors’ Picks
EUR/USD clings to daily gains above 1.0650
EUR/USD gained traction and turned positive on the day above 1.0650. The improvement seen in risk mood following the earlier flight to safety weighs on the US Dollar ahead of the weekend and helps the pair push higher.
GBP/USD recovers toward 1.2450 after UK Retail Sales data
GBP/USD reversed its direction and advanced to the 1.2450 area after touching a fresh multi-month low below 1.2400 in the Asian session. The positive shift seen in risk mood on easing fears over a deepening Iran-Israel conflict supports the pair.
Gold holds steady at around $2,380 following earlier spike

Gold stabilized near $2,380 after spiking above $2,400 with the immediate reaction to reports of Israel striking Iran. Meanwhile, the pullback seen in the US Treasury bond yields helps XAU/USD hold its ground.
Bitcoin Weekly Forecast: BTC post-halving rally could be partially priced in Premium

Bitcoin price shows no signs of directional bias while it holds above $60,000. The fourth BTC halving is partially priced in, according to Deutsche Bank’s research.
Week ahead – US GDP and BoJ decision on top of next week’s agenda

US GDP, core PCE and PMIs the next tests for the Dollar. Investors await BoJ for guidance about next rate hike. EU and UK PMIs, as well as Australian CPIs also on tap.
RECOMMENDED LESSONS
Making money in forex is easy if you know how the bankers trade!
Discover how to make money in forex is easy if you know how the bankers trade!
5 Forex News Events You Need To Know
In the fast moving world of currency markets, it is extremely important for new traders to know the list of important forex news...
Top 10 Chart Patterns Every Trader Should Know
Chart patterns are one of the most effective trading tools for a trader. They are pure price-action, and form on the basis of underlying buying and...
7 Ways to Avoid Forex Scams
The forex industry is recently seeing more and more scams. Here are 7 ways to avoid losing your money in such scams: Forex scams are becoming frequent. Michael Greenberg reports on luxurious expenses, including a submarine bought from the money taken from forex traders. Here’s another report of a forex fraud. So, how can we avoid falling in such forex scams?
What Are the 10 Fatal Mistakes Traders Make
Trading is exciting. Trading is hard. Trading is extremely hard. Some say that it takes more than 10,000 hours to master. Others believe that trading is the way to quick riches. They might be both wrong. What is important to know that no matter how experienced you are, mistakes will be part of the trading process.