![]() Russ Allen
Russ Allen
Online Trading Academy
In the previous article called Using the Options P/L Graph, I began to describe one of the option trader’s most powerful tools. We’ll extend that discussion today. If you haven’t read the original article yet, please click on the link above to read it before continuing.
In that article, I showed two P/L graphs for a single trade – a call option on shares of SPY. One of the graphs was from the point of view of the call buyer. The other was from the call seller’s point of view. I made the point that whatever happens after the call option is purchased, one of the two parties (the buyer or the seller of the option) will make a profit, while the other party will have a loss of the same amount.
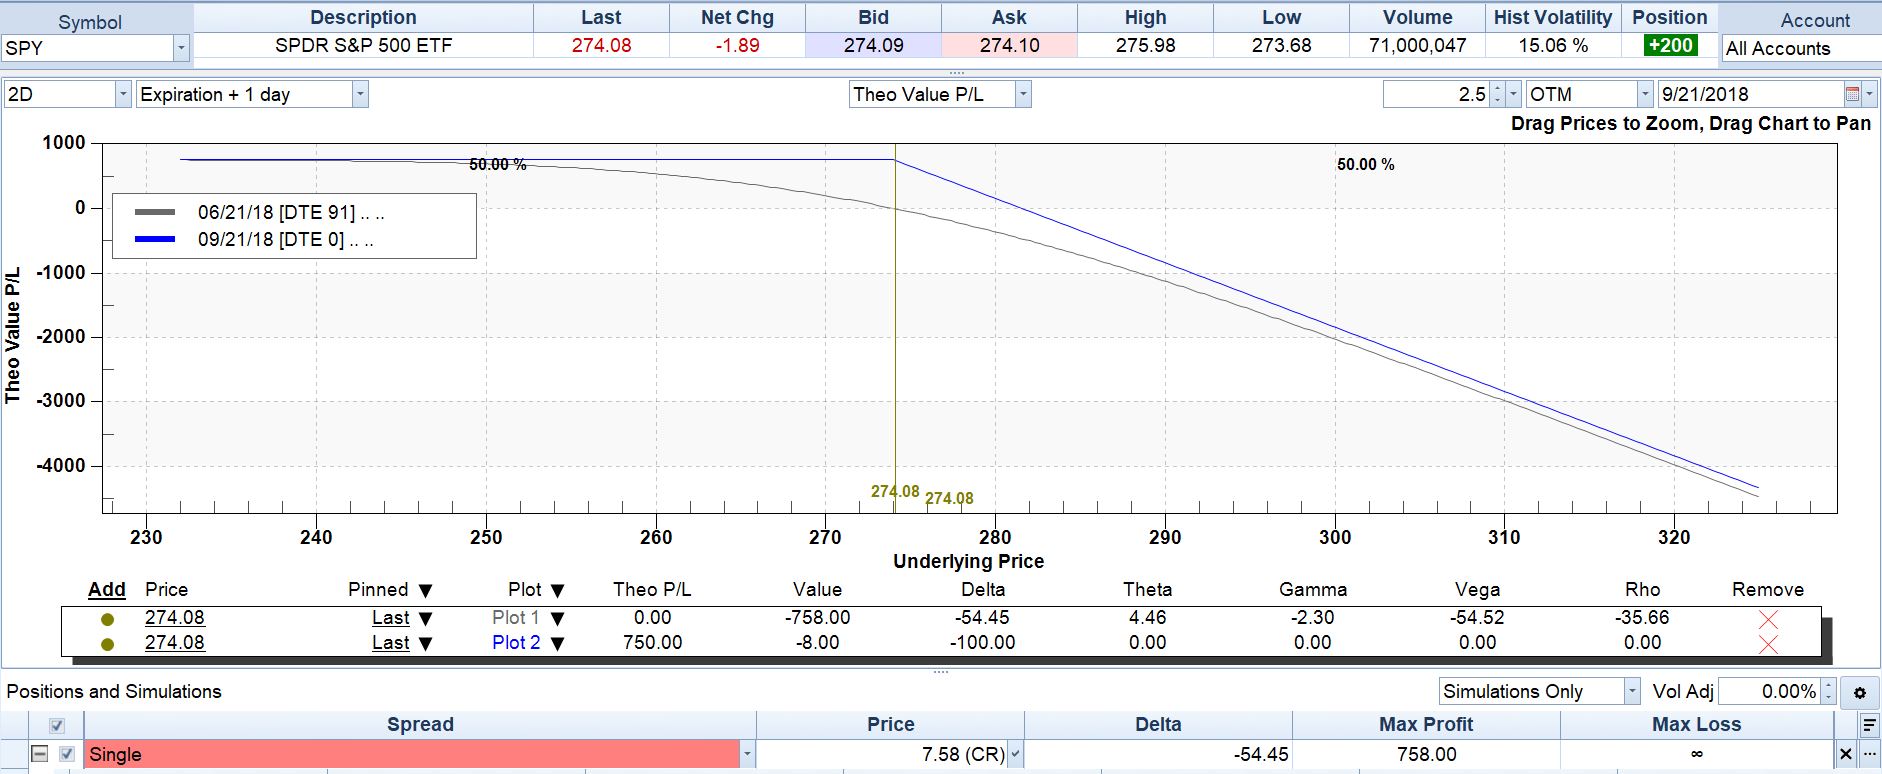
Below is another pair of P/L graphs in which both show the same trade. This pair is updated somewhat. These represent the profit or loss on a trade on a call on SPY at the 274 strike, which is where SPY was trading at the time of this writing.
The call option shown had an expiration date of September 21, 2018, which was 91 days in the future. Its price at the time was $7.58 per share ($758 per unit). This is what a call buyer would pay to a call seller to purchase this option.
After paying $758 in cash for the option, the call buyer would then have the right to buy (or call away) from the call seller 100 shares of SPY at any time up to the close of business on the expiration date on September 21. They would do this by paying an additional amount equal to the $274 strike price ($27,400 for 100 shares) to the call seller. This right was absolute and would apply no matter what the market price of SPY was at the time the option was exercised. The call buyer, of course, expected and hoped that the price of SPY would be much higher.
The call seller, in turn, in exchange for the $758 in cash he had received for the option, would take on the obligation to turn over the 100 shares of SPY to the call buyer and accept $27,400 in payment for them, when and if ordered to do so by the call buyer. Like the call buyer’s right, the call seller’s obligation was absolute and applied no matter what the market price of SPY might be when the option was exercised.
Here are the two P/L graphs:
Diagram 1 – Call Buyer’s P/L Graph
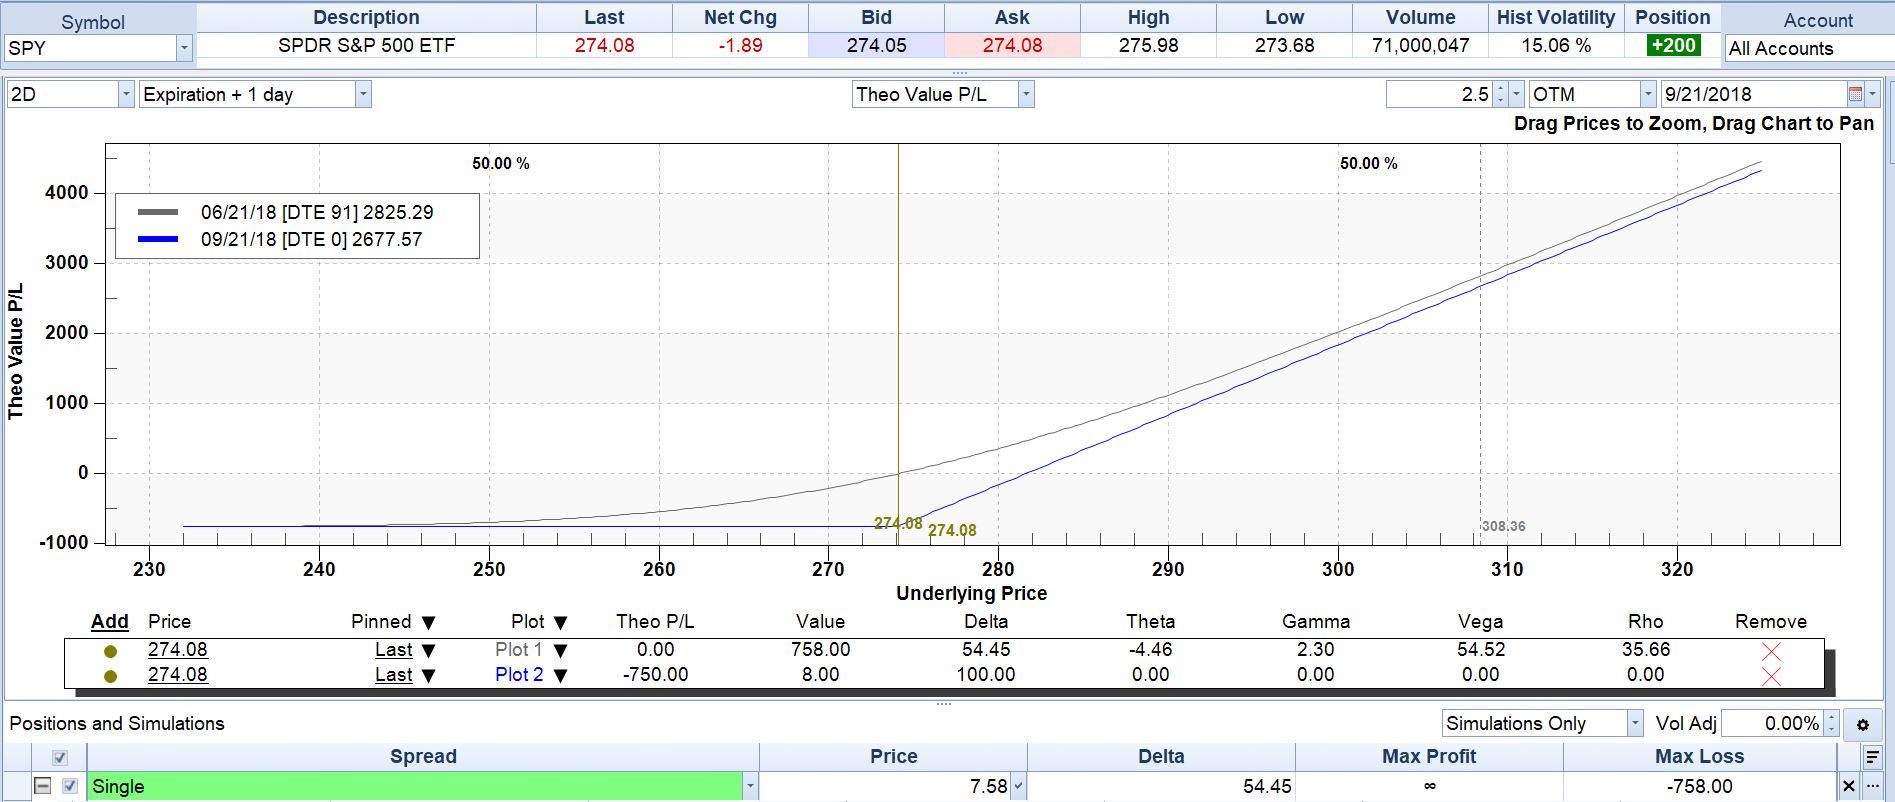
Diagram 2 – Call Seller’s P/L Graph
As described in the first article, note that the two graphs above are mirror images. If a horizontal line were drawn on either graph at the level where Theo Value P/L on the left axis is zero, and the graph were rotated top-to bottom 180 degrees, that graph would become the other party’s graph. The buyer’s graph becomes the seller’s graph, or vice versa.
There are a few things that are new on this pair of graphs compared to the first ones I showed.
-
The first graph (the call buyer’s) generally slopes upward. This means that at higher stock prices (farther to the right), the buyer’s profit is higher. The call buyer’s position is bullish – he wants to see higher stock prices.
-
The second graph (the call seller’s) slopes downward. This means that at lower stock prices (farther to the left), the call seller’s profit is higher. The call buyer’s position is bearish – he wants to see lower stock prices.
-
Note under the graphs, the section labeled Positions and Simulations. In each case, the Price is shown as $7.58. This is the per-share price at which these calls were trading at the time the graphs were made. That is the amount at which a buyer could buy one of these calls at that time. It is used as the starting point for all profit and loss calculations on the graphs.
-
That $7.58 per-share price adds up to $758 per options unit, or contract. That’s why $758 is shown as the Max Loss on the call buyer’s graph and as Max Profit for the seller. If SPY were to drop in price, so that the call buyer never exercised his option; and he held the option all the way until expiration, then he would lose the entire $758 that he had paid. In that case, the call seller would simply keep that $758 as clear profit.
-
These graphs have two lines each – a blue one and a gray one. The blue line shows what the profit or loss on the trade would be if the trade were closed out when the stock was at the price directly under any given point on that blue curve, at a specific time in the future – the expiration date.
-
The gray line shows what the profit on the trade would be if the trade were closed out when the stock was at the price directly under any given point on that gray curve, at a different specific time – that time is today.
-
The blue and gray lines are at different heights all along the curves. This indicates that the profit on the trade would be different if the trade were to be closed out today (gray line) than it would be if closed out at the future date on which the option expires (blue line). This difference is because of time value. Today, the option has time value. At expiration day, when there is no time left in the option’s life, it will have no time value, so its total value will be less. In fact, if at that time the price of SPY is under $274.00, (the strike price) the call will have no value at all.
-
For the option owner (top graph), the today’s P/L gray line is higher at every point than the At Expiration blue line. This indicates that if the trade were closed out today, no matter the stock price, the profit would be higher than if it were closed out at expiration with the stock at that same price. This means that time is working against the option owner. He wants the stock to move to his target quickly, so that he can close out the trade as soon as possible, while some time value remains. He is in a race against time and is losing value by the minute.
-
Conversely, for the option seller (bottom graph), the today’s P/L gray line is lower at every point than the At Expiration blue line. This indicates that if the trade were closed out today, no matter the stock price, the call seller’s profit would be lower than if it were closed out at expiration with the stock at that same price. For the option seller, time is on his side. He is gaining profit for every minute that goes by.
That’s all that we have space for today. I hope this has helped you to begin to understand the option P/L graphs. As I mentioned at the outset, they are one of the most important items in the option trader’s toolbox.
This content is intended to provide educational information only. This information should not be construed as individual or customized legal, tax, financial or investment services. As each individual's situation is unique, a qualified professional should be consulted before making legal, tax, financial and investment decisions. The educational information provided in this article does not comprise any course or a part of any course that may be used as an educational credit for any certification purpose and will not prepare any User to be accredited for any licenses in any industry and will not prepare any User to get a job. Reproduced by permission from OTAcademy.com click here for Terms of Use: https://www.otacademy.com/about/terms
Editors’ Picks
EUR/USD hovers around 1.0700, eyes on US first-quarter GDP data

EUR/USD hovers around the 1.0700 psychological level on Thursday during the early Asian session. The modest uptick of the major pair is supported by the softer US Dollar. Later in the day, Germany’s GfK Consumer Confidence Survey for April will be released.
GBP/USD snaps the two-day winning streak above 1.2450, eyes on US GDP data

The GBP/USD pair snaps the two-day winning streak near 1.2460 amid the modest rebound of the US Dollar on Thursday during the early Asian session. The release of the US Gross Domestic Product for the first quarter will take center stage on the day.
USD/JPY finds its highest bids since 1990, approaches 156.00

USD/JPY broke into its highest chart territory since June of 1990 on Wednesday, peaking near 155.40 for the first time in 34 years as the Japanese Yen continues to tumble across the broad FX market.
Editors’ Picks
AUD/USD posts gain, yet dive below 0.6500 amid Aussie CPI, ahead of US GDP

The Aussie Dollar finished Wednesday’s session with decent gains of 0.15% against the US Dollar, yet it retreated from weekly highs of 0.6529, which it hit after a hotter-than-expected inflation report. As the Asian session begins, the AUD/USD trades around 0.6495.
USD/JPY finds its highest bids since 1990, approaches 156.00
USD/JPY broke into its highest chart territory since June of 1990 on Wednesday, peaking near 155.40 for the first time in 34 years as the Japanese Yen continues to tumble across the broad FX market.
Gold stays firm amid higher US yields as traders await US GDP data

Gold recovers from recent losses, buoyed by market interest despite a stronger US Dollar and higher US Treasury yields. De-escalation of Middle East tensions contributed to increased market stability, denting the appetite for Gold buying.
Ethereum suffers slight pullback, Hong Kong spot ETH ETFs to begin trading on April 30

Ethereum suffered a brief decline on Wednesday afternoon despite increased accumulation from whales. This follows Ethereum restaking protocol Renzo restaked ETH crashing from its 1:1 peg with ETH and increased activities surrounding spot Ethereum ETFs.
Dow Jones Industrial Average hesitates on Wednesday as markets wait for key US data

The DJIA stumbled on Wednesday, falling from recent highs near 38,550.00 as investors ease off of Tuesday’s risk appetite. The index recovered as US data continues to vex financial markets that remain overwhelmingly focused on rate cuts from the US Fed.
RECOMMENDED LESSONS
Making money in forex is easy if you know how the bankers trade!
Discover how to make money in forex is easy if you know how the bankers trade!
5 Forex News Events You Need To Know
In the fast moving world of currency markets, it is extremely important for new traders to know the list of important forex news...
Top 10 Chart Patterns Every Trader Should Know
Chart patterns are one of the most effective trading tools for a trader. They are pure price-action, and form on the basis of underlying buying and...
7 Ways to Avoid Forex Scams
The forex industry is recently seeing more and more scams. Here are 7 ways to avoid losing your money in such scams: Forex scams are becoming frequent. Michael Greenberg reports on luxurious expenses, including a submarine bought from the money taken from forex traders. Here’s another report of a forex fraud. So, how can we avoid falling in such forex scams?
What Are the 10 Fatal Mistakes Traders Make
Trading is exciting. Trading is hard. Trading is extremely hard. Some say that it takes more than 10,000 hours to master. Others believe that trading is the way to quick riches. They might be both wrong. What is important to know that no matter how experienced you are, mistakes will be part of the trading process.