![]() Sarah Tran
Sarah Tran
Independent Analyst
- XRP price is lagging behind other cryptocurrencies as Bitcoin has long since begun its rally recording higher highs.
- The bulls’ inability to push prices higher resulted in XRP price crashing 10% on October 18.
- However, a crucial indicator suggests that Ripple may have recorded a local bottom.
XRP price has crashed 14% from its swing high at $1.18 recorded on October 16, tagging the downside trend line of the prevailing chart pattern. While Ripple (XRP) was at the edge of dropping below $1, a key technical indicator hints that the swing low may have set the local bottom for the time being.
XRP price prints local bottom
XRP price has been locked within a descending parallel channel on the 4-hour chart, as Ripple continues to record lower highs and lower lows. Although the token is sealed in a consolidation pattern, the Momentum Reversal Indicator (MRI) has flashed a bottom signal, suggesting that it is ready for a move higher.
The technical pattern suggests that Ripple could oscillate between the upper and lower boundaries of the channel before revealing bigger directional intentions. Following the drop toward the downside trend line of the chart pattern, XRP price would likely tag the topside trend line at $1.17 next.
The first obstacle for XRP price is at the middle boundary of the prevailing chart pattern at $1.09, coinciding with the 100 four-hour Simple Moving Average (SMA). Another hurdle will emerge at the 50% Fibonacci retracement level at $1.13, which sits near the 20 and 50 four-hour SMAs.
The last roadblock may materialize at the resistance line given by the MRI at $1.14 before XRP price is able to tag its short-term bullish target at $1.17. Should a spike in buy orders materialize, Ripple may slice above the parallel channel, tagging the 61.8% Fibonacci retracement level at $1.19. If the bulls manage to flip this level into support, the token may aim to target $1.28, where the breakout line, 78.6 Fibonacci retracement level and the declining resistance trend line meet.
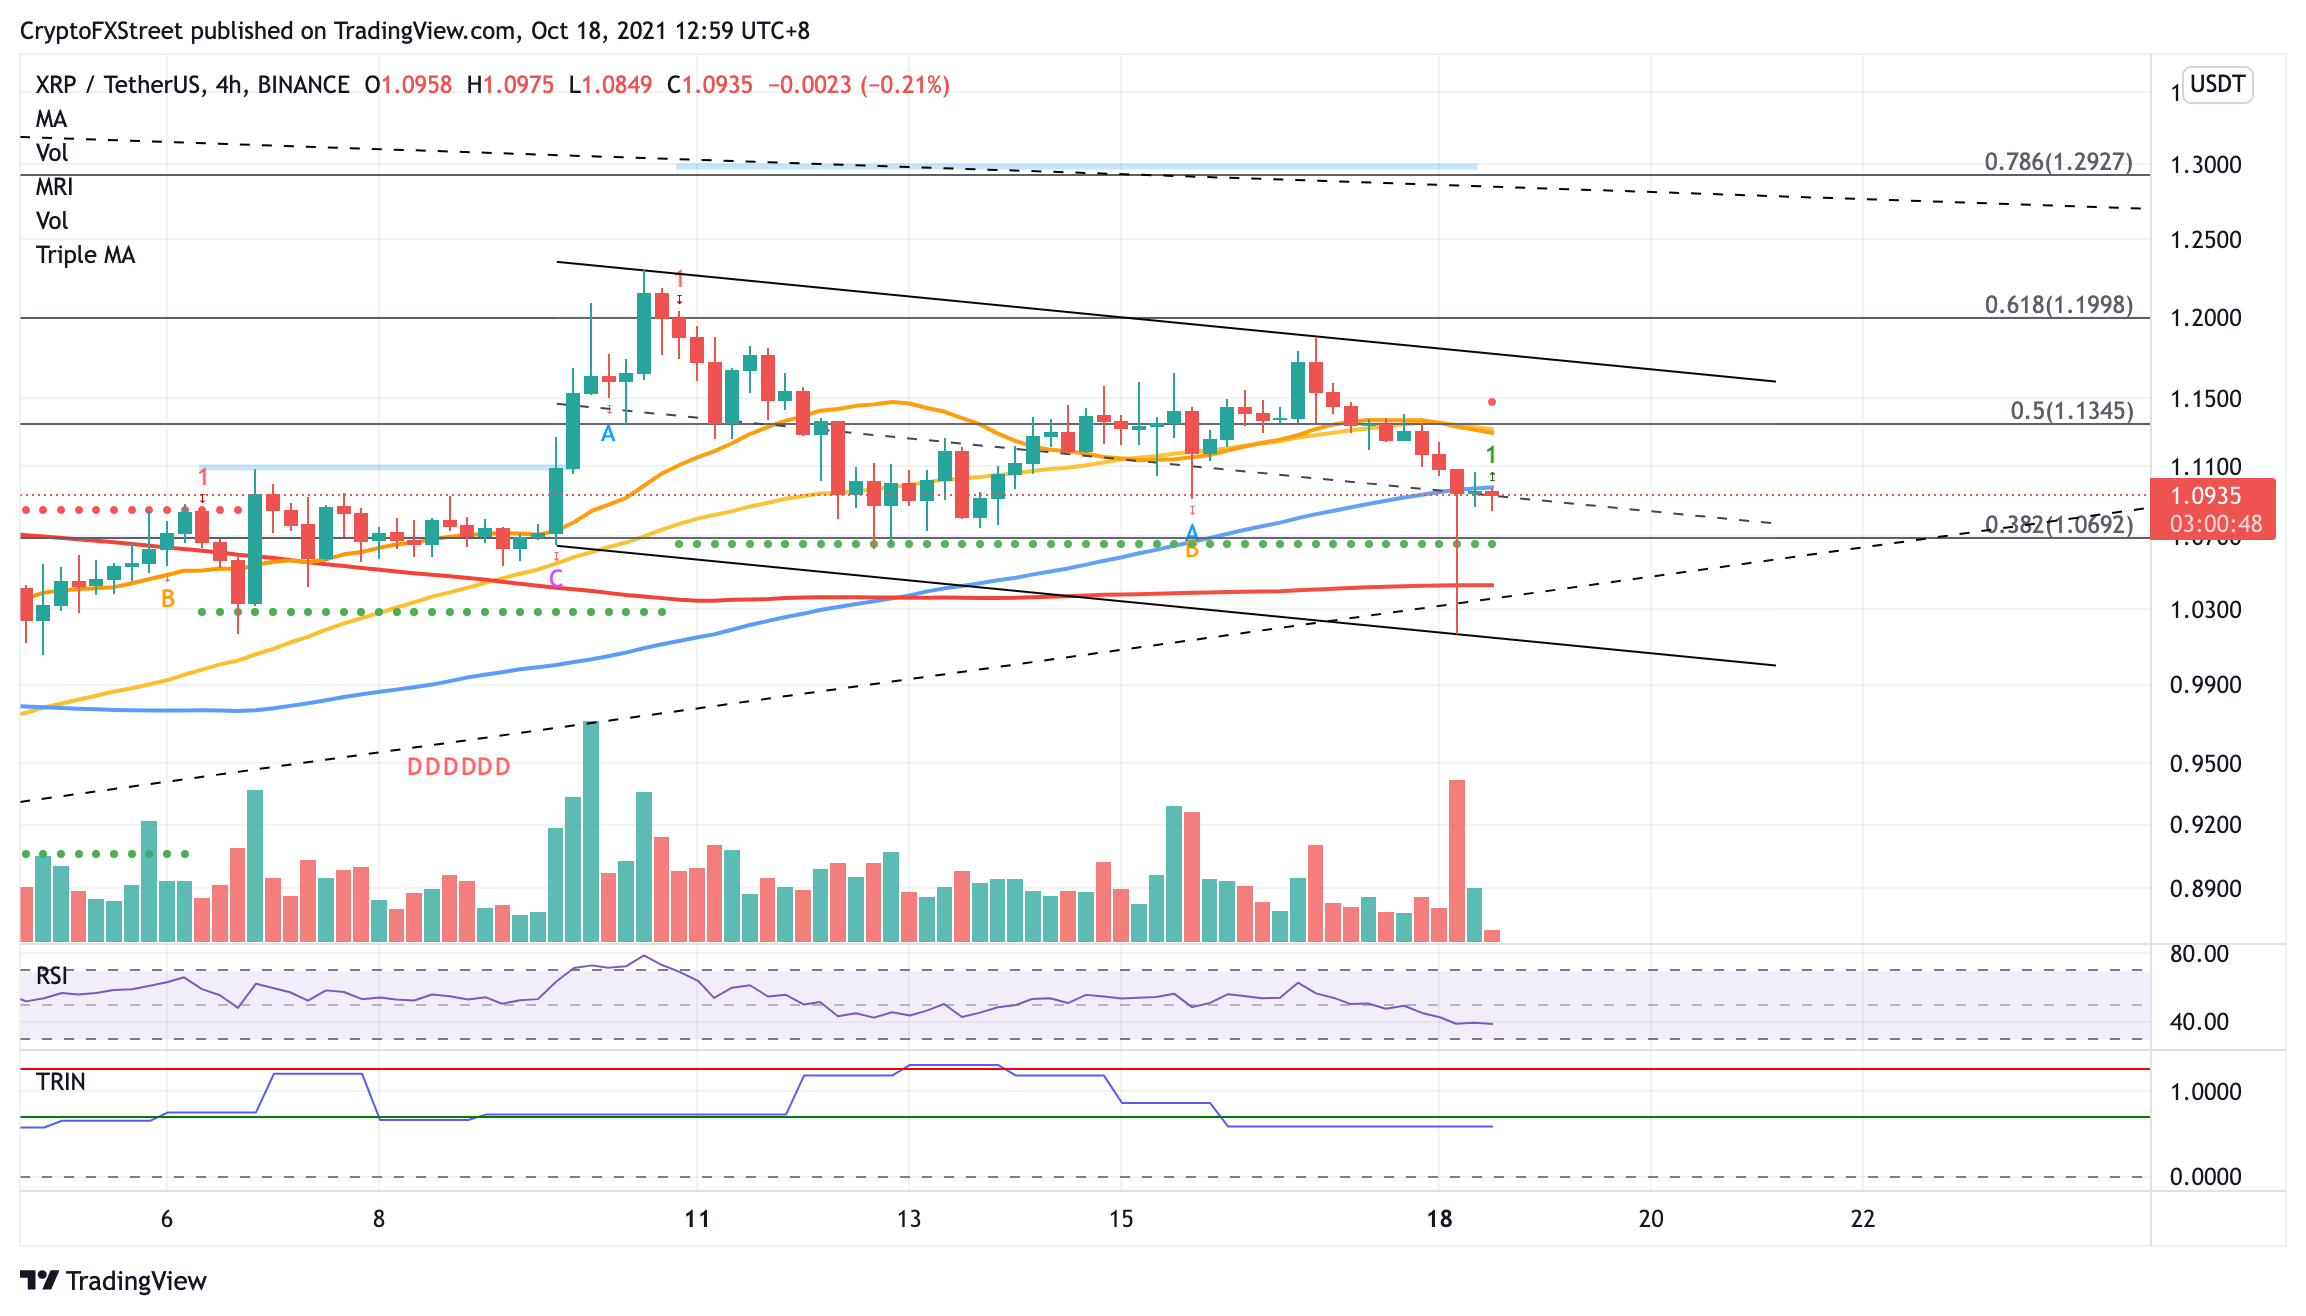
XRP/USDT 4-hour chart
However, should selling pressure increase, XRP price may retest key support levels before revealing targets on the upside. The first line of defense for Ripple is at the 38.2% Fibonacci retracement level at $1.06, coinciding with the support line given by the MRI.
Additional lines of defense may emerge at the 200 four-hour SMA at $1.04, then at the ascending support trend line that formed since July 20 at $1.03. Slicing below this multi-month foothold could spell trouble for the bulls, but the last leg of support will appear at the downside trend line of the parallel channel at $1.01.
Until Ripple bulls can break above the governing technical pattern, the token may continue to trend lower until XRP price reveals decisive directional intentions.
Note: All information on this page is subject to change. The use of this website constitutes acceptance of our user agreement. Please read our privacy policy and legal disclaimer. Opinions expressed at FXstreet.com are those of the individual authors and do not necessarily represent the opinion of FXstreet.com or its management. Risk Disclosure: Trading foreign exchange on margin carries a high level of risk, and may not be suitable for all investors. The high degree of leverage can work against you as well as for you. Before deciding to invest in foreign exchange you should carefully consider your investment objectives, level of experience, and risk appetite. The possibility exists that you could sustain a loss of some or all of your initial investment and therefore you should not invest money that you cannot afford to lose. You should be aware of all the risks associated with foreign exchange trading, and seek advice from an independent financial advisor if you have any doubts.
Recommended Content
Editors’ Picks
PENDLE price soars 10% after Arthur Hayes’ optimism on Pendle derivative exchange

Pendle (PENDLE) price is among the top performers in the cryptocurrency market today, posting double-digit gains. Its peers in the altcoin space are not as forthcoming even as the market enjoys bullish sentiment inspired by Bitcoin (BTC) price.
Ethereum shows signs of a potential rally as suspected Justin Sun wallet buys heavily

Ethereum's (ETH) recent price movement hints at a potential rally despite ETH ETPs recording outflows. The recent price improvement follows the fourth Bitcoin halving and a suspected Justin Sun wallet purchasing large numbers of ETH.
Floki poised for growth after listing on Revolut
Floki's (FLOKI) team announced in an X post on Monday that the meme coin would be listed on the popular neobank and Fintech platform Revolut. Floki could rise further following key partnerships to boost retail usage.
Jupiter DEX second Launchpad vote concludes, JUP price rises 5%

Jupiter, a Solana-based decentralized exchange (DEX) has completed the second launchpad (LFG) vote to identify the two projects that will debut on its platform. On March 30, the aggregator network had unveiled its Core Working Group (CWG) budget proposal voting.
Bitcoin: BTC post-halving rally could be partially priced in Premium

Bitcoin (BTC) price briefly slipped below the $60,000 level for the last three days, attracting buyers in this area as the fourth BTC halving is due in a few hours. Is the halving priced in for Bitcoin? Or will the pioneer crypto note more gains in the coming days?