- Bitcoin and Ripple look far from turning upwards in the short term.
- Ethereum can give the surprise of the year and take the bullish leadership.
- A sudden increase in volatility may signal a change of scenario.
Today several reports are published announcing a near change of course in the crypto board in general and the Bitcoin in particular.
The arguments in favor of a bullish turn are, among others:
- The analysis of the positioning of traders in the leading exchanges indicates that long positions are predominant.
- Some leading analysts highlight that the price seems to reject the support level at $8,000.
- The price curve in the logarithmic chart, a specific technique of Bitcoin analysis, indicates that the BTC/USD pair has reached its lower limit and is not falling on the bearish side.
- Applying the Ichimoku Kumo Cloud technique to the BTC/USD pair, a bullish sign on the weekly chart stands out. The Bitcoin has never failed on this signal, with 100% success.
I consider some of the points listed to be very important, but I think that, at this moment, we should act with caution. Nobody wants to buy a thousand dollars above the relative minimum, suffer more and earn less.
Momentum and market forces indicators indicate that the bearish scenarios are still far from complete.
The scenario that I consider most likely is precisely this. In the next few hours, an indeterminate factor can accelerate price movement, reach downward targets and bounce upward, dragging moving averages and indicators.
ETH/BTC Daily Chart
ETH/BTC is currently trading at the price level of 0.0216 and continues to be weak against the 0.022 resistance level. Developments in the next few days promise strong emotions.
The fast moving averages are pointing higher, while the 200 period one continues to focus on the bearish side. The end of this month should bring the meeting between both movements.
Also by the end of the month, the medium-term bearish trend line will be reached, as well as essential resistances at 0.022 and 0.023.
Above the current price, the first resistance level is at 0.022, then the second at 0.023 and the third one at 0.0233.
Below the current price, the first support level is at 0.021, then the second at 0.020 and the third one at 0.019.
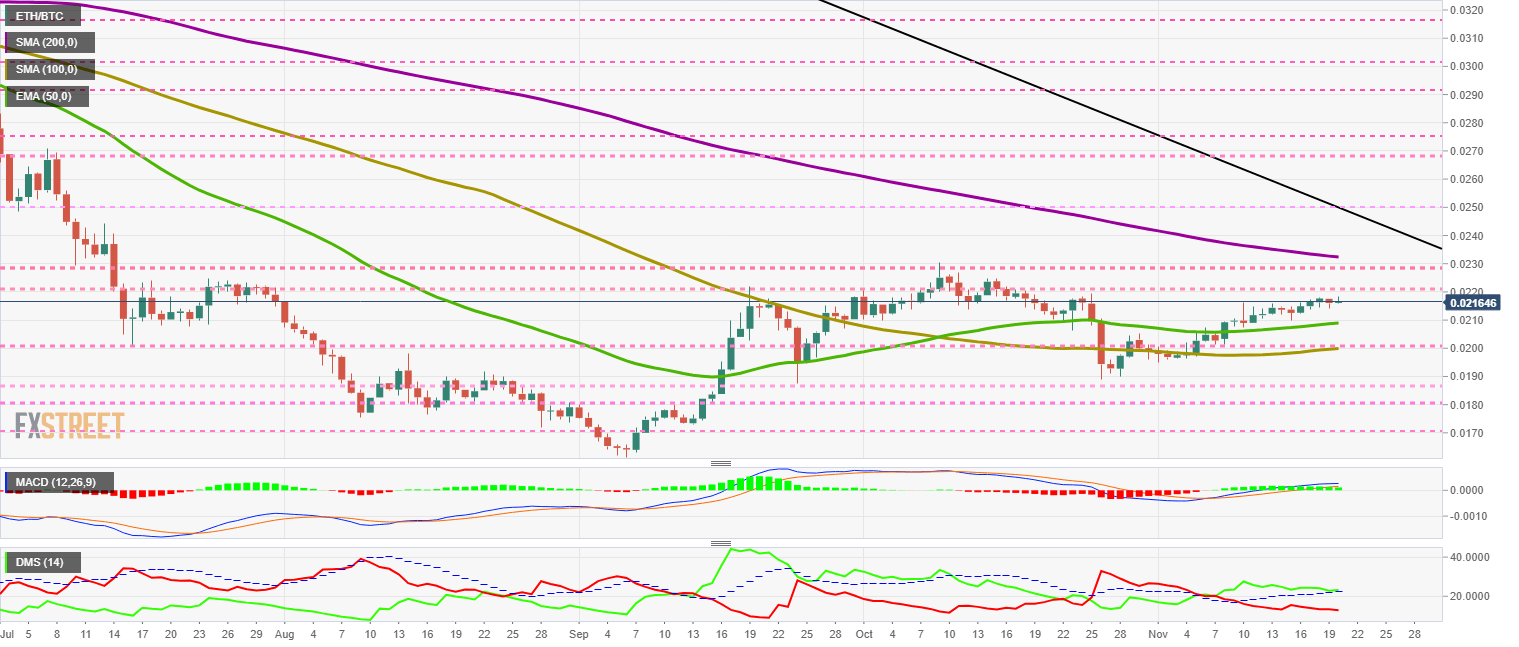
The MACD on the daily chart shows a loss of bullish momentum as the pair is struggling to break above the 0.022 level.
The DMI on the daily chart shows the bulls bouncing upward after touching the ADX line. The continuation pattern is open and accepts from a new bullish cross as a failure that would cause the price to fall rapidly.
BTC/USD Daily Chart
BTC/USD is currently trading at the $8,052 price level and is holding steady by balancing above the $8,000 support level.
Above the current price, the first resistance level is at $8,150, then the second at $8,400 and the third one at $8,800.
Below the current price, the first support level is at $8,000, then the second at $7,850 and the third one at $7,700.
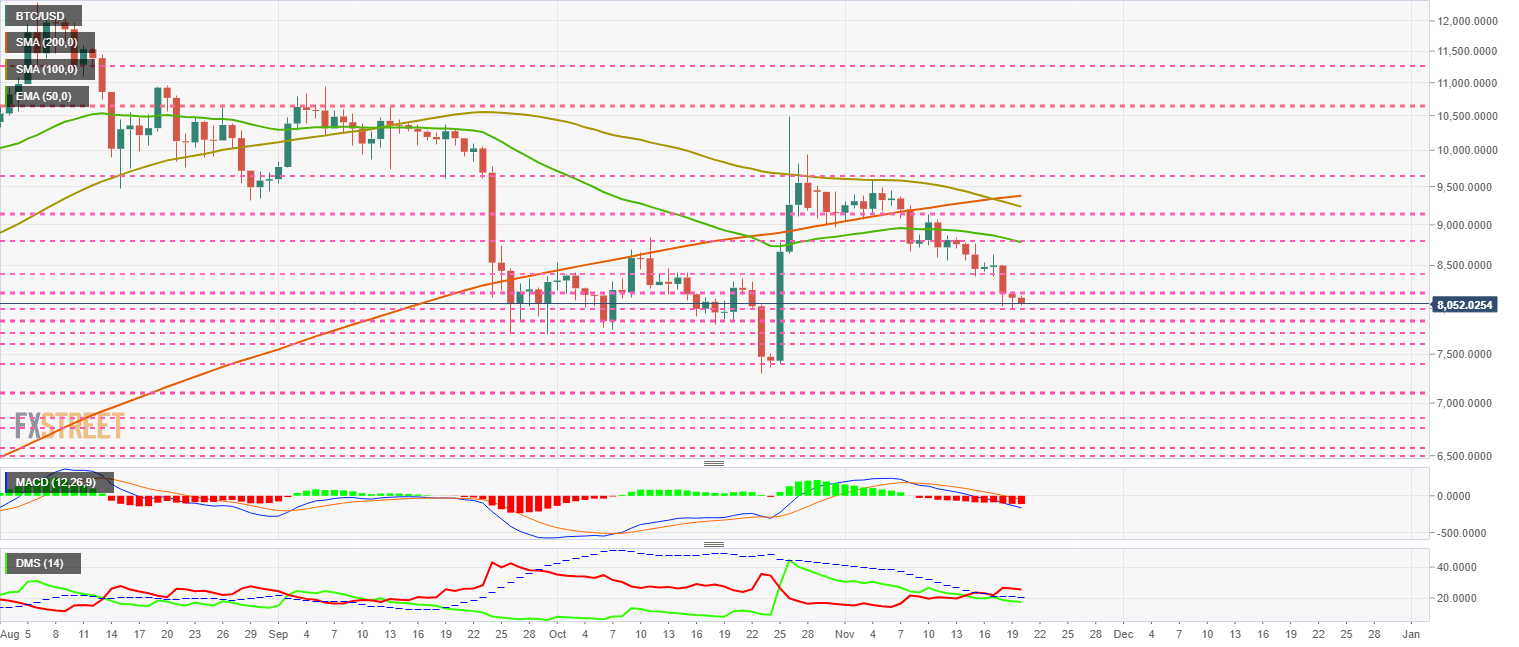
The MACD on the daily chart shows very separate moving averages, which reinforces the idea that the bearish trend is active.
The DMI on the daily chart shows bears gaining height while bulls are lost below the ADX line and start a medium-term bearish pattern.
ETH/USD Daily Chart
ETH/USD is currently traded at the $174.8 price level and appears to find some balance at this mid-point in the $200 to $150 range. A visit to the $170 support level below seems clear.
Above the current price, the first resistance level is at $180, then the second at $190 and the third one at $195.
Below the current price, the first support level is at $170, then the second at $160 and the third one at $155.
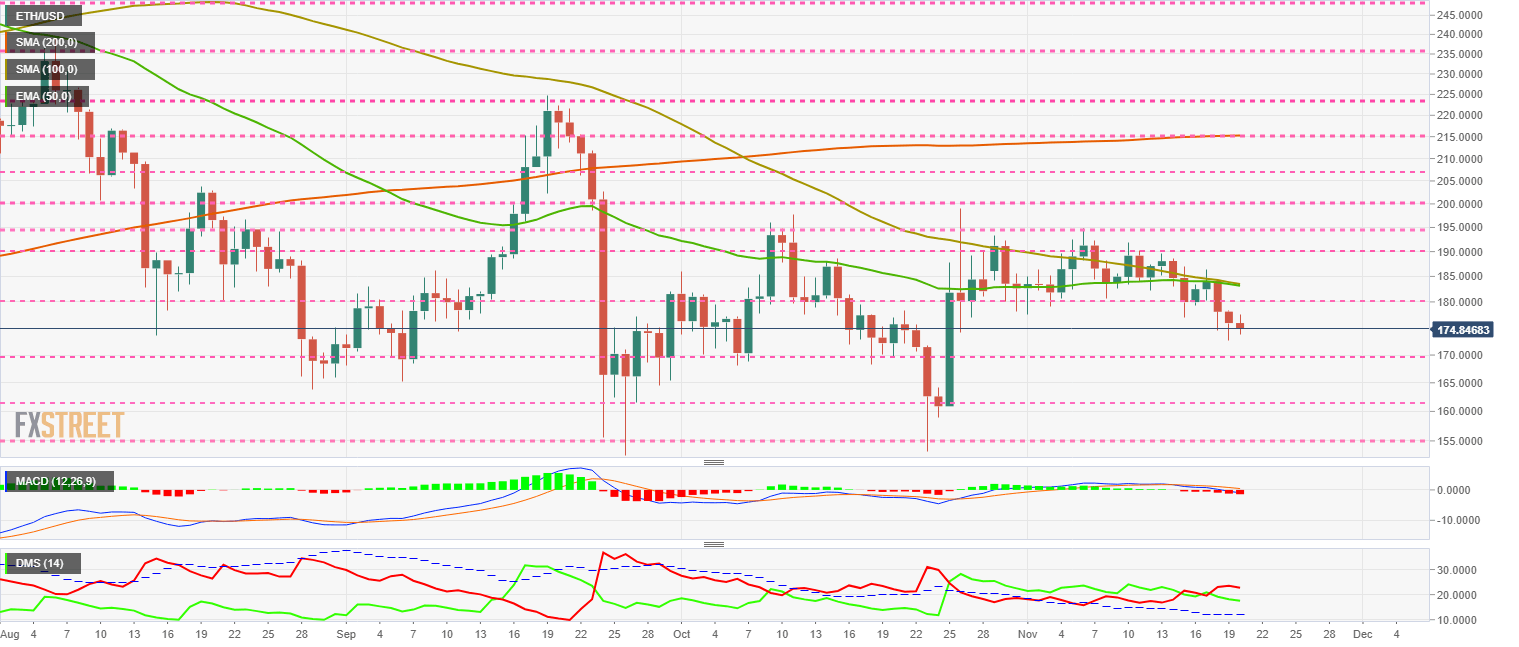
The MACD on the daily chart remains in the positive territory. The moving averages profile is very neutral.
The DMI on the daily chart shows the bears losing some of the points gained yesterday. The bulls show no interest in regaining leadership.
XRP/USD Daily Chart
XRP/USD is currently trading at the $0.2499 price level and is once again losing the $0.25 support it gained during the Asian session.
The weakness that shows the XRP is worrying, especially when the news regarding its implementation and business figures of Ripple Lts. are very positive.
Above the current price, the first resistance level is at $0.25, then the second at $0.28 and the third one at $0.30.
Below the current price, the first support level is at $0.24, then the second at $0.22 and the third one at $0.19.5.
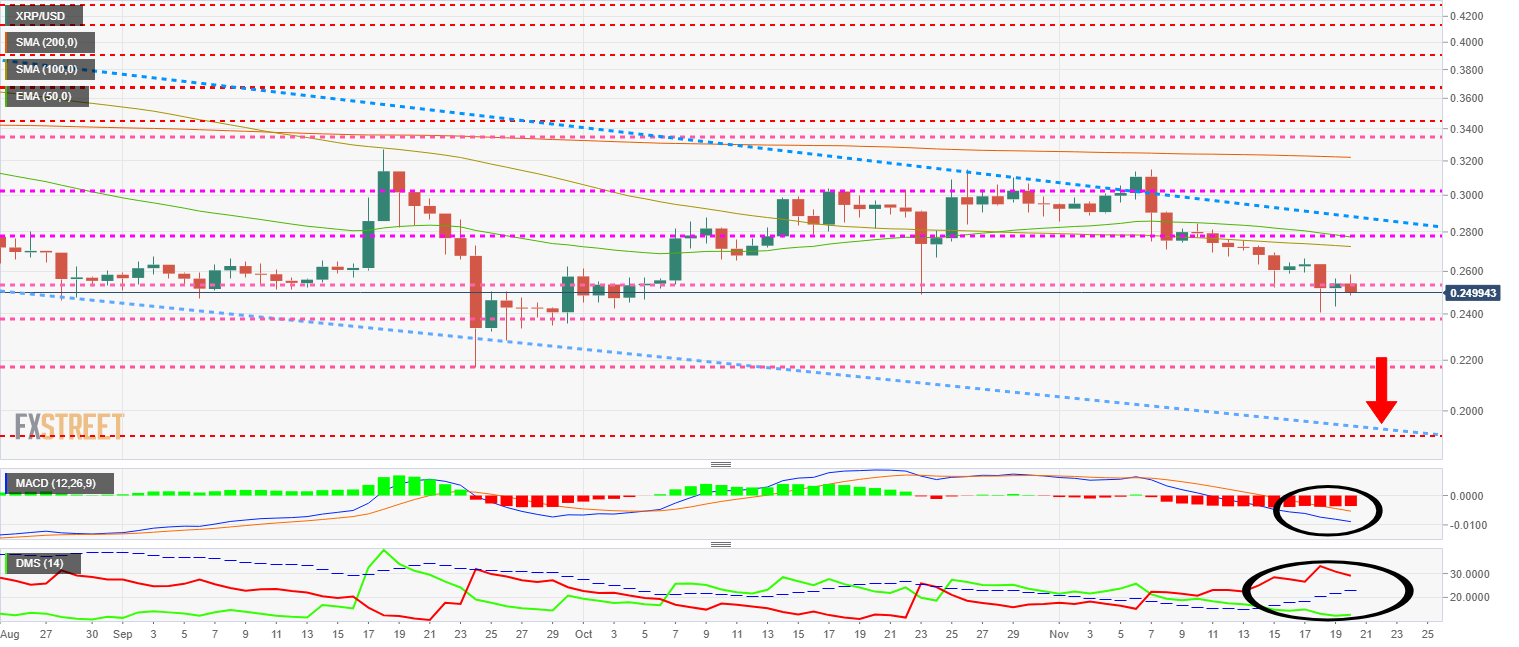
The MACD shows a robust bearish profile, with the moving averages very separate, which complicates a possible bullish turn in the short term.
The DMI on the daily chart shows extreme positions of both bulls and bears. The extremely deviated situation of the trend strength levels of bulls and bears can cause an upward rebound, but we are yet to know if it would be enough to turn the XRP price around.
Get 24/7 Crypto updates in our social media channels: Give us a follow at @FXSCrypto and our FXStreet Crypto Trading Telegram channel
Information on these pages contains forward-looking statements that involve risks and uncertainties. Markets and instruments profiled on this page are for informational purposes only and should not in any way come across as a recommendation to buy or sell in these assets. You should do your own thorough research before making any investment decisions. FXStreet does not in any way guarantee that this information is free from mistakes, errors, or material misstatements. It also does not guarantee that this information is of a timely nature. Investing in Open Markets involves a great deal of risk, including the loss of all or a portion of your investment, as well as emotional distress. All risks, losses and costs associated with investing, including total loss of principal, are your responsibility. The views and opinions expressed in this article are those of the authors and do not necessarily reflect the official policy or position of FXStreet nor its advertisers. The author will not be held responsible for information that is found at the end of links posted on this page.
If not otherwise explicitly mentioned in the body of the article, at the time of writing, the author has no position in any stock mentioned in this article and no business relationship with any company mentioned. The author has not received compensation for writing this article, other than from FXStreet.
FXStreet and the author do not provide personalized recommendations. The author makes no representations as to the accuracy, completeness, or suitability of this information. FXStreet and the author will not be liable for any errors, omissions or any losses, injuries or damages arising from this information and its display or use. Errors and omissions excepted.
The author and FXStreet are not registered investment advisors and nothing in this article is intended to be investment advice.
Recommended Content
Editors’ Picks
Ethereum dips slightly amid Renzo depeg, BlackRock spot ETH ETF amendment

Ethereum (ETH) suffered a brief decline on Wednesday afternoon despite increased accumulation from whales. This follows Ethereum restaking protocol Renzo restaked ETH (ezETH) crashing from its 1:1 peg with ETH and increased activities surrounding spot Ethereum ETFs.
Injective price weakness persists despite over 5.9 million INJ tokens burned
Injective (INJ) price is trading with a bearish bias, stuck in the lower section of the market range. The bearish outlook abounds despite the network's deflationary efforts to pump the price. Coupled with broader market gloom, INJ token’s doomed days may not be over yet.
US intensifies battle against crypto privacy protocols following crackdown on Samourai Wallet

CEO Keonne Rodriguez and CTO William Lonergan of Samourai Wallet were arrested by the US Department of Justice (DoJ) on Wednesday and charged with $100 million in money laundering on a count and illegal money transmitting on another count. This move could see privacy-focused cryptocurrencies take a dip.
Near Protocol Price Prediction: NEAR fulfills targets but a 10% correction may be on the horizon
Near Protocol price has completed a 55% mean reversal from the bottom of the market range at $4.27. Amid growing bearish activity, NEAR could drop 10% to the $6.00 psychological level before a potential recovery. A break and close above $7.95 would invalidate the downleg thesis.
Bitcoin: BTC post-halving rally could be partially priced in Premium

Bitcoin (BTC) price briefly slipped below the $60,000 level for the last three days, attracting buyers in this area as the fourth BTC halving is due in a few hours. Is the halving priced in for Bitcoin? Or will the pioneer crypto note more gains in the coming days?