- The technical profile of Bitcoin is worrying in the short and medium term.
- Ethereum retains its upside setup despite widespread falls.
- XRP amplifies weakness and moves to new relative lows.
Amid the selloff that suffers the crypto market, the SEC comes providing a point of hope that could eclipse the so desired brightness of the Moon.
In a voluntary and unexpected decision, the US regulator announced that they will review Bitwise's request to launch an ETF on Bitcoins.
The statistics tell us that the result will be negative since that has always been the final resolution to all previous proposals.
The impact on the price that the ETF approval could have on Bitcoin is uncertain, but almost all experts believe it could bring the BTC/USD price to the $100,000 range.
Fundstrat Global Advisors co-founder Tom Lee said two days ago that it would take the BTC/USD pair to reach $150,000 for an ETF to enter the market without seriously distorting it.
ETH/BTC Daily Chart
The ETH/BTC is currently trading at the price level of 0.02169. The price evolution shows a good moment for Ethereum versus Bitcoin.
As the market identifies the opportunity in the Ethereum, the upward movement could accelerate.
Above the current price, the first resistance level is at 0.022, then the second at 0.023 and the third one at 0.025.
Below the current price, the first support level is at 0.021, then the second at 0.020 and the third one at 0.019.
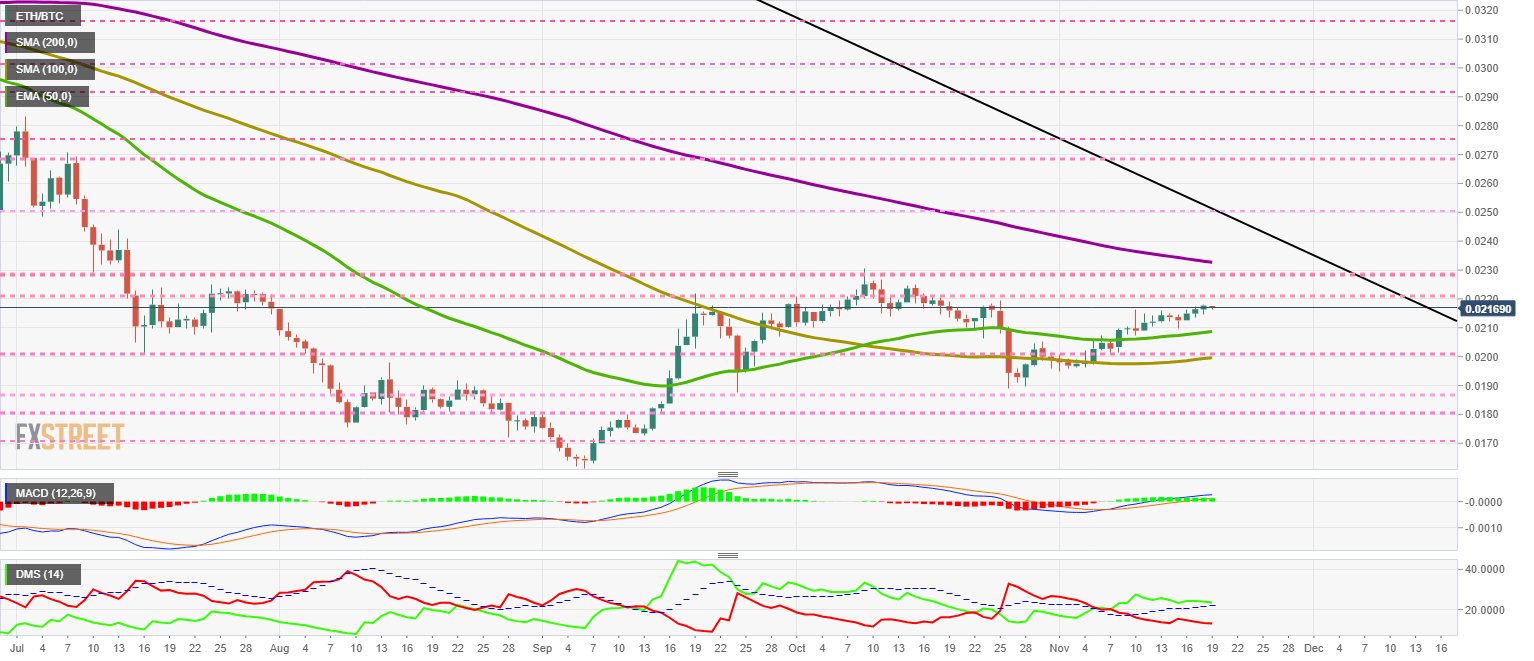 The MACD on the daily chart retains its bullish slope and openness between the lines, so according to this indicator, the optimistic scenario remains intact.
BTC/USD Daily Chart
The BTC/USD pair is currently trading at the $8,039 price level after leaving the day's low of $8,080 during the Asian session.
The technical picture is bleak. The SMA100 crosses down the SMA200, proposing worse price levels in the short term.
In the analysis of the indicators, we will see the magnitude of the disaster.
Above the current price, the first resistance level is at $8,250, then the second at $8,400 and the third one at $8,820.
Below the current price, the first support level is at $8,000, then the second at $7,750 and the third one at $7,550.
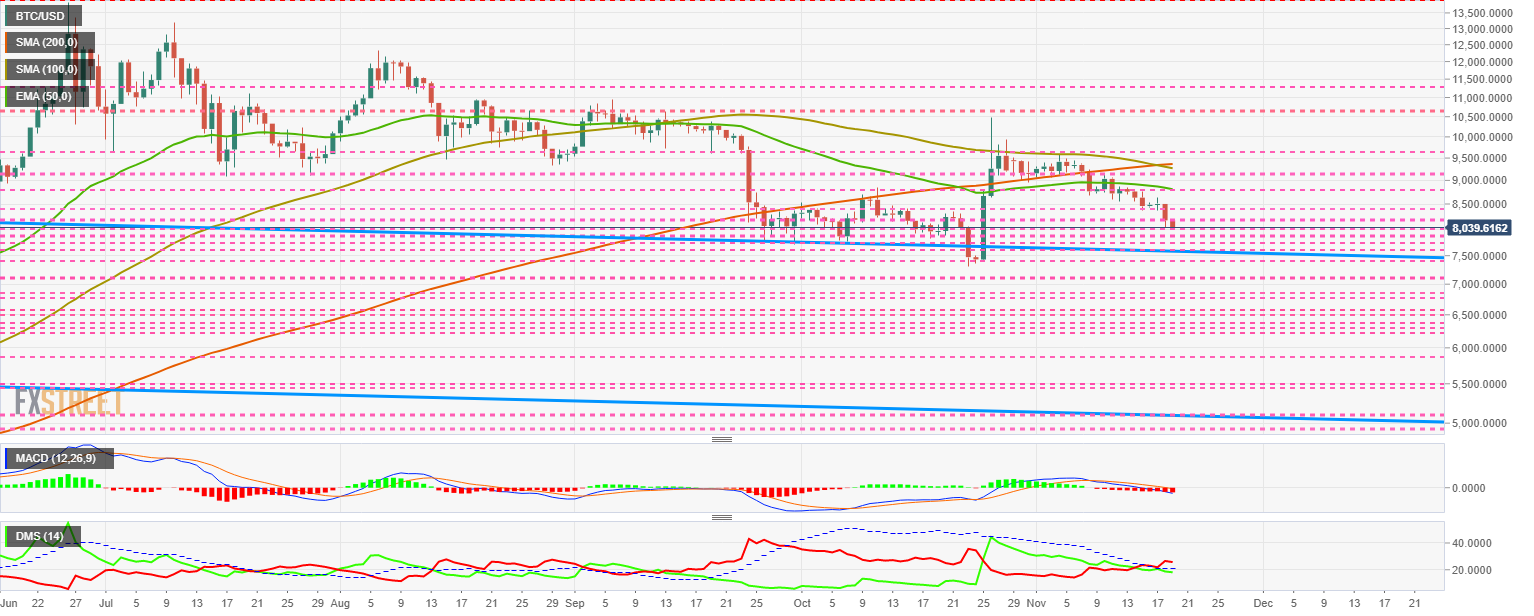 The MACD on the daily chart shows the moving averages already in the negative zone of the indicator. The slope maintained as well as the opening between the lines, and therefore, the bearish trend will continue.
The DMI on the daily chart shows bears beating the resistance of the ADX line. The selling side activates a pattern that indicates that there is an ongoing and developing bearish trend. The bulls stay below the ADX line and thus renounce discussing leadership to the bears.
ETH/USD Daily Chart
ETH/USD is currently trading at the $173.4 price level after yesterday's relative low of $175. The technical structure of the pair is not as harmful as that of the BTC/USD.
Past months, the Ethereum has done much worse than the Bitcoin, so a change of roles comes within expectations.
Above the current price, the first resistance level is at $180, then the second at $190 and the third one at $195.
Below the current price, the first support level is at $170, then the second at $160 and the third one at $150.
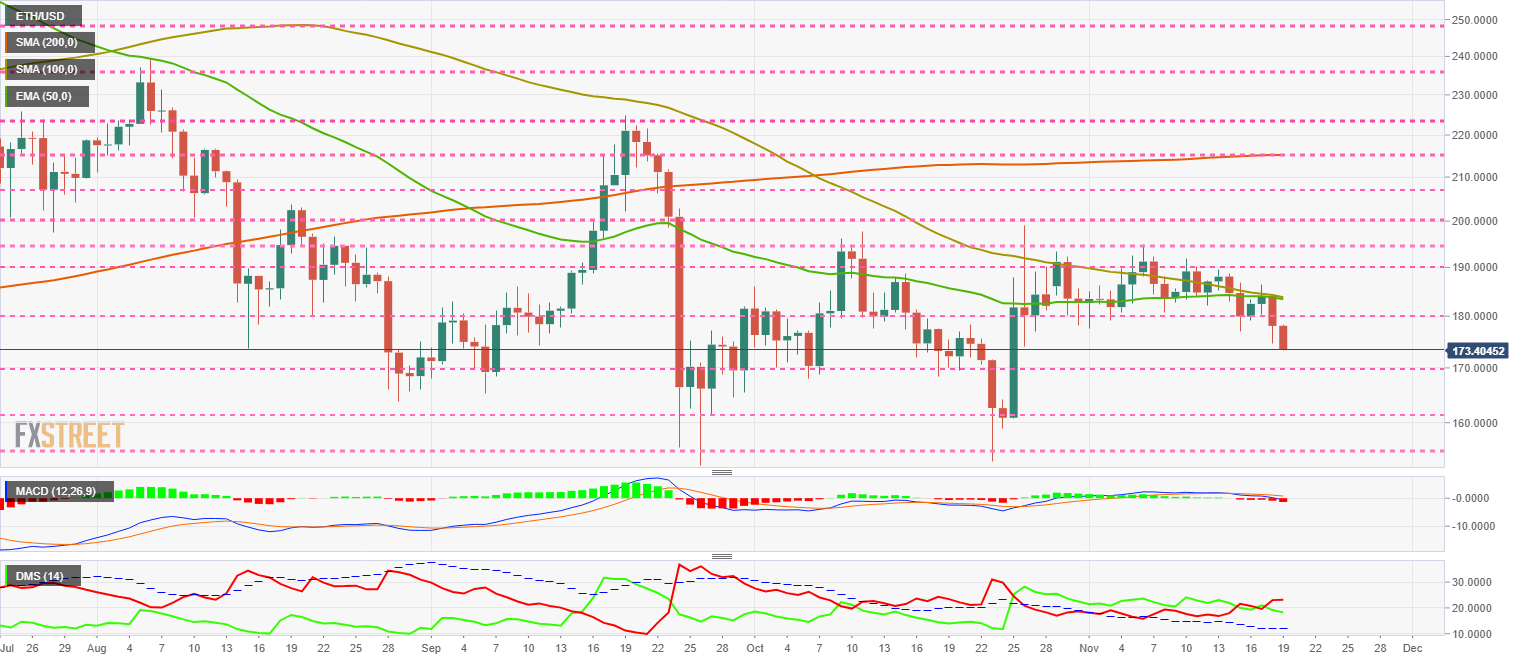 The MACD on the daily chart remains on the positive side of the indicator. The pattern indicates that a bullish rebound is likely to occur in the short term.
The DMI on the daily chart shows both sides of the market continuously swapping positions. The ADX remains at its lowest level, waiting for the right side of the market to start moving higher.
XRP/USD Daily Chart
The XRP/USD is currently trading at the $0.243 price level after yesterday's relative low of $0.24.
Above the current price, the first resistance level is at $0.252, then the second at $0.26 and the third one at $0.27.
Below the current price, the first support level is at $0.24, then the second at $0.22 and the third one at $0.191.
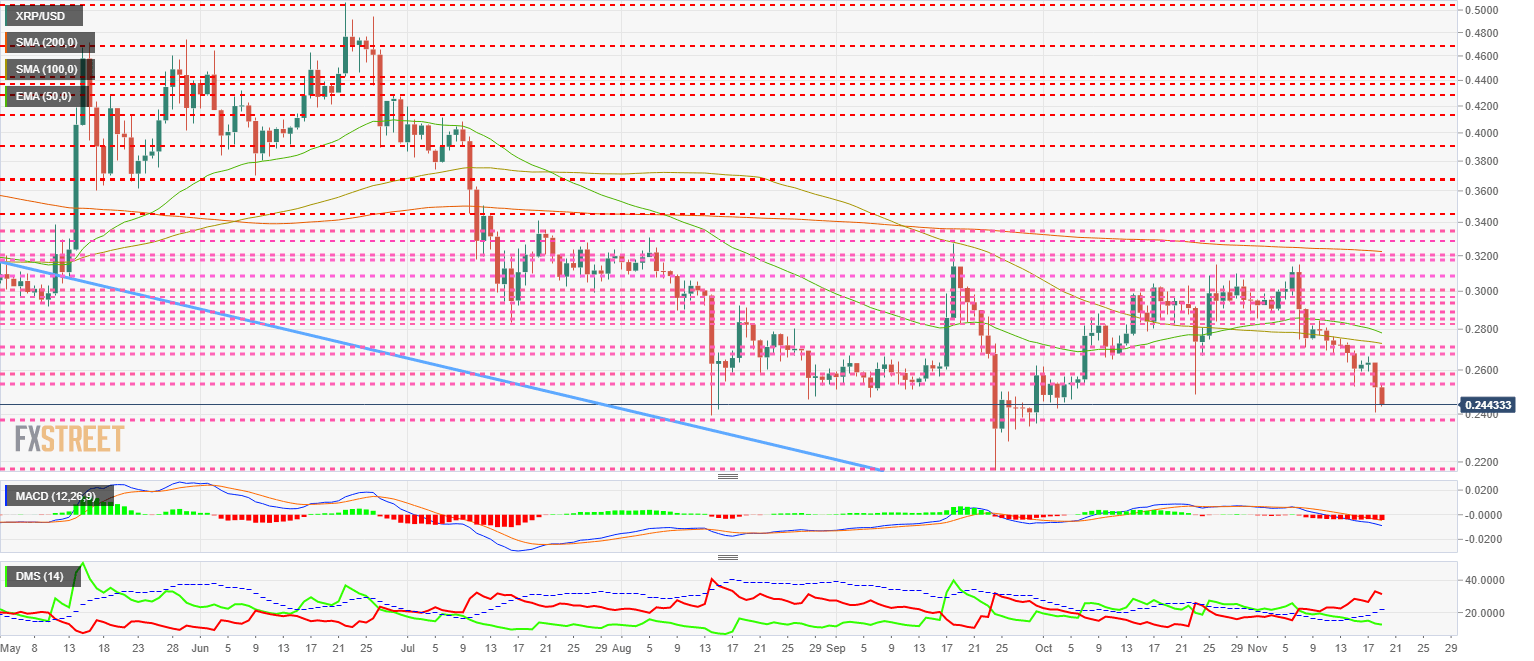
The MACD on the daily chart goes deep into the negative territory of the indicator. The slope remains, but the opening between the lines increases, indicating the continuation of the bearish movement.
The DMI on the daily chart shows bears leading the XRP/USD. Bulls continue to fall below the ADX line. The short term scenario is fully bearish.
Get 24/7 Crypto updates in our social media channels: Give us a follow at @FXSCrypto and our FXStreet Crypto Trading Telegram channel
Information on these pages contains forward-looking statements that involve risks and uncertainties. Markets and instruments profiled on this page are for informational purposes only and should not in any way come across as a recommendation to buy or sell in these assets. You should do your own thorough research before making any investment decisions. FXStreet does not in any way guarantee that this information is free from mistakes, errors, or material misstatements. It also does not guarantee that this information is of a timely nature. Investing in Open Markets involves a great deal of risk, including the loss of all or a portion of your investment, as well as emotional distress. All risks, losses and costs associated with investing, including total loss of principal, are your responsibility. The views and opinions expressed in this article are those of the authors and do not necessarily reflect the official policy or position of FXStreet nor its advertisers. The author will not be held responsible for information that is found at the end of links posted on this page.
If not otherwise explicitly mentioned in the body of the article, at the time of writing, the author has no position in any stock mentioned in this article and no business relationship with any company mentioned. The author has not received compensation for writing this article, other than from FXStreet.
FXStreet and the author do not provide personalized recommendations. The author makes no representations as to the accuracy, completeness, or suitability of this information. FXStreet and the author will not be liable for any errors, omissions or any losses, injuries or damages arising from this information and its display or use. Errors and omissions excepted.
The author and FXStreet are not registered investment advisors and nothing in this article is intended to be investment advice.
Recommended Content
Editors’ Picks
Ripple wipes out weekly gains, experts comment on role of Ripple stablecoin

Ripple declined to $0.52 on Thursday, erasing all gains registered earlier this week. Ripple SVP Eric van Miltenburg’s comments on the firm’s stablecoin, and how it is expected to benefit the XRP Ledger and native token XRP have raised concerns among crypto experts.
Hedera HBAR slips nearly 10% after air is cleared on mistaken link with giant BlackRock
HBAR price is down nearly 10% on Thursday, partly erasing gains inspired by the misinterpreted link with BlackRock. Despite the recent correction, Hedera’s price is up 44% in the past seven days.
The reason behind Bonk’s 105% rise and if you should buy now Premium

Bonk price has shot up 105% in the past five weeks. A retracement into $0.0000216 or the $0.0000152 to $0.0000186 imbalance would be a good buying opportunity. Patient investors can expect double-digit gains from BONK that could extend up to 70%.
Injective price weakness persists despite over 5.9 million INJ tokens burned
Injective price is trading with a bearish bias, stuck in the lower section of the market range. The bearish outlook abounds despite the network's deflationary efforts to pump the price. Coupled with broader market gloom, INJ token’s doomed days may not be over yet.
Bitcoin: BTC post-halving rally could be partially priced in Premium

Bitcoin (BTC) price briefly slipped below the $60,000 level for the last three days, attracting buyers in this area as the fourth BTC halving is due in a few hours. Is the halving priced in for Bitcoin? Or will the pioneer crypto note more gains in the coming days?