- Financial Options mitigate risk in highly volatile assets.
- Ethereum and Ripple show uncertain technicals - elevated volatility is likely.
- ETH/USD moves to the limit of the critical double bottom level.
The Chicago Mercantile Exchange or CME, has announced the release of Options on Bitcoin futures for Q1 2020 this morning.
The value of the tick will be $25 in the Premium option and $5 in the standard version. The reference asset will be CME Bitcoin Futures, both in price and trading hours.
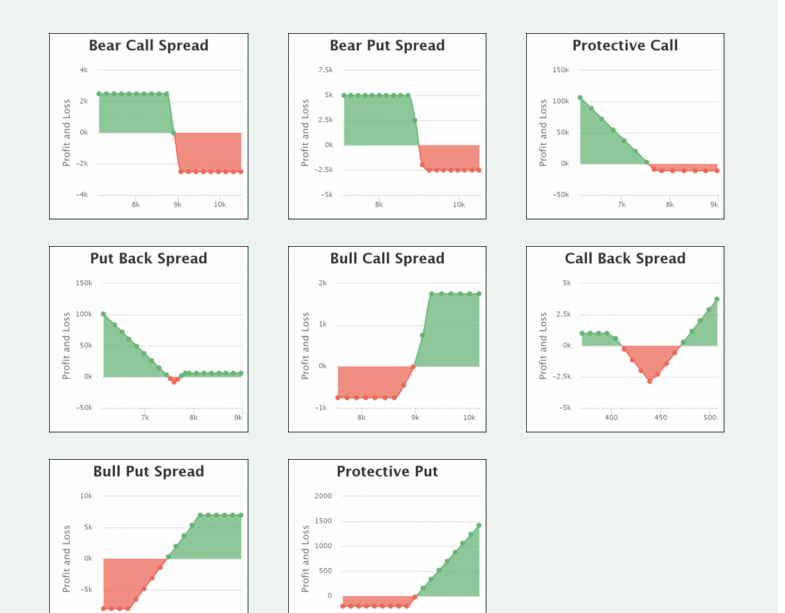
The possibility of trading Bitcoin using Financial Options facilitates the implementation of new strategies, whether hedging operations, volatility trading or on maturities.
Professional investors widely use financial Options for the large number of trading combinations they allow.
Let's take a quick look at the differences between tools:
- Cash trading only allows you to take advantage of the bullish direction (except inverse ETF). The P&L is directly related to the spot price.
Advantages: You will never receive a margin call, and you will be able to keep your investment indefinitely. Losses cannot exceed the amount invested.
Disadvantages: High capital consumption due to lack of leverage.
- Trading in Bitcoin futures allows you to position yourself on both sides of the market, both bullish and bearish. The P&L is directly related to the spot price.
Advantages: You only have to contribute a part of the notional value of your investment. You can maintain your activity in bear markets. It is a leveraged product.
Disadvantages: Losses may exceed the amount initially invested. Futures have a due date; if you want to keep the investment, you must roll from one contract to another.
- Financial options allow multiple strategies. Options can be bought or sold, both calls and puts. In the Call options, the cost is limited to the premium. Put options, you collect the quoted price, but losses can be unlimited.
Source:quora.com
Advantages: They allow to limit the risk more than any other tool (Calls). The options calculation formula incorporates variables such as time to maturity, volatility, interest rate, etc. You can isolate any of these variables and trade based on them. It is the preferred tool of institutions.
Disadvantages: Losses can be unlimited if you sell Puts. Learning to trade options is complex at all levels.
ETH/BTC Daily Chart
ETH/BTC is currently trading at 0.01986. The SMA100 adds strength to the price congestion support. The apparent weakness is attributable to a final phase of consolidation after the relative highs of 0.023.
Above the current price, the first resistance level is at 0.021, then the second at 0.022 and the third one at 0.023.
Below the current price, the first support level is at 0.019, then the second at 0.018 and the third one at 0.017.
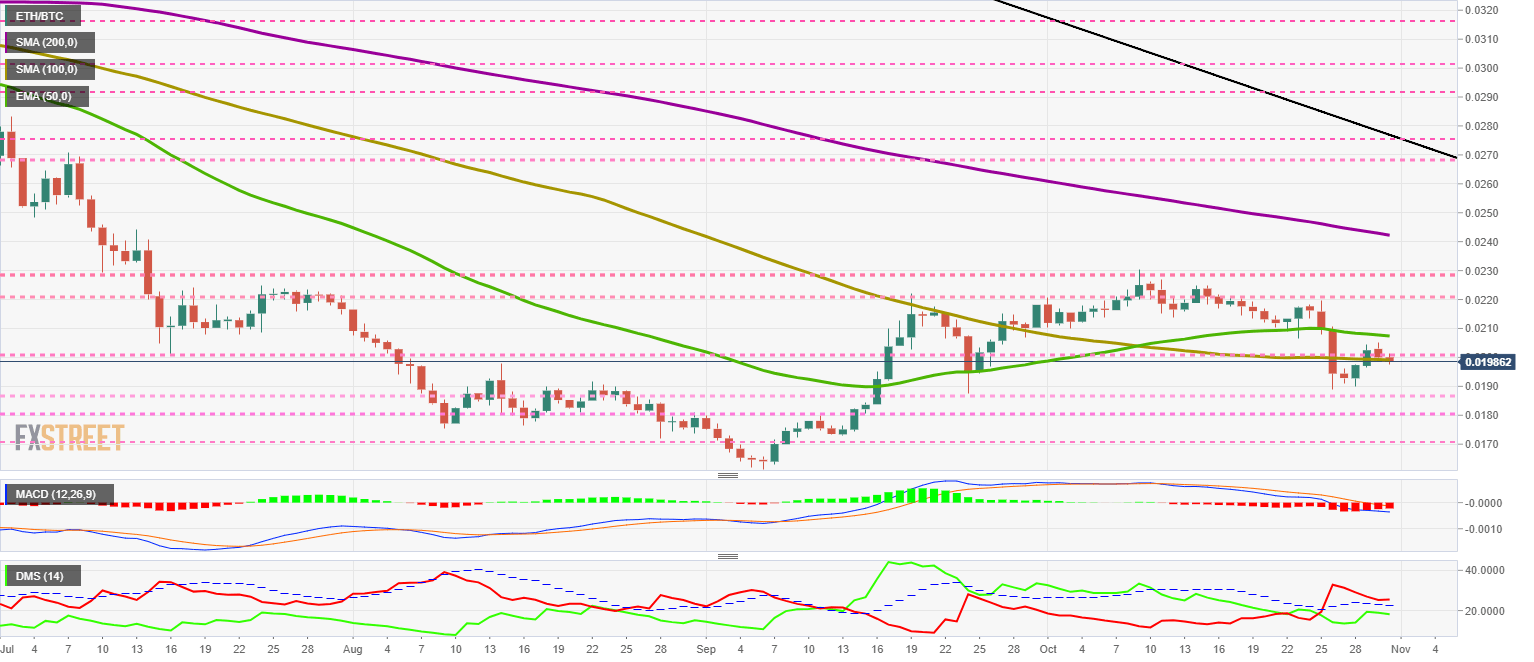
The MACD on the daily chart continues to soften the bearish profile. The MACD on the daily chart continues to weaken the bearish profile. It is already in the negative zone, which will add difficulty to any bullish attempt.
The DMI on the daily chart shows bears descending that it only stops when they reach the ADX line. The bulls are in the opposite situation, and it is probably that in the next few days they will attempt to cross the ADX line upwards.
BTC/USD Daily Chart
BTC/USD is currently trading at $9,029 and finds support above the SMA200 and the EMA50.
Above the current price, the first support level at $9,050, then the second at $8,800 and the third one at $8,500.
Below the current price, the first resistance level is at $9,150, then the second at $9,600 and the third one at $10,600.
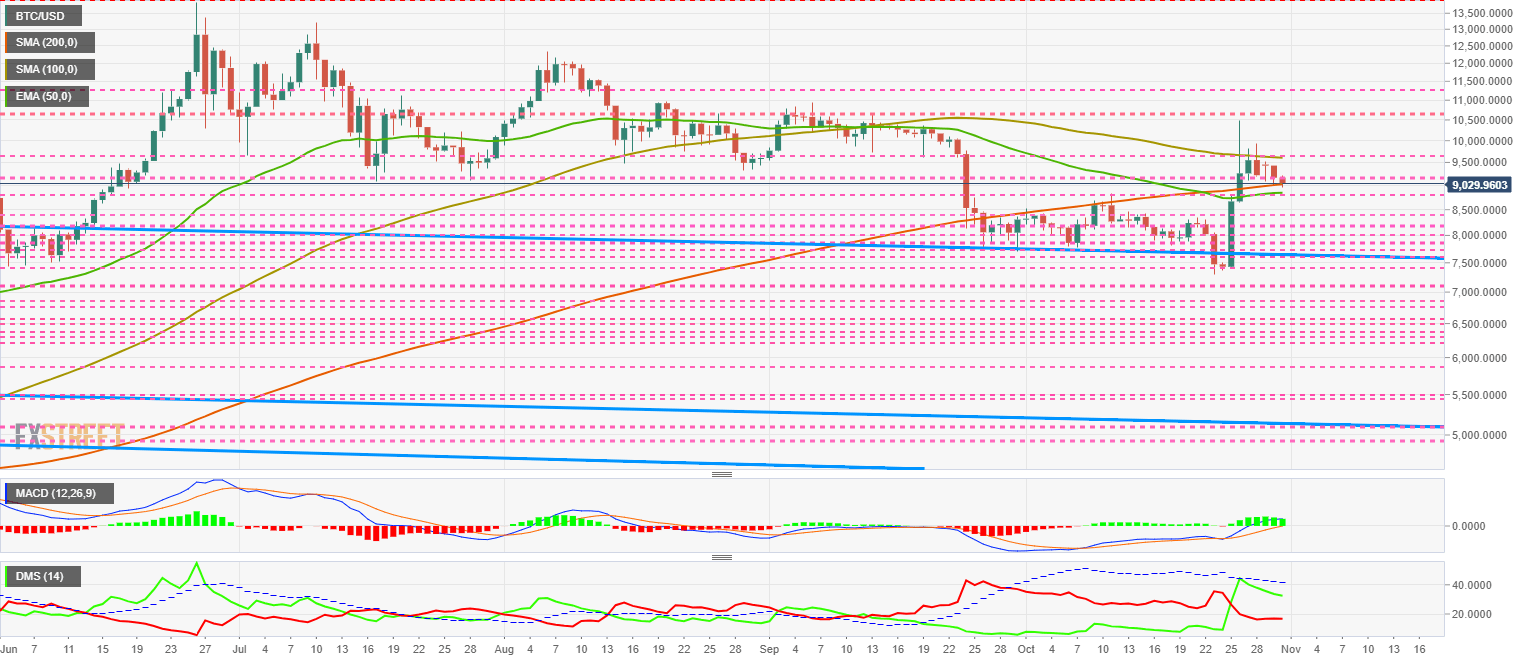
The MACD on the daily chart preserves both the slope and the opening between the lines. It seems highly likely that a break above the neutral level of the indicator could happen.
The DMI on the daily chart shows both sides of the market, maintaining previous levels. The bulls will try again to break the bullish ADX line. The bears remain at high levels but do not exceed 20, which indicates the existence of trend strength.
ETH/USD Daily Chart
ETH/USD is currently trading at $180 and is breaking below moving averages.
Above the current price, the first resistance level is at $190, then the second at $195 and the third one at $200.
Below the current price, the first support level is at $180, then the second at $170 and the third one at $160.
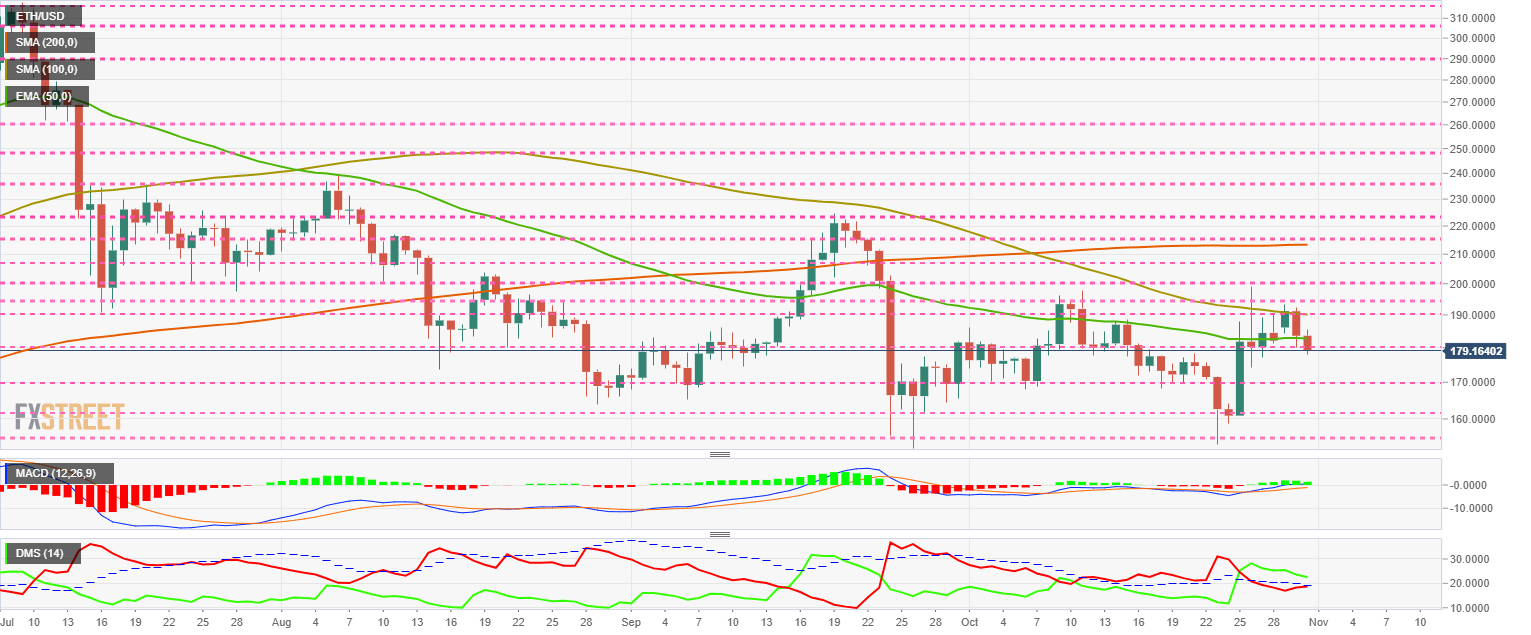
The MACD on the daily chart shows a loss of bullish profile just below the bullish zone of the indicator. It is a clear sign of weakness, but it can change quickly due to the very closeness of the bullish side.
The DMI on the daily chart shows how bulls lose trend strength. The bullish side remains above the ADX line, so the bullish momentum continues intact. The Bulls do not react upwards, but they move at levels close to the bulls and may try to attack their position.
XRP/USD Daily Chart
XRP/USD is currently trading at $0.2901 and is losing the critical $0.30 level once again.
Above the current price, the first resistance level is at $0.295, then the second at $0.30 and the third one at $0.31.
Below the current price, the first support level is at $0.29, then the second at $0.285 and the third one at $0.28.
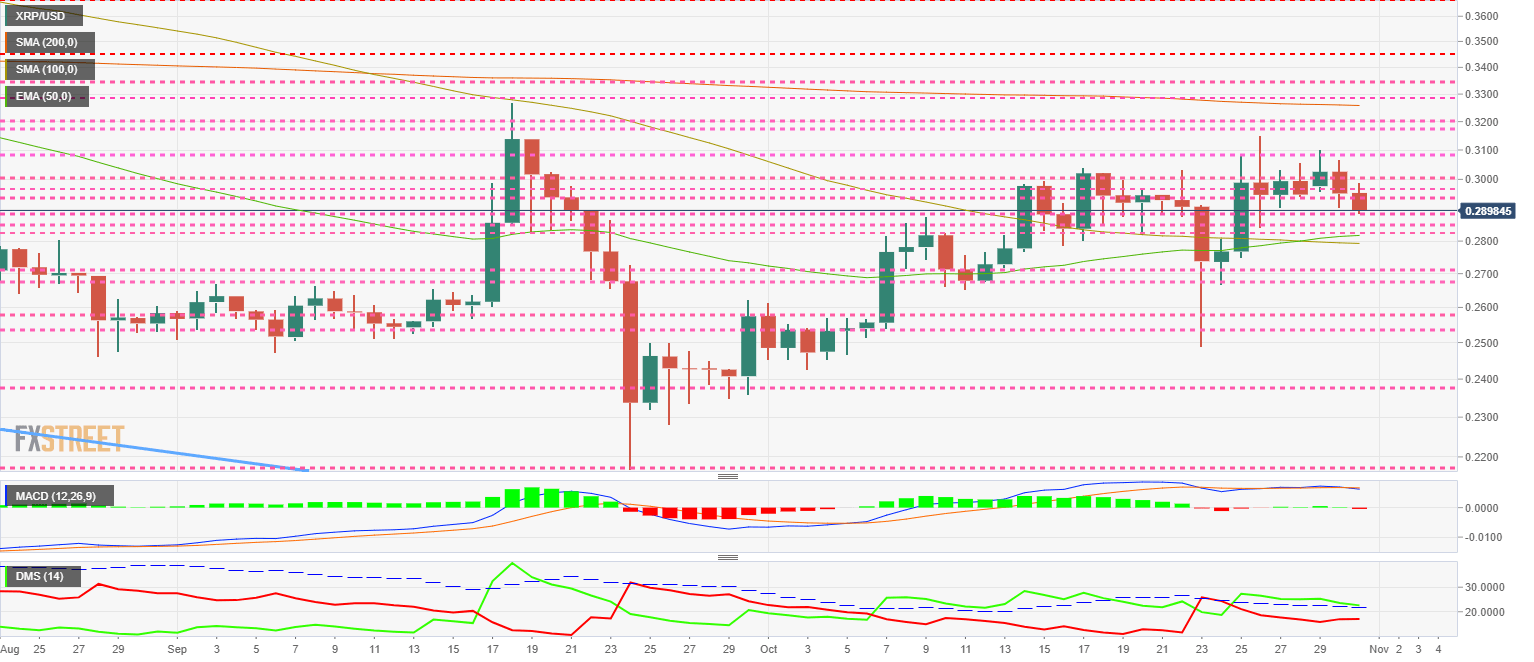
The MACD on the daily chart shows a slight bearish divergence. The indicator is crossed down within a fully flat profile. In the short term, price behavior will tend to decline.
The DMI on the daily chart shows the bulls above the ADX line, thus keeping the bullish momentum active. The bears lose some strength and do not seem to want to take advantage of the apparent weakness of the buyer side.
Get 24/7 Crypto updates in our social media channels: Give us a follow at @FXSCrypto and our FXStreet Crypto Trading Telegram channel
Information on these pages contains forward-looking statements that involve risks and uncertainties. Markets and instruments profiled on this page are for informational purposes only and should not in any way come across as a recommendation to buy or sell in these assets. You should do your own thorough research before making any investment decisions. FXStreet does not in any way guarantee that this information is free from mistakes, errors, or material misstatements. It also does not guarantee that this information is of a timely nature. Investing in Open Markets involves a great deal of risk, including the loss of all or a portion of your investment, as well as emotional distress. All risks, losses and costs associated with investing, including total loss of principal, are your responsibility. The views and opinions expressed in this article are those of the authors and do not necessarily reflect the official policy or position of FXStreet nor its advertisers. The author will not be held responsible for information that is found at the end of links posted on this page.
If not otherwise explicitly mentioned in the body of the article, at the time of writing, the author has no position in any stock mentioned in this article and no business relationship with any company mentioned. The author has not received compensation for writing this article, other than from FXStreet.
FXStreet and the author do not provide personalized recommendations. The author makes no representations as to the accuracy, completeness, or suitability of this information. FXStreet and the author will not be liable for any errors, omissions or any losses, injuries or damages arising from this information and its display or use. Errors and omissions excepted.
The author and FXStreet are not registered investment advisors and nothing in this article is intended to be investment advice.
Recommended Content
Editors’ Picks
SEC doubles down on TRON's Justin Sun lawsuit dismissing claims over jurisdiction

The SEC says it has jurisdiction to bring Justin Sun to court as he traveled extensively to the US. Sun asked to dismiss the suit, arguing that the SEC was targeting actions taken outside the US.
XRP fails to break past $0.50, posting 20% weekly losses

XRP trades range-bound below $0.50 for a sixth consecutive day, accumulating 20% losses in the last seven days. Ripple is expected to file its response to the SEC’s remedies-related opening brief by April 22.
ImmutableX extends recovery despite $69 million IMX token unlock
ImmutableX unlocked 34.19 million IMX tokens worth over $69 million early on Friday. IMX circulating supply increased over 2% following the unlock. The Layer 2 blockchain token’s price added nearly 3% to its value on April 19.
Bitcoin Weekly Forecast: BTC post-halving rally could be partially priced in Premium

Bitcoin price briefly slipped below the $60,000 level for the last three days, attracting buyers in this area as the fourth BTC halving is due in a few hours. Is the halving priced in for Bitcoin? Or will the pioneer crypto note more gains in the coming days?
Bitcoin: BTC post-halving rally could be partially priced in Premium
Bitcoin (BTC) price briefly slipped below the $60,000 level for the last three days, attracting buyers in this area as the fourth BTC halving is due in a few hours. Is the halving priced in for Bitcoin? Or will the pioneer crypto note more gains in the coming days?