- Ethereum and Bitcoin end the silence ahead of the leadership of the coming months.
- XRP looks technically terrifying but the unexpected may happen.
- The next 60 hours will be critical for the next few months.
The week is drawing to an end, and the crypto market is still contracting. Price falls yet to enter the terminal phase, so fear is absent among holders of crypto assets.
The market is looking firmly at the relationship between Altcoins and Bitcoin.
This dance is an aspect that is often forgotten among cryptocurrencies, but it can result in a decisive change in the final result of the investment.
Today I will compare the technical dominance charts of the components of the Top 3 cryptocurrencies.
Bitcoin Dominance weekly chart.
The graphical representation of Bitcoin’s dominance clarifies that it is in a full downward trend after reaching 73.4% at the beginning of the year.
Fibonacci retracements offer a dominance level of 64.5% as the first target.
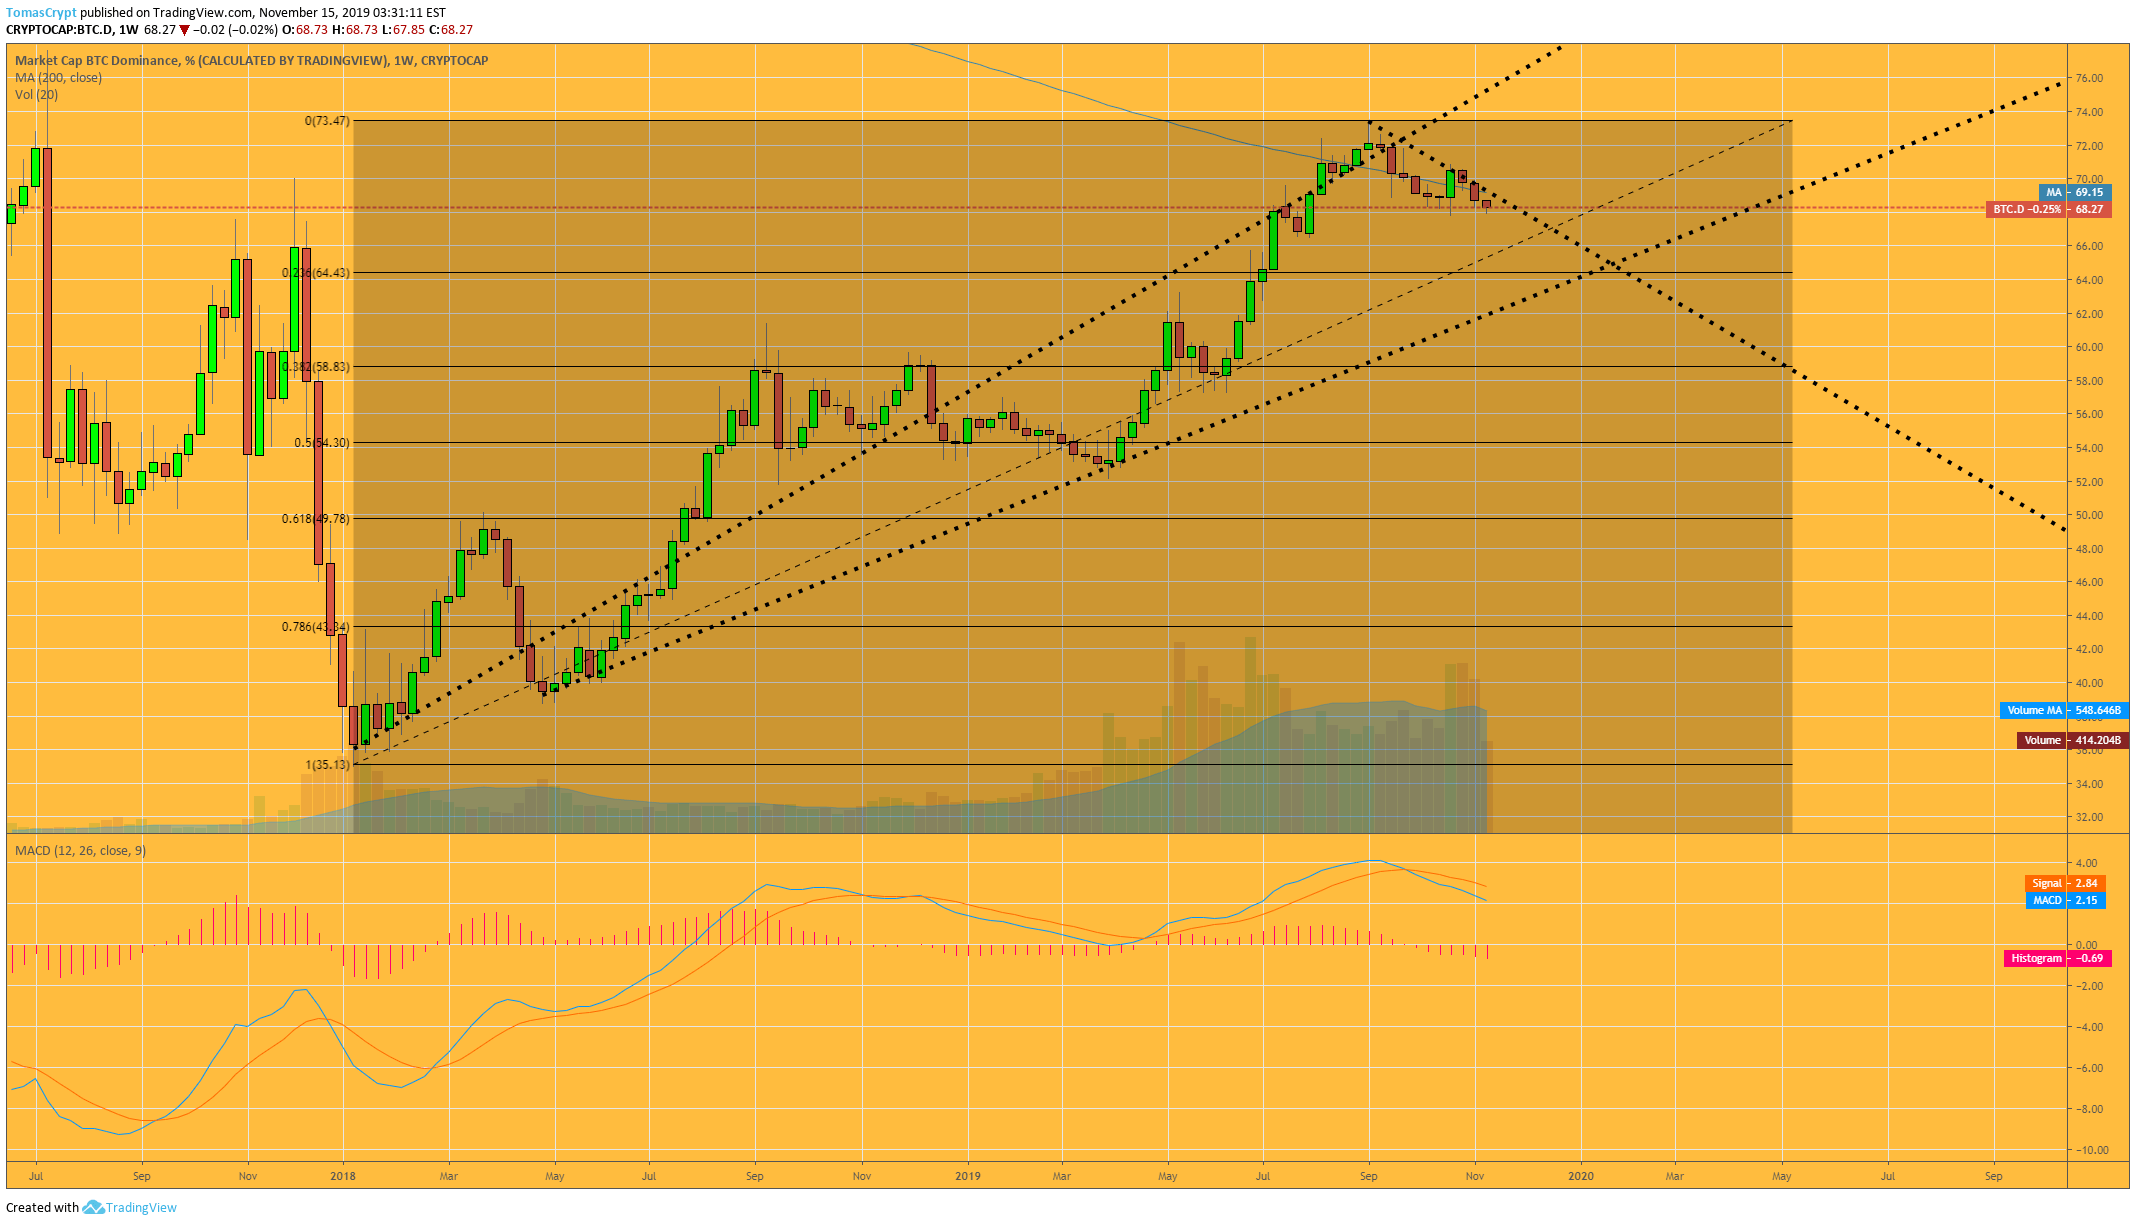
The MACD on the weekly chart shows the enormous potential of the current bearish trend, which should translate into a substantial loss of Bitcoin dominance against the global market.
The 50% retracement level would bring Bitcoin dominance to 54.3%.
Ethereum Dominance weekly chart.
Vitalik Buterin’s brainchild’s dominance is critical for the broader market.
Ethereum’s dominance is trapped in final area of a bearish compressive triangle. In the weekly chart, the current candle – which closes on Sunday – may serve as the long-awaited sign of shift change in leadership at the front of the crypto market.
The impact on the level of dominance can come from a substantial depreciation of Bitcoin (current absolute dominator) or by a massive appreciation of the value of Ethereum against the rest of assets crypto.
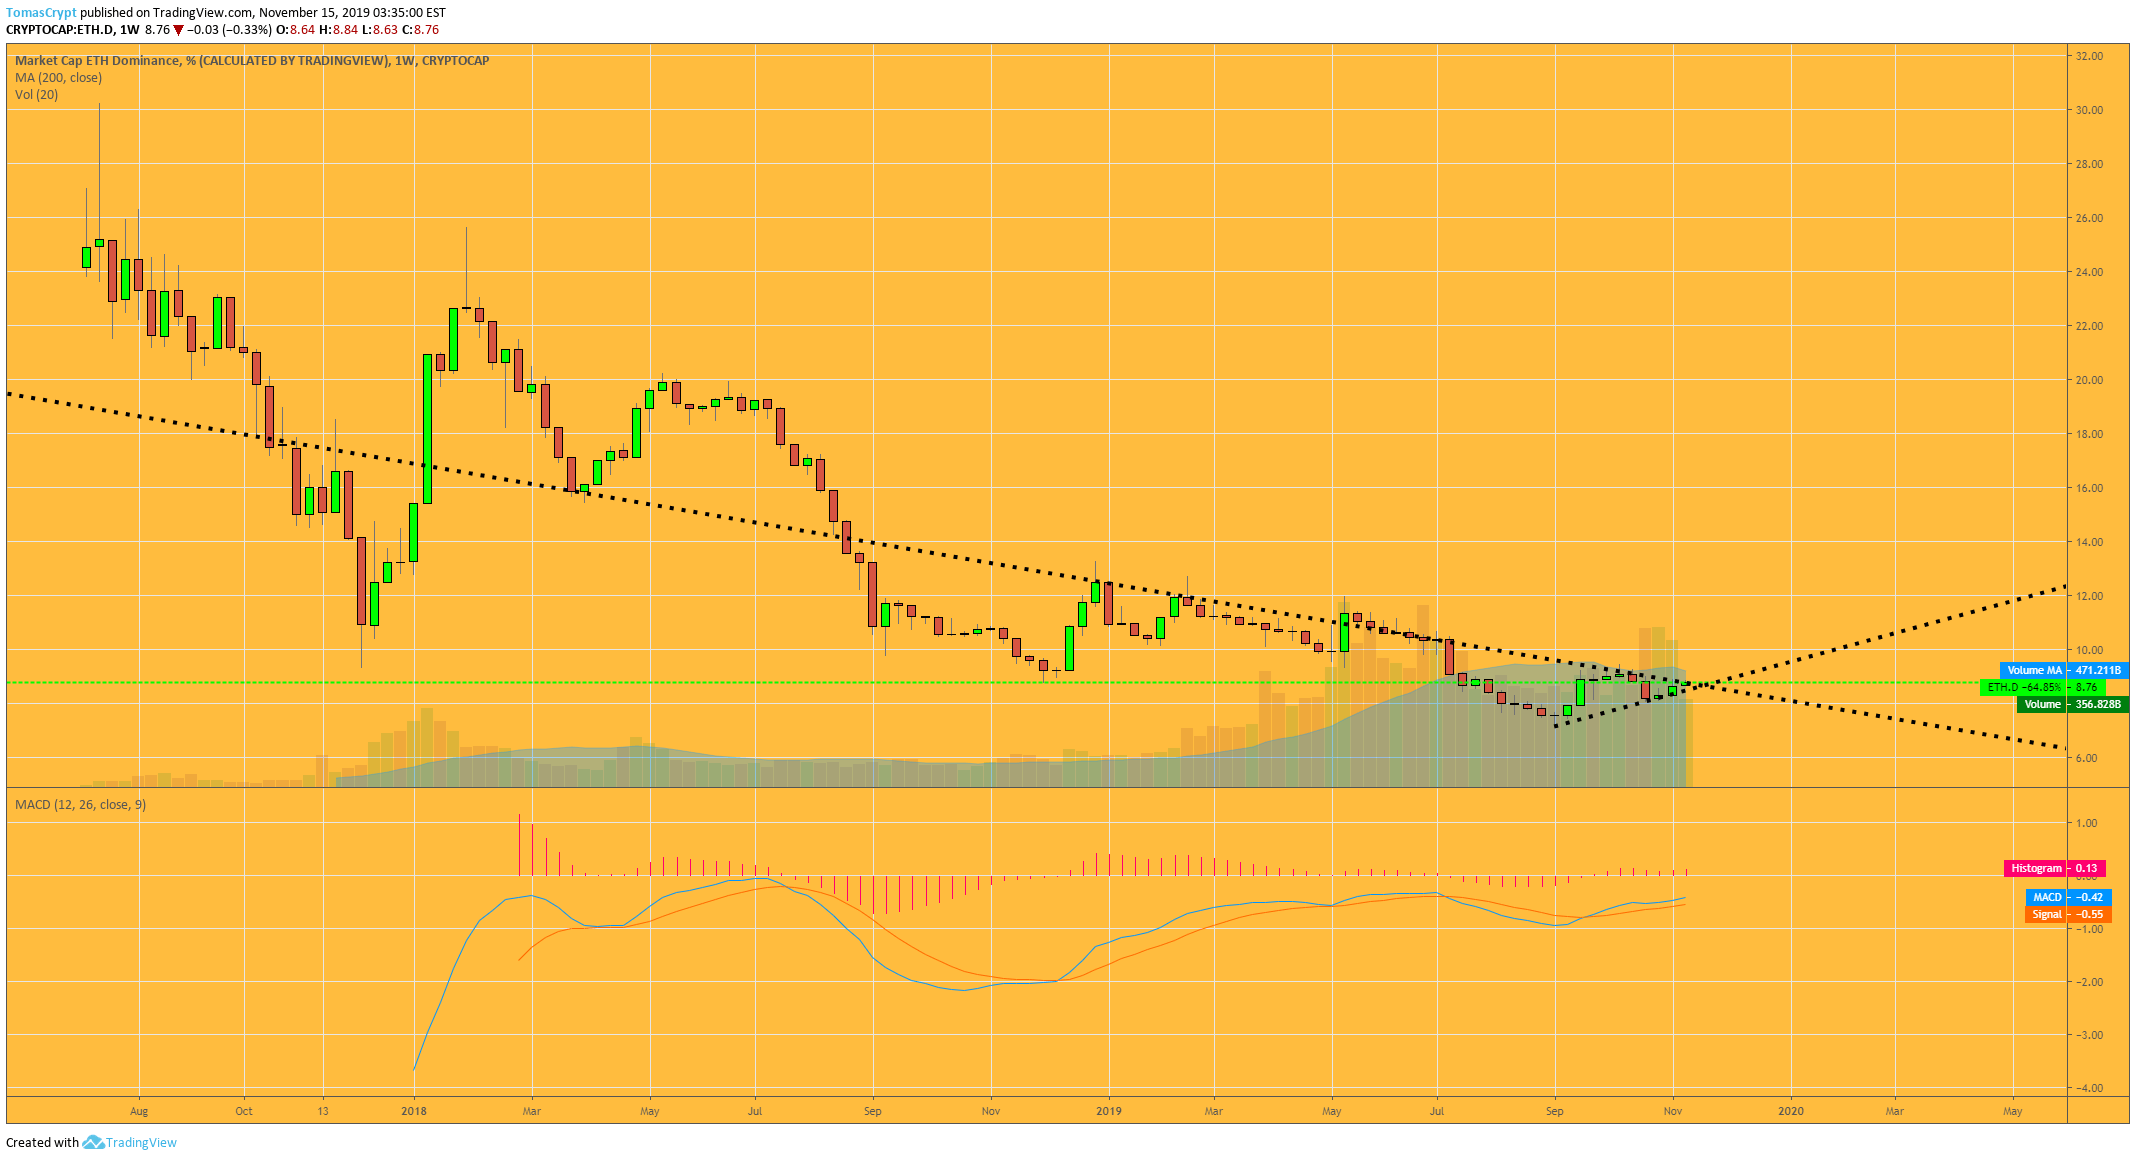
The current dominance level of Ethereum is 8.7%. Fibonacci's reversal levels of all the previous bearish trend place the first target at 12.6%.
The MACD on the weekly chart shows a continuous bullish profile in the short and medium-term.
XRP Dominance weekly chart.
XRP’s dominance chart is showing that it entered a bearish quadrant, although for now, Ripple’s token remains in the most desirable area of the scenario.
Among the Top 3 cryptocurrencies, XRP is suffering the worst performance in terms of dominance. At the beginning of October, it failed in its attempt to break the ceiling of the current scenario.
XRP’s capitalization is only 5%. If it continues to lose weight, it could look for the next level of support at 2.27% and 1.09% later.
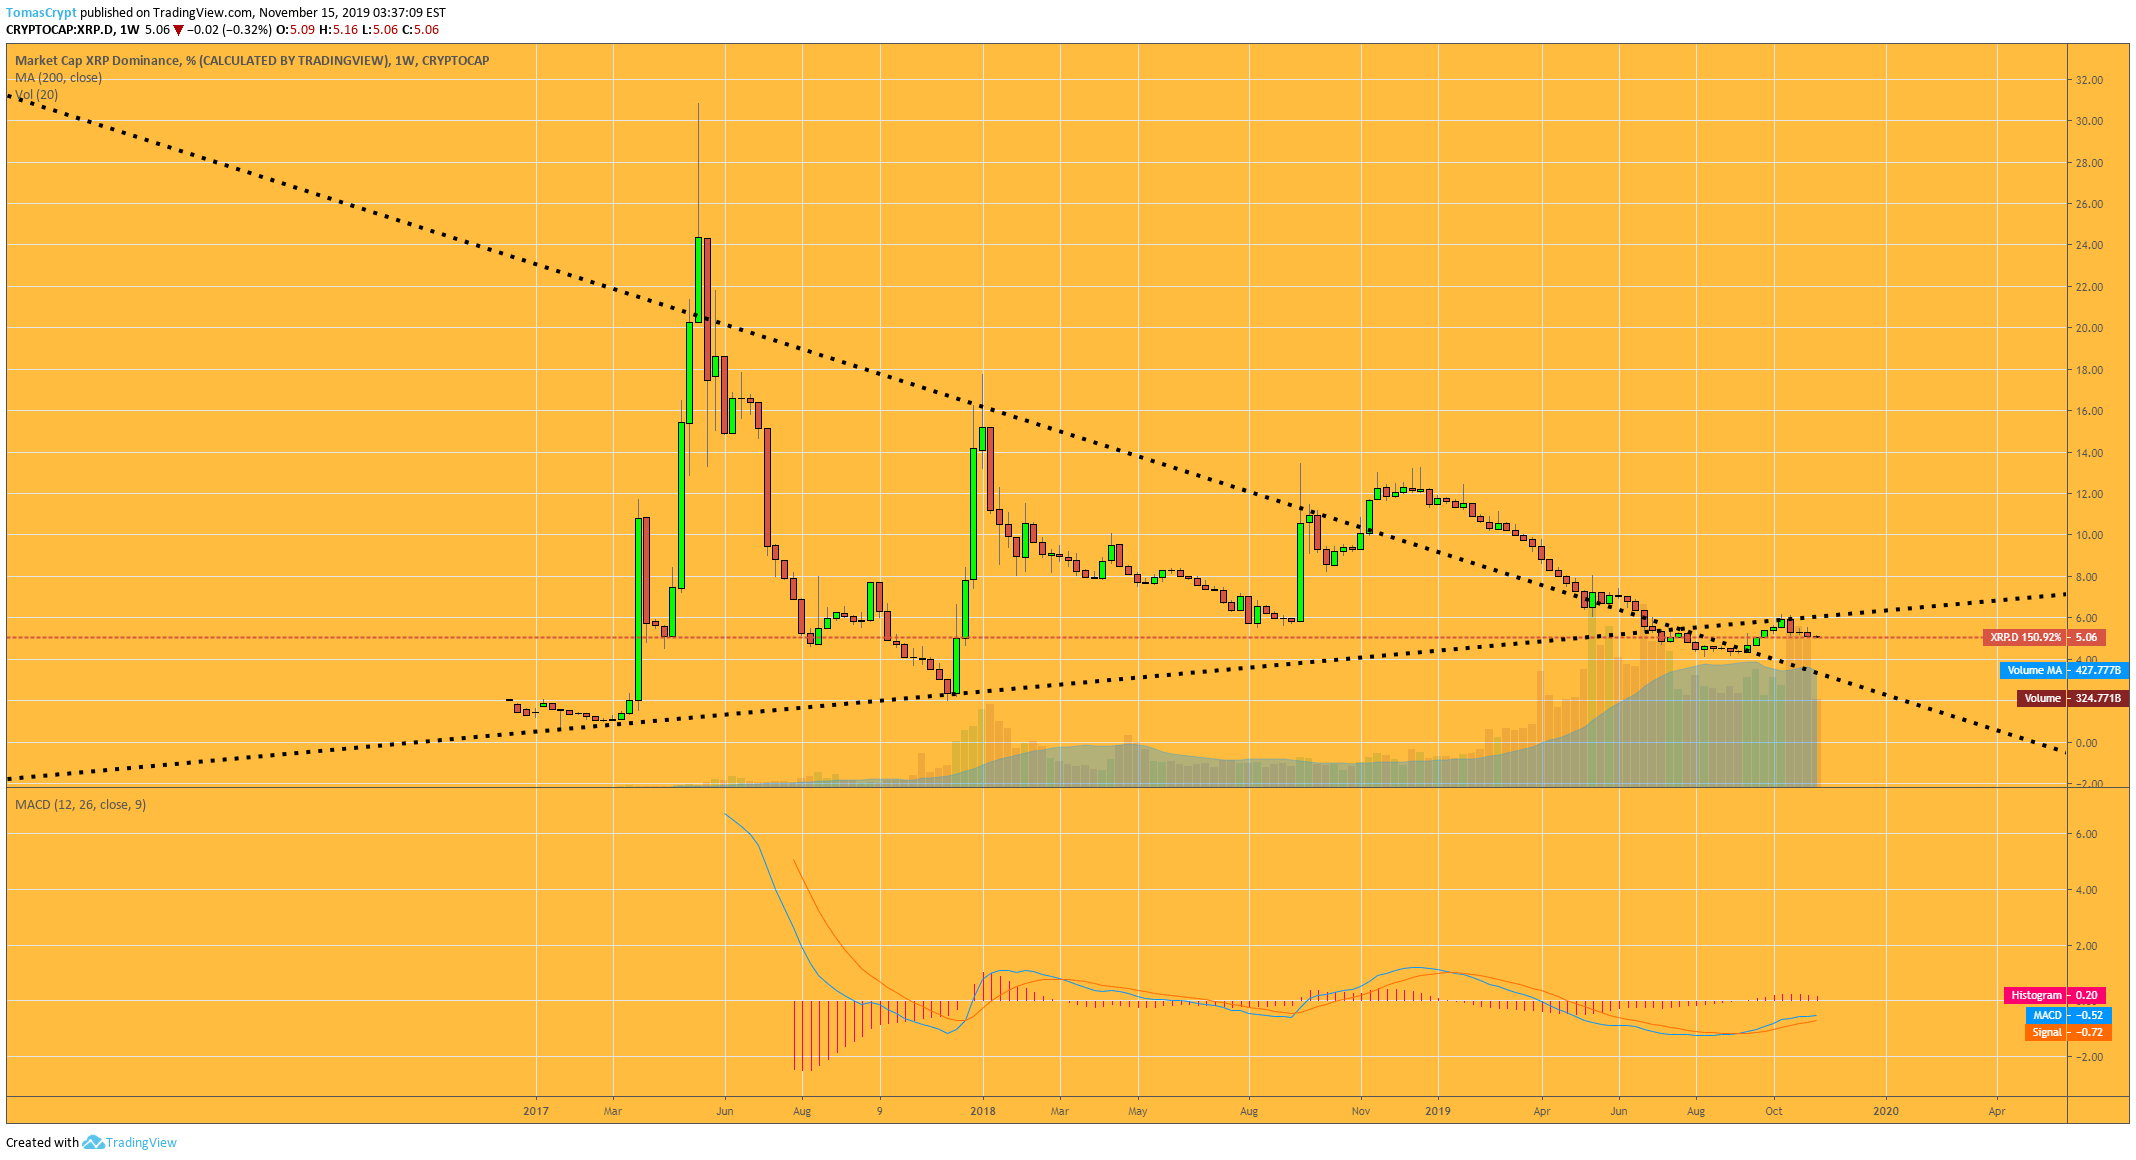 Above the 6.3% dominance level, XRP would enter a bullish quadrant, but as long as this does not occur, the potential for relative value loss beyond other crypto assets is more prominent for the XRP.
The MACD on the weekly chart is crossed bullish but with little upside inclination. The projection is mostly bearish, although the current pattern suggests substantial rises as a less likely development.
ETH/BTC Daily Chart
ETH/BTC is currently trading at 0.0213 and chains two consecutive days of price decline.
Above the current price, the first resistance level is at 0.022, the second at 0.023 and the third one at 0.0234.
Below the current price, the first support level is at 0.0207, the second at 0.020 and the third one at 0.019.
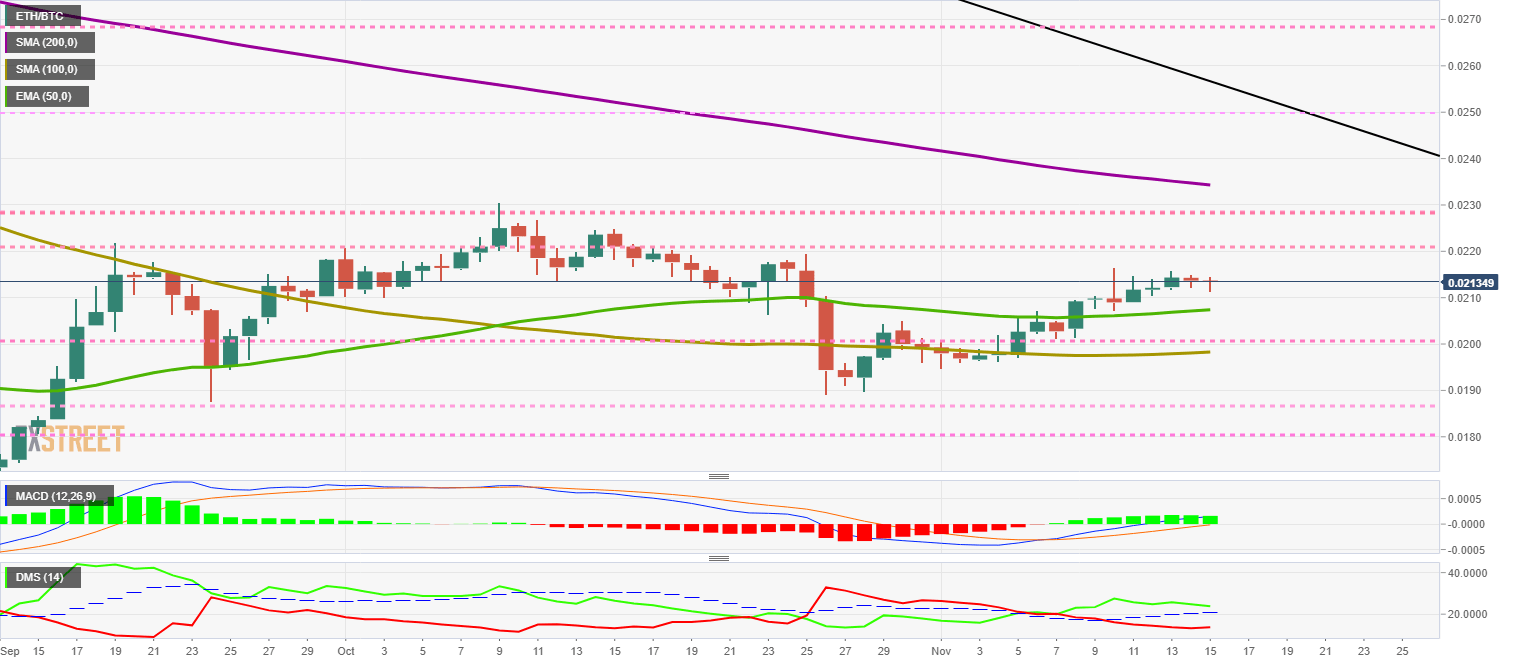
The MACD on the daily chart moves in the middle of an uptrend, but it looks like it can test the zero level from above.
The DMI on the daily chart shows the bulls losing some strength, although they retain a fully bullish structure. The bears react to the upside, but far away from the leadership.
BTC/USD Daily Chart
BTC/USD is currently trading at $8,628 after dropping to the day's low of $8,494. The development towards the end of the year is heavily dependent on what may happen in the next few days.
Above the current price, the first resistance level is at $8,800, the second at $9,200 and the third one at $9,360.
Below the current price, the first support level is at $8,500, the second at $8,150 and the third one at $8,000.
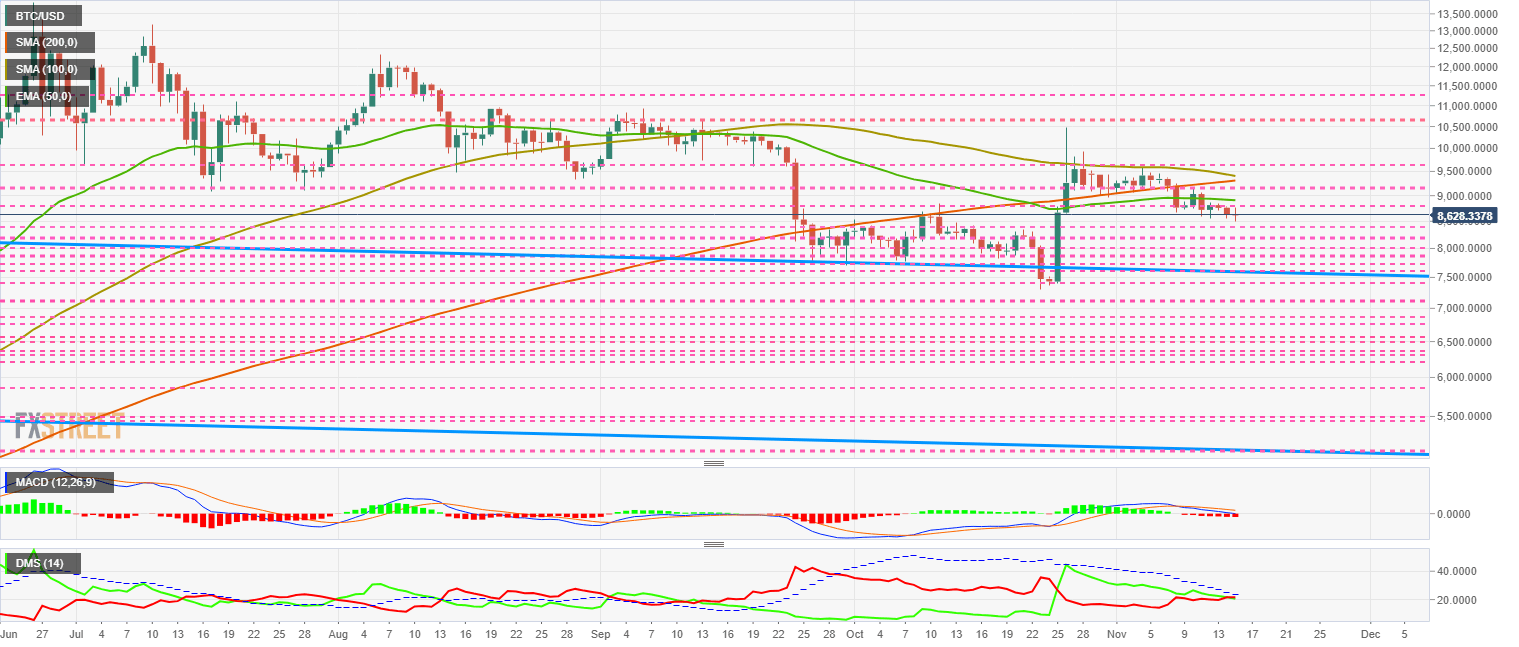
The MACD on the daily chart extends the mild bearish profile of the past few days and keeps a possible bullish rebound scenario active in the short term.
The DMI on the daily chart shows bears gaining the slightest advantage as they advance together against the ADX line. The first of the two sides above the trend strength indicator will dominate the pair for weeks.
ETH/USD Daily Chart
ETH/USD is currently trading at the $183.2 price level and loses support for the EMA50 for the first time in weeks. During the Asian session, the price reached the first support level of $180.
Above the current price, the first resistance level is at $190, the second at $195 and the third one at $200.
Below the current price, the first support level is at $180, then the second at $170 and the third one at $160.
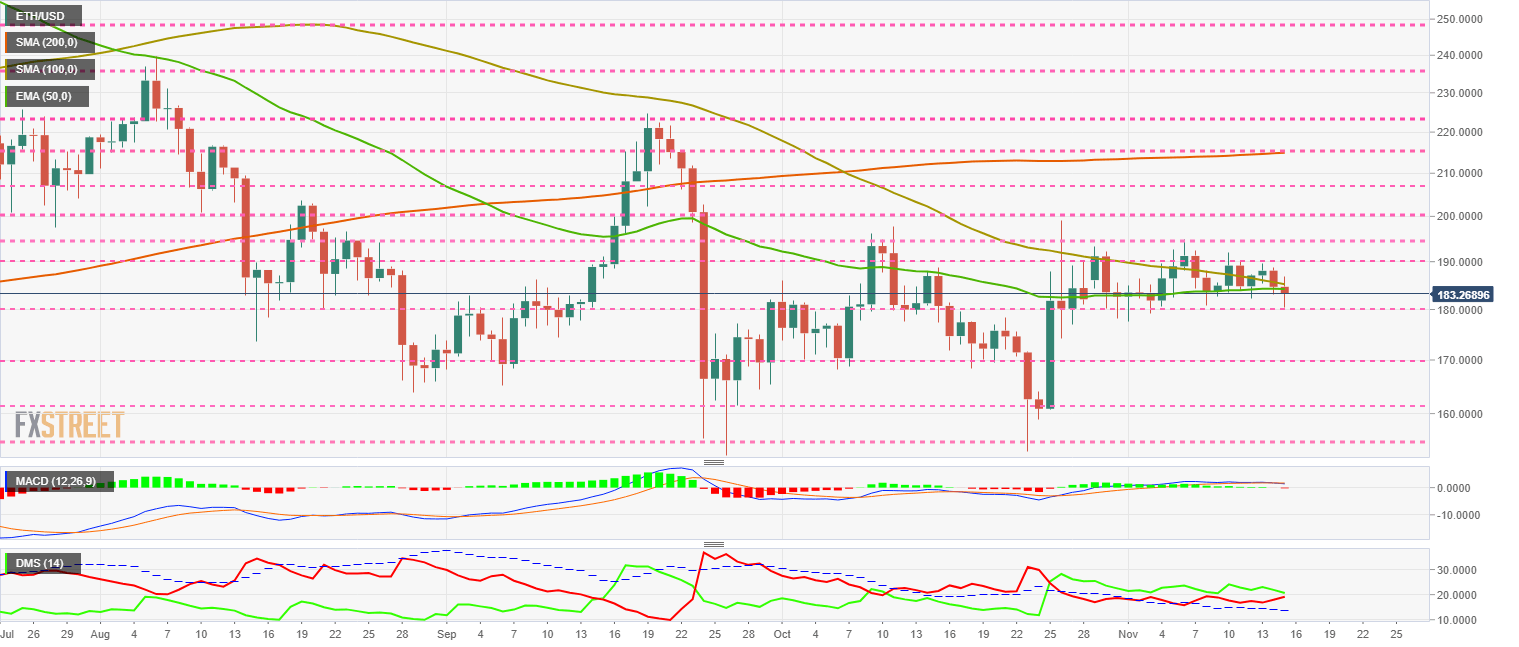
The MACD on the daily chart lacks inclination and openness between the lines. It shows an absolute lack of strength and direction, usually in shallow volatility environments. The exit from this blocking situation can be explosive.
The DMI on the daily chart shows bulls still retaining some advantage over bears. The selling side is moving quickly upwards and may catch up with the bulls in the next few hours.
XRP/USD Daily Chart
XRP/USD is currently trading at $0.266 and chains six trading days of losses. The session low is $0.262.
Above the current price, the first resistance level is at $0.267, then the second at $0.271 and the third one at $0.275.
Below the current price, the first support level is at $0.26, then the second at $0.253 and the third one at $0.24.
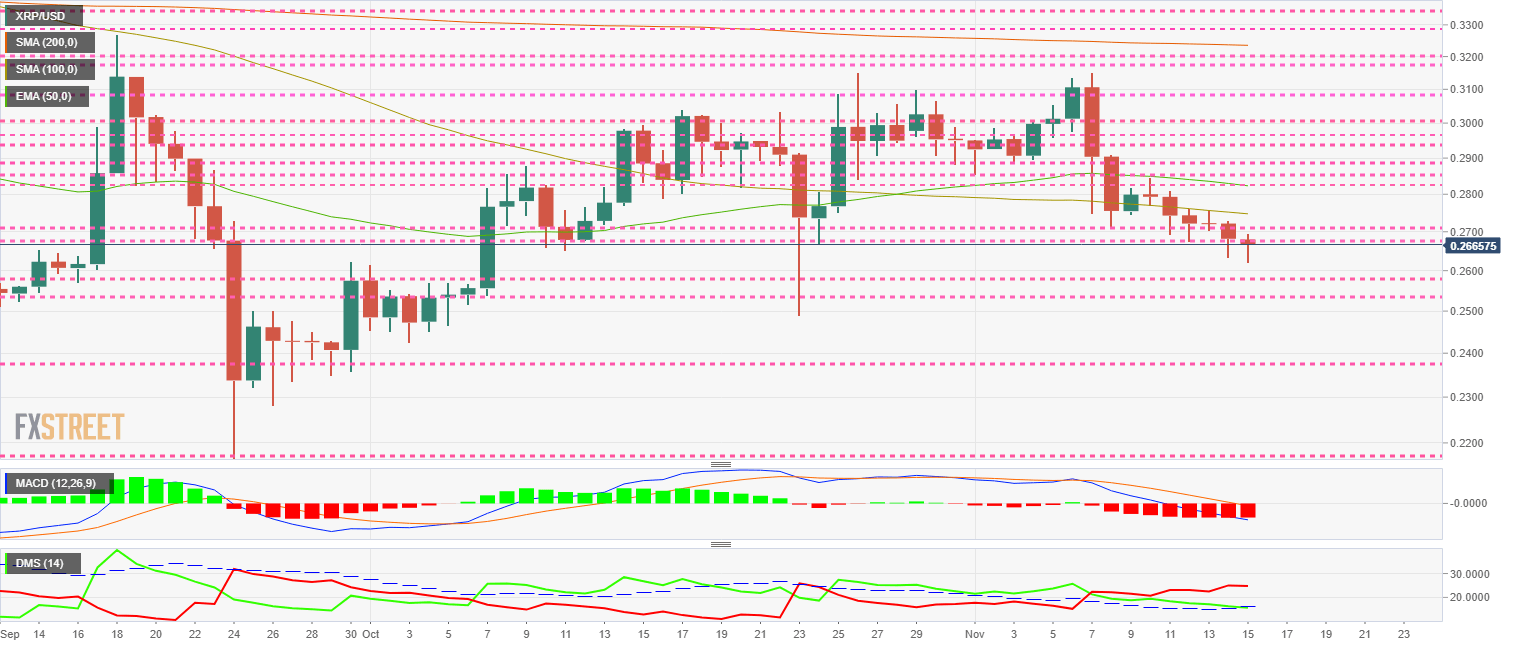
The MACD on the daily chart worsens one more day, leaving as the most likely scenario the continuation of the bearish trend. XRP/USD’s unfortunate timing could even get worse.
The DMI on the daily chart shows how the bulls are losing the support of the ADX line, which means that the bearish momentum could get much worse. The bears have absolute control.
Get 24/7 Crypto updates in our social media channels: Give us a follow at @FXSCrypto and our FXStreet Crypto Trading Telegram channel
Information on these pages contains forward-looking statements that involve risks and uncertainties. Markets and instruments profiled on this page are for informational purposes only and should not in any way come across as a recommendation to buy or sell in these assets. You should do your own thorough research before making any investment decisions. FXStreet does not in any way guarantee that this information is free from mistakes, errors, or material misstatements. It also does not guarantee that this information is of a timely nature. Investing in Open Markets involves a great deal of risk, including the loss of all or a portion of your investment, as well as emotional distress. All risks, losses and costs associated with investing, including total loss of principal, are your responsibility. The views and opinions expressed in this article are those of the authors and do not necessarily reflect the official policy or position of FXStreet nor its advertisers. The author will not be held responsible for information that is found at the end of links posted on this page.
If not otherwise explicitly mentioned in the body of the article, at the time of writing, the author has no position in any stock mentioned in this article and no business relationship with any company mentioned. The author has not received compensation for writing this article, other than from FXStreet.
FXStreet and the author do not provide personalized recommendations. The author makes no representations as to the accuracy, completeness, or suitability of this information. FXStreet and the author will not be liable for any errors, omissions or any losses, injuries or damages arising from this information and its display or use. Errors and omissions excepted.
The author and FXStreet are not registered investment advisors and nothing in this article is intended to be investment advice.
Recommended Content
Editors’ Picks
Vitalik Buterin slams controversial gambling project ZKasino following scam allegations

Ethereum founder Vitalik Buterin took to Warpcaster, a new type of social network, to condemn ZKasino, a decentralized gambling platform based on Layer 2 Ethereum protocol zkSync.
Starknet jumps 2% after notice inviting specific groups to claim STRK airdrop

Starknet Foundation addressed the groups within the STRK community that were unable to receive the token’s airdrop during the first round. The Layer 2 chain organized an airdrop event in February.
XRP price capped at $0.55 despite retail holdings nearing all-time highs

Ripple price (XRP) failed to break resistance at $0.55 early Wednesday as traders continue to digest Ripple’s recent response to the Securities and Exchange Commission’s (SEC) allegations of illegally selling XRP as a security.
Binance founder Changpeng Zhao could face three-year jail time
US prosecutors are requesting Binance founder and former CEO Changpeng Zhao (CZ) to serve a three-year jail time, according to a Reuters report published Wednesday.
Bitcoin: BTC post-halving rally could be partially priced in Premium

Bitcoin (BTC) price briefly slipped below the $60,000 level for the last three days, attracting buyers in this area as the fourth BTC halving is due in a few hours. Is the halving priced in for Bitcoin? Or will the pioneer crypto note more gains in the coming days?