- The U.S. Congress heavily pressures Facebook’s Libra launch.
- This is the legal battle we've all been waiting for.
- The market ignores the threat and continues in a "bullish only" mode.
Americans celebrate becoming independent from the will of the King of England and in the spheres of the political and financial power of the American giant another independence is being questioned.
Five House of Representatives Democrats sent an official letter to the top executives of Facebook, Libra, and Calibra to freeze the implementation of their cryptocurrency project.
In the letter, they adduce a full battery of reasons, according to which Libra could pose a severe risk to the stability of the global financial system and specifically a national security problem for the U.S.
The communiqué uses bleak language. The first sentence demands a moratorium in the implementation of the project. Facebook and Libra have shown their full willingness to talk to regulators and work together on issues such as security, privacy, and financial stability.
Nevertheless, the news has not had an impact on the crypto market. The main assets of the sector continue to develop a consolidation phase while the Altcoin segment led by Ethereum is being configured to start recovering the value lost against Bitcoin.
ETH/BTC Daily Chart
ETH/BTC is quoted at 0.0253 and meets the technical standard that the MACD configuration has indicated. In today's analysis, we will see what this indicator proposes for the weekend.
Above the current price, the first resistance level is at 0.0269 (price congestion resistance), then the second one is at 0.0275 (price congestion resistance) and the third at 0.0292 (price congestion resistance and EMA50).
Below the current price, the first support level is at 0.025 (price congestion support), then the second support level at 0.023, and the third one at 0.0222 (price congestion support).
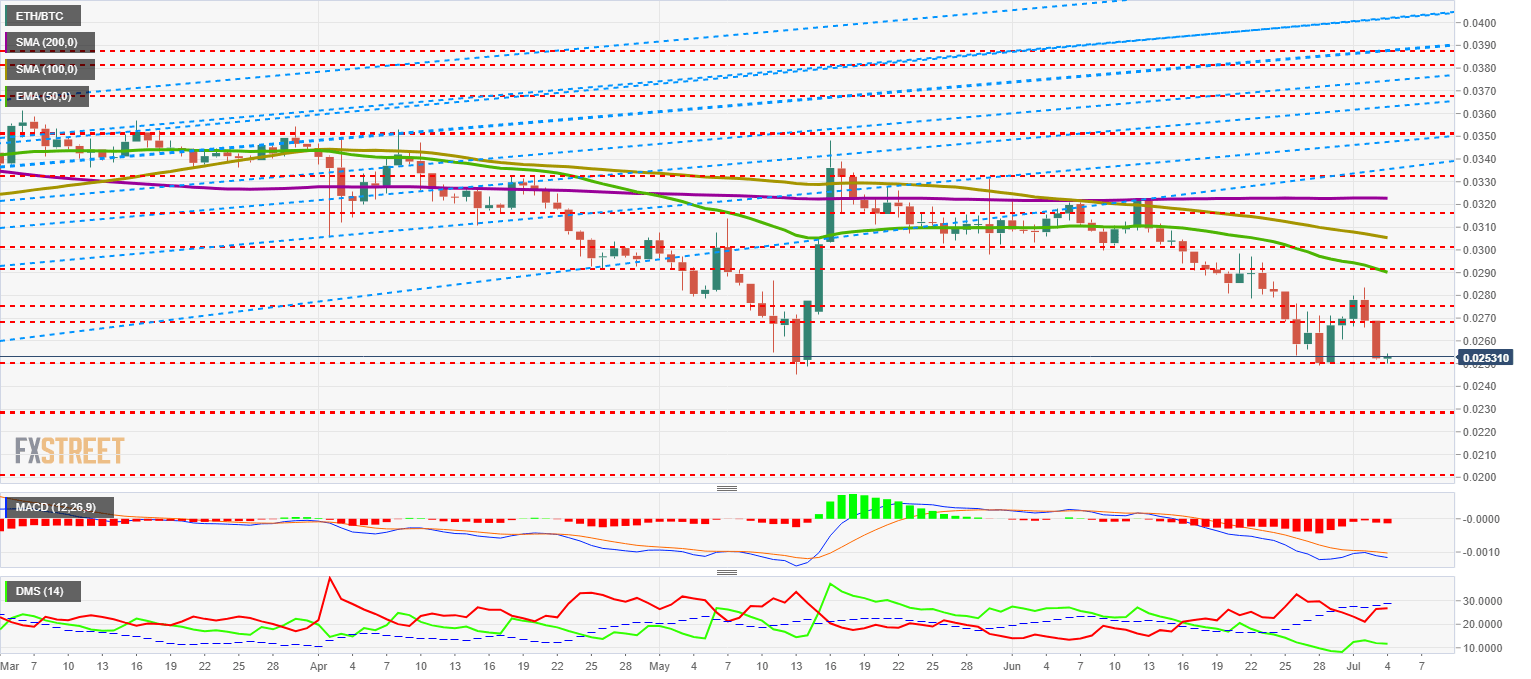
The MACD on the daily chart shows a bullish cross failure setup. This type of structure is followed by a valid bullish cross in a short period.
The DMI on the daily chart also shows a spin setup. The bears, after losing the ADX line have tried to confirm the bearish cross coming from below and should now undertake a path to lower levels while the bulls should take control in the next few days.
BTC/USD Daily Chart
The BTC/USD pair is currently trading at the $11.632 price level and continues to develop a consolidation scenario.
Below the current price, the first resistance level is at the cycle highs of $14,000, then the second is at $17,100 (price congestion resistance), and the third one is at historical highs of $19,690 at the daily close.
Below the current price, the first support level is at $11,250 (price congestion support), then the second at $10,650 (price congestion support) and the third one at $9,675 (price congestion support).
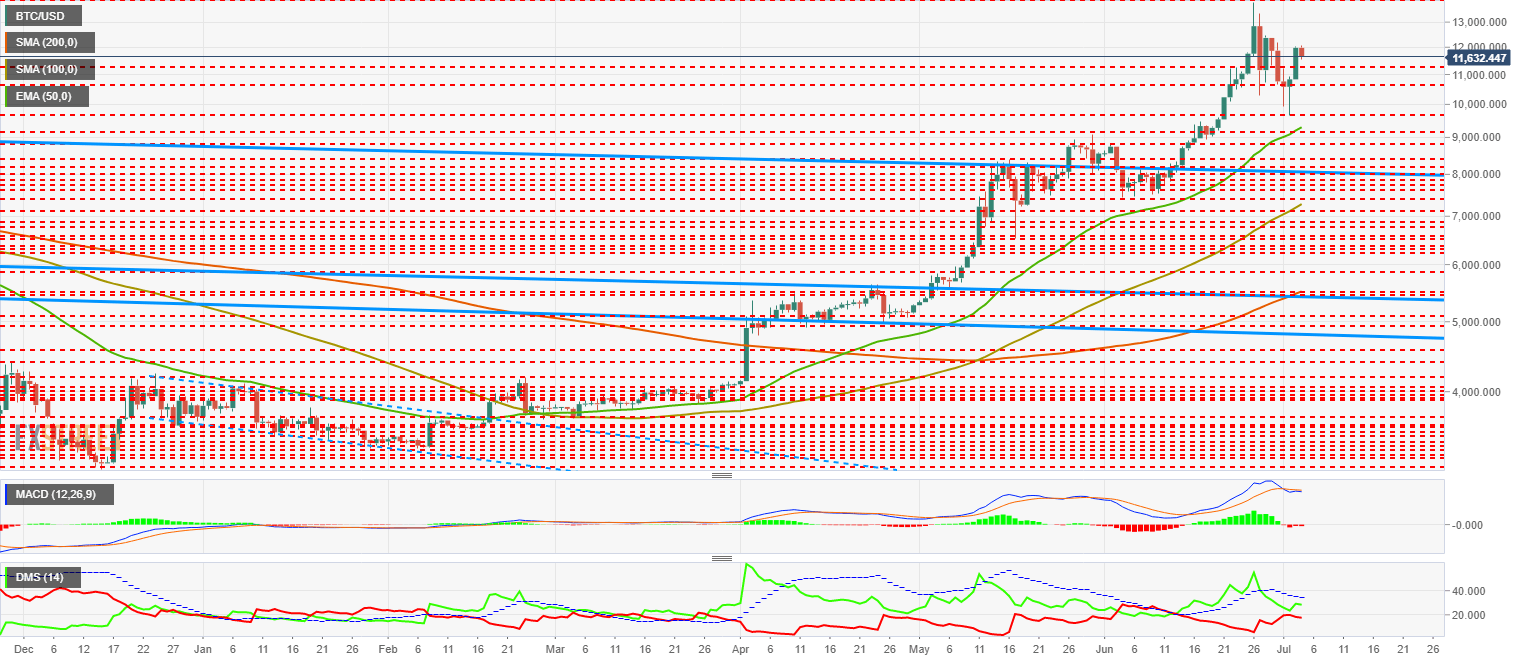
The MACD on the daily chart shows a slightly negative structure. On Wednesday, the indicator tried to cross up again but failed, leaving the lines very close together but crossed down. This type of construction usually develops accelerating the falls.
The DMI in the daily chart shows the bulls keeping in control but with little advantage over the bears. Both are below the ADX line, indicating small trend force on both sides.
ETH/USD Daily Chart
ETH/USD is currently trading at $294.3 and remains above the significant congestion support price at $290.
Above the current price, the first resistance level is at $307 (price congestion resistance), then the second at $317 (price congestion resistance) and the third one at $332 (peak to daily close and price congestion resistance).
Below the current price, the first level of support is at $290 (price congestion support), then the second is at $260 (price congestion support and EMA50), with a drop of more than 10% from the top level. The third one is at $250 (price congestion support).
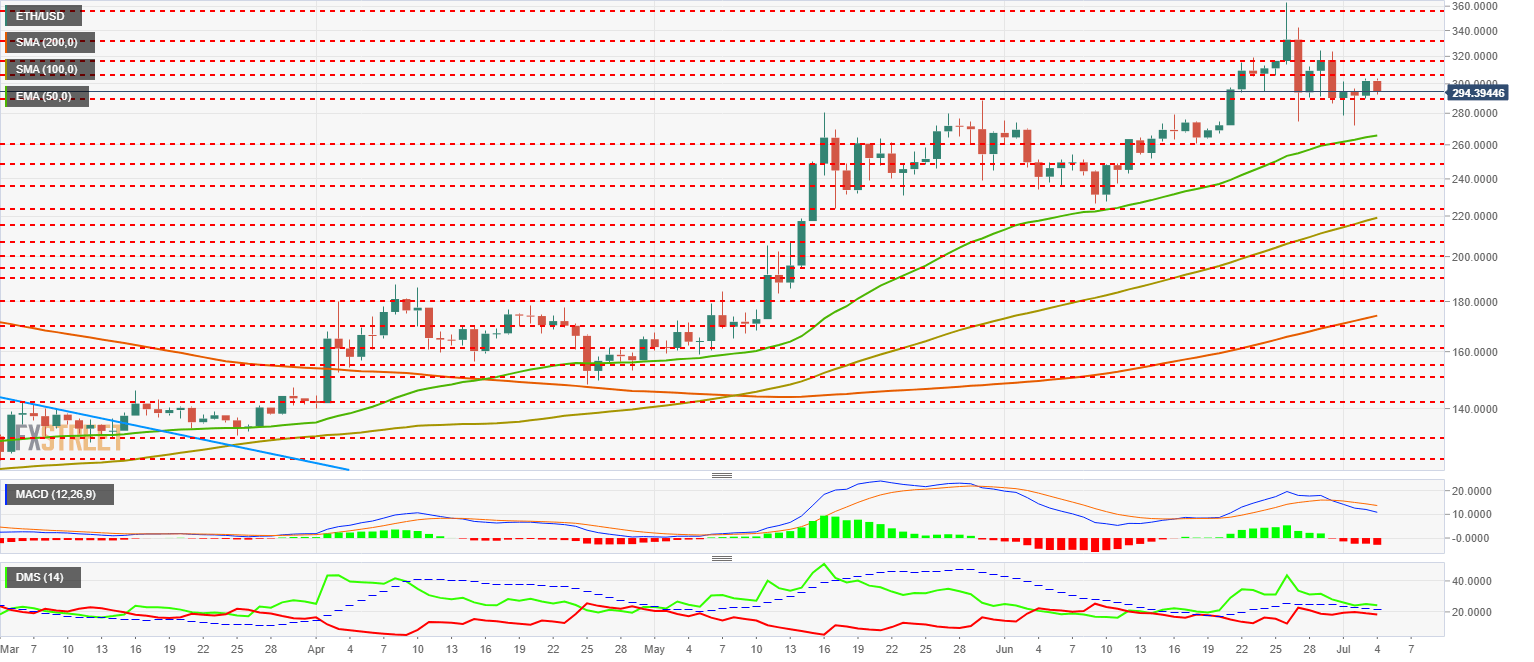
The MACD on the daily chart shows a relatively smooth bearish profile with a little opening between the lines. It is an indefinite structure with a bearish background.
The DMI on the daily chart shows bulls dominating the market but with little advantage over bears. The bulls stay above the ADX line, which would allow them to move quickly upwards if money starts to enter the Ethereum.
XRP/USD Daily Chart
The XRP/USD is currently trading at the $0.393 price level and shows its inability to pass the EMA50 in the last 4 days.
Above the current price, the first resistance level is at $0.41 (EMA50 and price congestion resistance), then the second at $0.413 (price congestion resistance) and the third one at $0.427 (price congestion resistance).
Below the current price, the first level of support is at $0.39 (price congestion support), then the second at $0.368 (double price congestion support and SMA100) and the third one at $0.345 (price congestion support and SMA200).
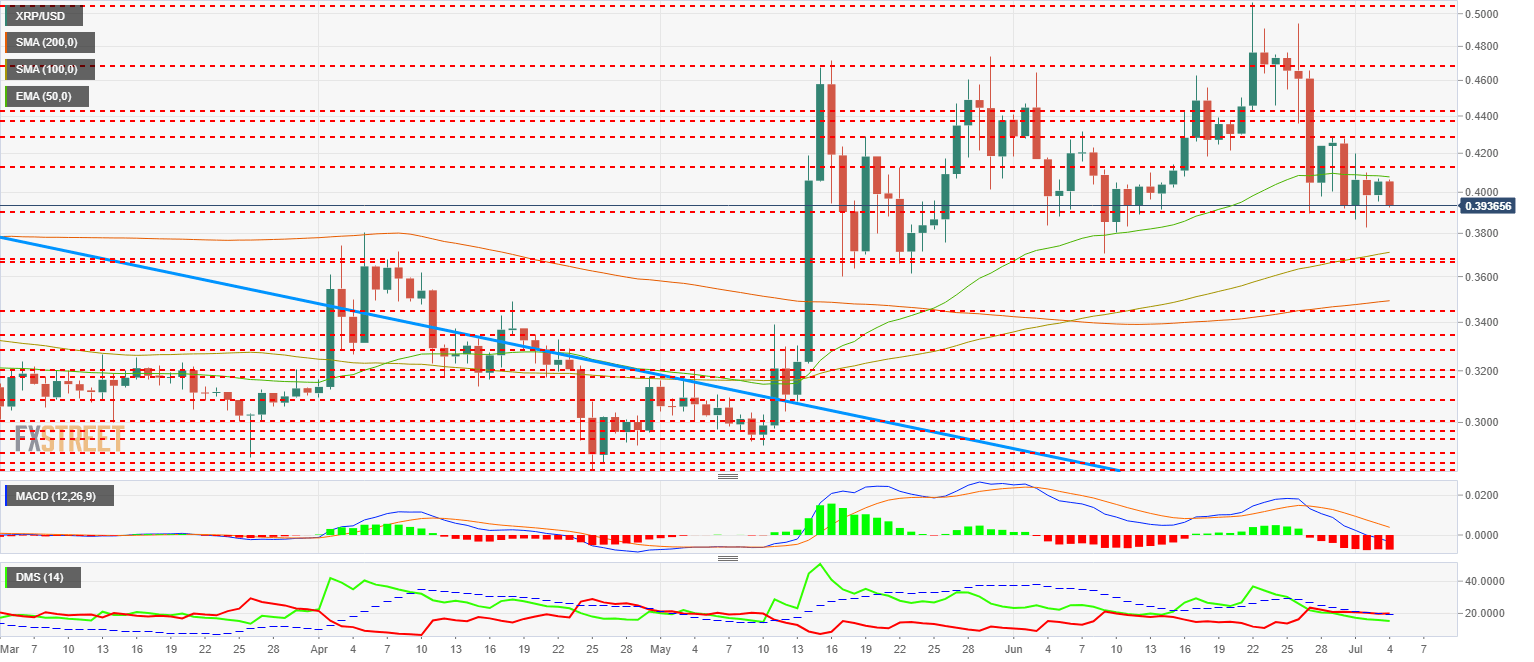
The MACD on the daily chart shows a very advanced profile, with the lines very open and hinting at the desire to cross again. The fast line moves in the negative zone while the slow line moves in the positive territory. This structure can facilitate violent upward movements.
The DMI on the daily chart shows bears narrowly dominating the XRP/USD pair. Sellers move along the ADX line, while bulls follow them closely.
Get 24/7 Crypto updates in our social media channels: Give us a follow at @FXSCrypto and our FXStreet Crypto Trading Telegram channel
Information on these pages contains forward-looking statements that involve risks and uncertainties. Markets and instruments profiled on this page are for informational purposes only and should not in any way come across as a recommendation to buy or sell in these assets. You should do your own thorough research before making any investment decisions. FXStreet does not in any way guarantee that this information is free from mistakes, errors, or material misstatements. It also does not guarantee that this information is of a timely nature. Investing in Open Markets involves a great deal of risk, including the loss of all or a portion of your investment, as well as emotional distress. All risks, losses and costs associated with investing, including total loss of principal, are your responsibility. The views and opinions expressed in this article are those of the authors and do not necessarily reflect the official policy or position of FXStreet nor its advertisers. The author will not be held responsible for information that is found at the end of links posted on this page.
If not otherwise explicitly mentioned in the body of the article, at the time of writing, the author has no position in any stock mentioned in this article and no business relationship with any company mentioned. The author has not received compensation for writing this article, other than from FXStreet.
FXStreet and the author do not provide personalized recommendations. The author makes no representations as to the accuracy, completeness, or suitability of this information. FXStreet and the author will not be liable for any errors, omissions or any losses, injuries or damages arising from this information and its display or use. Errors and omissions excepted.
The author and FXStreet are not registered investment advisors and nothing in this article is intended to be investment advice.
Recommended Content
Editors’ Picks
Why crypto may see a recovery right before or shortly after Bitcoin halving

Cryptocurrency market is bleeding, with Bitcoin price leading altcoins south in a broader market crash. The elevated risk levels have bulls sitting on their hands, but analysts from Santiment say this bleed may only be cauterized right before or shortly after the halving.
Manta Network price braces for volatility as $44 million worth of MANTA is due to flood markets

Manta Network (MANTA) price was not spared from the broader market crash instigated by a weakness in the Bitcoin (BTC) market. While analysts call a bottoming out in the BTC price, the Web3 modular ecosystem token could suffer further impact.
Bitcoin price uptrend to continue post-halving, Bernstein report says as traders remain in disarray

Bitcoin is dropping amid elevated risk levels in the market. It comes as traders count hours to the much-anticipated halving event. Amid the market lull, experts say we may not see a rally until after the halving.
OMNI post nearly 50% loss after airdrop and exchange listing

Omni network (OMNI) lost nearly 50% of its value on Wednesday after investors dumped the token following its listing on top crypto exchanges. A potential reason for the crash may be due to the wider crypto market slump.
Bitcoin: BTC’s rangebound movement leaves traders confused

Bitcoin (BTC) price has been hovering around the $70,000 psychological level for a few weeks, resulting in a rangebound movement. This development could lead to a massive liquidation on either side before a directional move is established.