- Visa overestimates its power and plans to leave Libra without closing the door.
- XRP can lead the market in the coming weeks.
- Bitcoin's lack of tone weighs on Ethereum's mood.
The Libra project led by Facebook remains on track despite the first defections. Those who have abandoned the project are mostly payment gateways.
VISA Inc. explained its abandonment. The company said:
Visa has decided not to join the Libra Association at this time. We will continue to evaluate, and our ultimate decision will be determined by a number of factors, including the Association's ability to fully satisfy all requisite regulatory expectations.
And it continues:
Visa's continued interest in Libra stems from our belief that well-regulated blockchain-based networks could extend the value of secure digital payments to a greater number of people and places, particularly in emerging and developing markets.
I am perplexed, for moments admired of the transparency. In the statement, VISA has no problem admitting that if the project ends up working and circumventing regulatory issues, it could rejoin the project.
Despite this, the project goes ahead. On Monday, the first session of the governance committee was held in Geneve. It was agreed to address the regulatory challenges, starting with Facebook CEO Mark Zuckerberg's statement to the American Congress next week.
The market shrugs off this news and continues to develop the scenarios as they pointed out.
As XRP leads the bullish side of the market, Ethereum gains ground against Bitcoin.
The King suffers from its inability to overcome the 200 Simple Moving Average that prevents it from extending its bullish development.
ETH/BTC Daily Chart
The ETH/BTC pair remains above the 0.0221 support level but is unable to overcome resistance at 0.023, which would open up clean space to 0.025.
As a support, the first support level is fragile at 0.0221, although the presence of the 100 SMA and the 50 Exponential Moving Average above the 0.020 level provides significant strength.
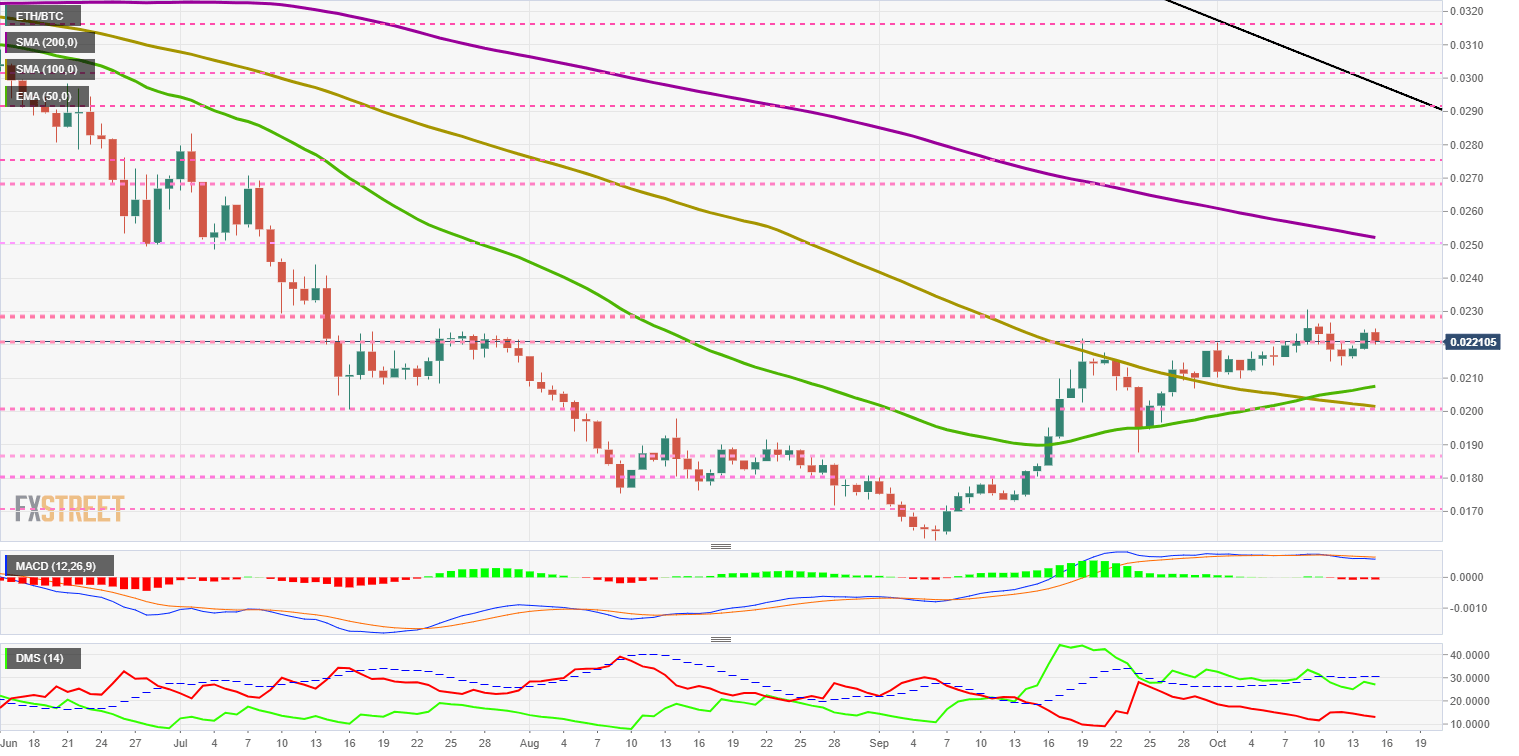
The MACD on the daily chart continues to cross downward as it hints at a possible increase in line spacing. If the lines spread further, the declines would accelerate, and a support test at 0.020 would be almost inevitable.
The DMI on the daily chart shows the bulls on in the lead but below the ADX line. This situation weakens the upside potential. The bears, on the other hand, do not seem interested in fighting for the leadership of the pair and continues to decline slightly.
BTC/USD Daily Chart
BTC/USD is trading at $8.280 after being unable to close above $8.400 in the last four days.
If it manages to outperform it, Bitcoin will face two significant resistances. The first at $8,780, the confluence level of the SMA200 and resistance to price congestion, then the second at $9,150 although in this case, the confluence forms the EMA50.
On the support side, the level to watch is $7,700, although, before this critical level, there are up to 5 levels of support. The first support is at $8,159, then the second at $8,000 and the third one at $7,875.
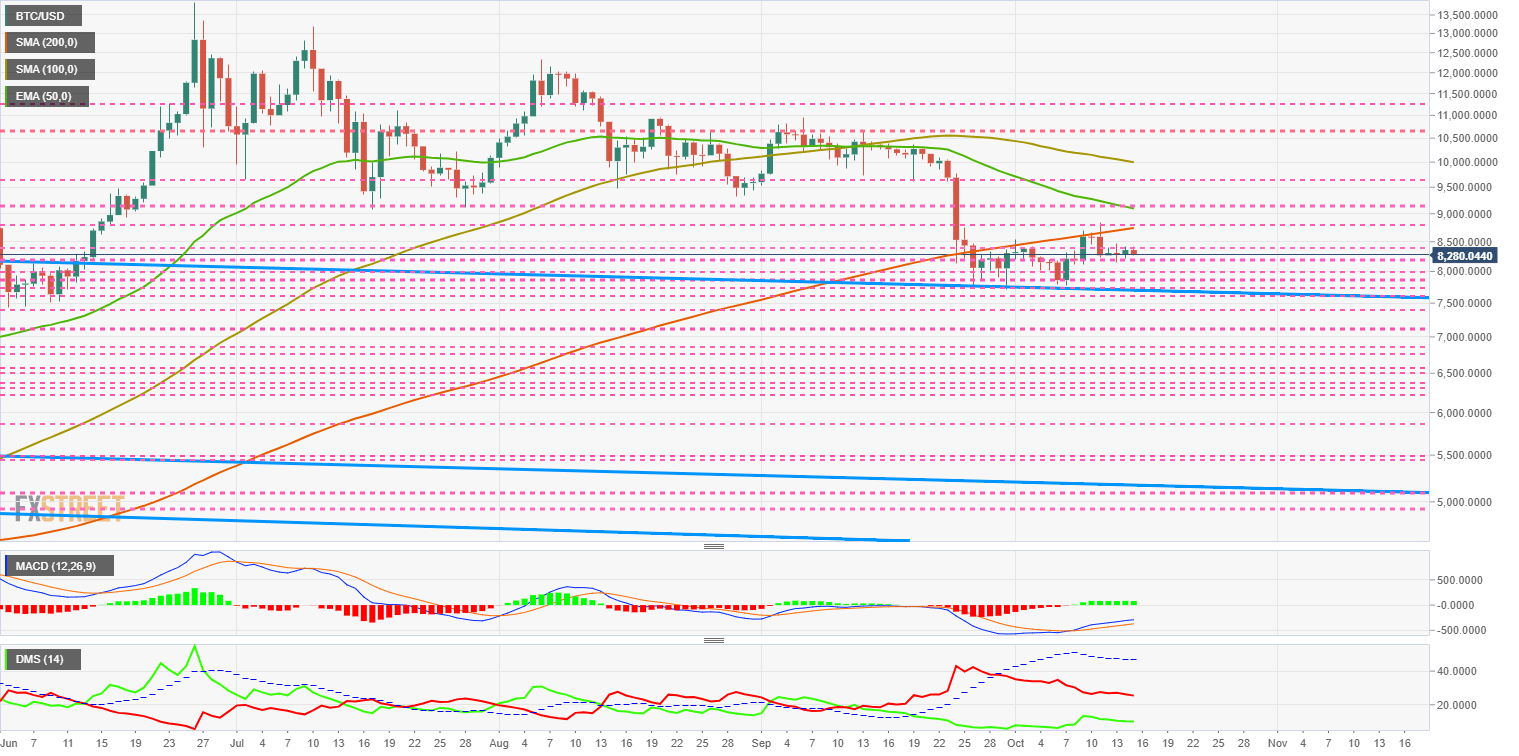
The MACD on the daily chart shows a profile that proposes short term gains. The problem seems to be the strong resistance of the leading moving averages.
The DMI on the daily chart shows how both bulls and bears decrease their trend strength. The seller side retains a good advantage over the buyer side. The ADX remains at high levels despite the immobility of the price, still living from the strong movements of a few weeks ago.
ETH/USD Daily Chart
The ETH/USD is trading at $182.79 after failing to pass the EMA50 by $187.4. The critical support level is at $180.
Above the exponential average, the ETH/USD has an important resistance level at $190 and the third one at $195.
Below the key support at $180, then the second support level at $170 and the third one at $161.
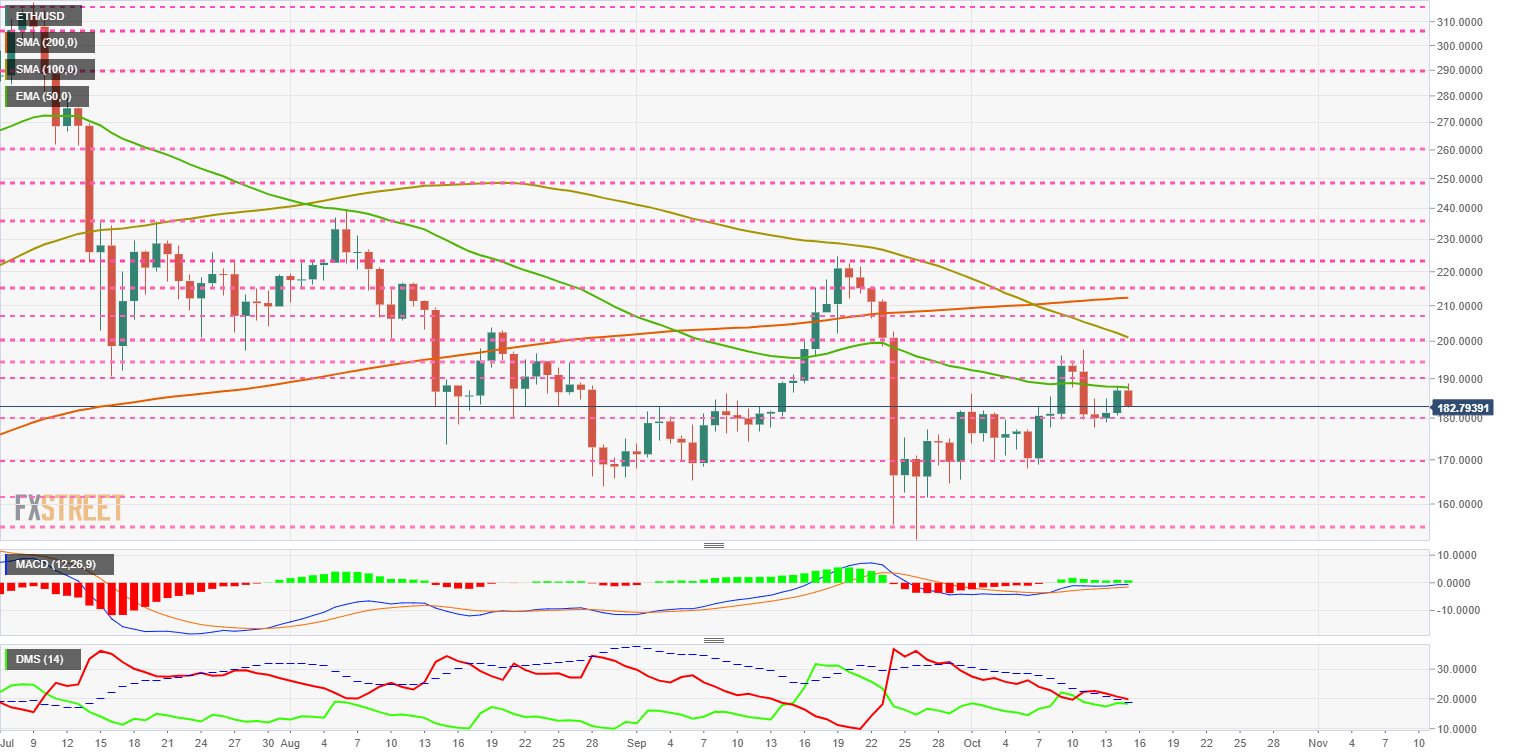
The MACD on the daily chart compresses when it reaches the neutral level of the indicator and jeopardizes the continuation of the bullish trend.
The DMI on the daily chart shows a tie between the two sides of the market. The bears are positioned for victory, but the closeness between the two sides makes any short term scenario possible.
XRP/USD Daily Chart
XRP/USD is trading at $0.290 after failing to break above the $0.30 level. At the $0.285 level enjoy reliable support as the SMA100 meets price congestion support.
Above $0.30, the next resistance level is $0.31, and the third one is $0.318.
Below $0.285, the second support level is at $0.281 and the third one at $0.271.
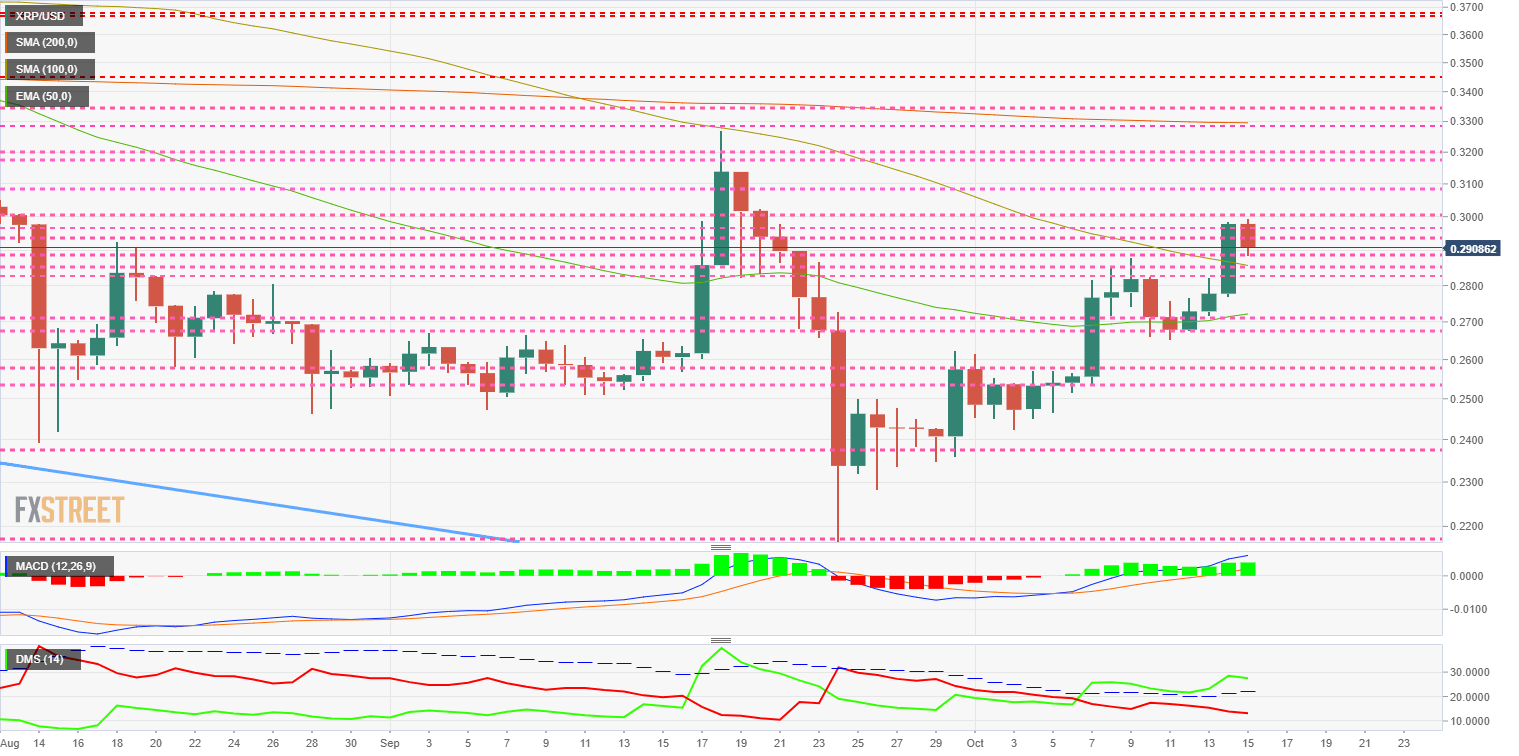
The MACD on the daily chart shows a firm profile. Moving averages are strongly inclined to the upside and with full separation between them.
The DMI on the daily chart also shows a robust bullish profile. Bulls lead the pair and move freely above the ADX line. The bulls, on the other hand, continue their descent, giving even more strength to the bullish moment of the XRP.
Get 24/7 Crypto updates in our social media channels: Give us a follow at @FXSCrypto and our FXStreet Crypto Trading Telegram channel
Information on these pages contains forward-looking statements that involve risks and uncertainties. Markets and instruments profiled on this page are for informational purposes only and should not in any way come across as a recommendation to buy or sell in these assets. You should do your own thorough research before making any investment decisions. FXStreet does not in any way guarantee that this information is free from mistakes, errors, or material misstatements. It also does not guarantee that this information is of a timely nature. Investing in Open Markets involves a great deal of risk, including the loss of all or a portion of your investment, as well as emotional distress. All risks, losses and costs associated with investing, including total loss of principal, are your responsibility. The views and opinions expressed in this article are those of the authors and do not necessarily reflect the official policy or position of FXStreet nor its advertisers. The author will not be held responsible for information that is found at the end of links posted on this page.
If not otherwise explicitly mentioned in the body of the article, at the time of writing, the author has no position in any stock mentioned in this article and no business relationship with any company mentioned. The author has not received compensation for writing this article, other than from FXStreet.
FXStreet and the author do not provide personalized recommendations. The author makes no representations as to the accuracy, completeness, or suitability of this information. FXStreet and the author will not be liable for any errors, omissions or any losses, injuries or damages arising from this information and its display or use. Errors and omissions excepted.
The author and FXStreet are not registered investment advisors and nothing in this article is intended to be investment advice.
Recommended Content
Editors’ Picks
Ethereum dips slightly amid Renzo depeg, BlackRock spot ETH ETF amendment

Ethereum (ETH) suffered a brief decline on Wednesday afternoon despite increased accumulation from whales. This follows Ethereum restaking protocol Renzo restaked ETH (ezETH) crashing from its 1:1 peg with ETH and increased activities surrounding spot Ethereum ETFs.
Injective price weakness persists despite over 5.9 million INJ tokens burned
Injective (INJ) price is trading with a bearish bias, stuck in the lower section of the market range. The bearish outlook abounds despite the network's deflationary efforts to pump the price. Coupled with broader market gloom, INJ token’s doomed days may not be over yet.
US intensifies battle against crypto privacy protocols following crackdown on Samourai Wallet

CEO Keonne Rodriguez and CTO William Lonergan of Samourai Wallet were arrested by the US Department of Justice (DoJ) on Wednesday and charged with $100 million in money laundering on a count and illegal money transmitting on another count. This move could see privacy-focused cryptocurrencies take a dip.
Near Protocol Price Prediction: NEAR fulfills targets but a 10% correction may be on the horizon
Near Protocol price has completed a 55% mean reversal from the bottom of the market range at $4.27. Amid growing bearish activity, NEAR could drop 10% to the $6.00 psychological level before a potential recovery. A break and close above $7.95 would invalidate the downleg thesis.
Bitcoin: BTC post-halving rally could be partially priced in Premium

Bitcoin (BTC) price briefly slipped below the $60,000 level for the last three days, attracting buyers in this area as the fourth BTC halving is due in a few hours. Is the halving priced in for Bitcoin? Or will the pioneer crypto note more gains in the coming days?