- ETH begins to be attractive in comparison to BTC.
- XRP offers good prices for the more adventurous kind.
- Discipline and a plan of action are vital now.
We come to the end of the analysis week, and the Crypto market accelerates the reversal and consolidation process that started last week. The bullish green dominated yesterday at the end of the US session in a typical bearish break confirmation move. Once the price verified that it could not recover the lost support lines, the sales accelerated and quickly went to look for the lower support levels.
The market is approaching a possible rotation point towards Ethereum. As we will see below, it is a scenario with risks, but that can be very beneficial in the medium term.
ETH/BTC 4 Hours Chart
The ETH/BTC pair is currently trading at the price level of 0.029 after yesterday's loss of support at 0.0302 and is moving further away from the structure of the parallel bullish trend lines that have steered the price since December.
As we will see from the MACD, the pair is entering a scenario of a possible bullish turn. This type of situation implies more risk as volatility tends to increase, but if managed with patience and determination, it tends to give excellent returns.
Above the current price, the first resistance level is at 0.031 (price congestion resistance), then the second resistance level is at 0.0315 (price congestion resistance). The third resistance level for the ETH/BTC pair is at 0.032 (lower parallel bullish trend line).
Below the current price, the first support level is at 0.0275 (price congestion support), then the second support level is at 0.0268 (price congestion support).
-636918719957264152.png)
The MACD on the four-hour chart shows a typical pattern of a pre-cross bullish scenario. It is a risky scenario as it usually brings with it an increase in volatility and the taking of positions generates stressful moments for the trader.
The DMI on the four-hour chart shows the bears already completely below the ADX line while the bulls are at minimum levels conducive to a bullish rebound.
BTC/USD 4 Hour Chart
The BTC/USD pair is currently trading at $5,185 after testing the lost support at $5,500 (price congestion resistance). The drop to the current level has been rapid and pierced the EMA50 and the SMA100.
Above the current price, the first resistance level is formed by the confluence of the EMA50 and the SAM100 at $5,233 and $5,333 respectively. The second resistance level for the BTC/USD pair is at $5,500 (price congestion resistance), then the third resistance level is at $6,300 (price congestion resistance).
Below the current price, the first support level is at $5,100 (price congestion support), then the second support level is at $4,860 (SMA200). The third level of support for the BTC/USD pair is at $4,580 (price congestion support).
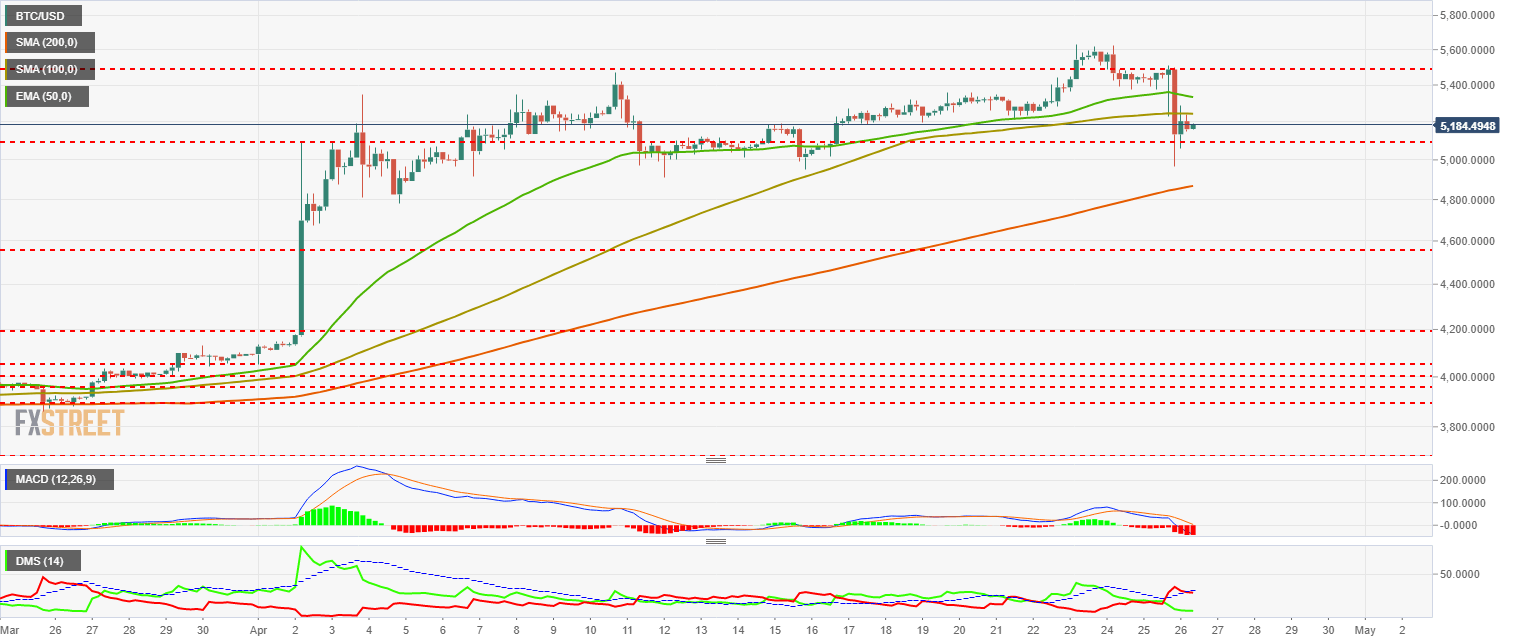
The MACD on the four-hour chart shows how the lines react to the downturn with a strong downtrend and large openings between the lines. The movement is so exaggerated that it can cause a rebound counter movement.
The DMI on the four-hour chart shows how bears dominate the pair but fail to move above the ADX line, which is a sign of weakness to watch out for.
ETH/USD 4 Hour Chart
ETH/USD is trading at $154 following the early morning Asian trading session. In the fall, ETH/USD loses the support of all moving averages and enters into a more negative scenario.
Above the current price, the first resistance level is at $162 (price congestion resistance and SMA200). The second resistance level is at $168 (SMA200 and EMA50). Then the third resistance level for ETH/USD is at $180 (price congestion resistance).
Below the current price, the first support level is $151 (price congestion support). The second support level is at $142.5 (price congestion support), so the third support level is at $131 (price congestion support).
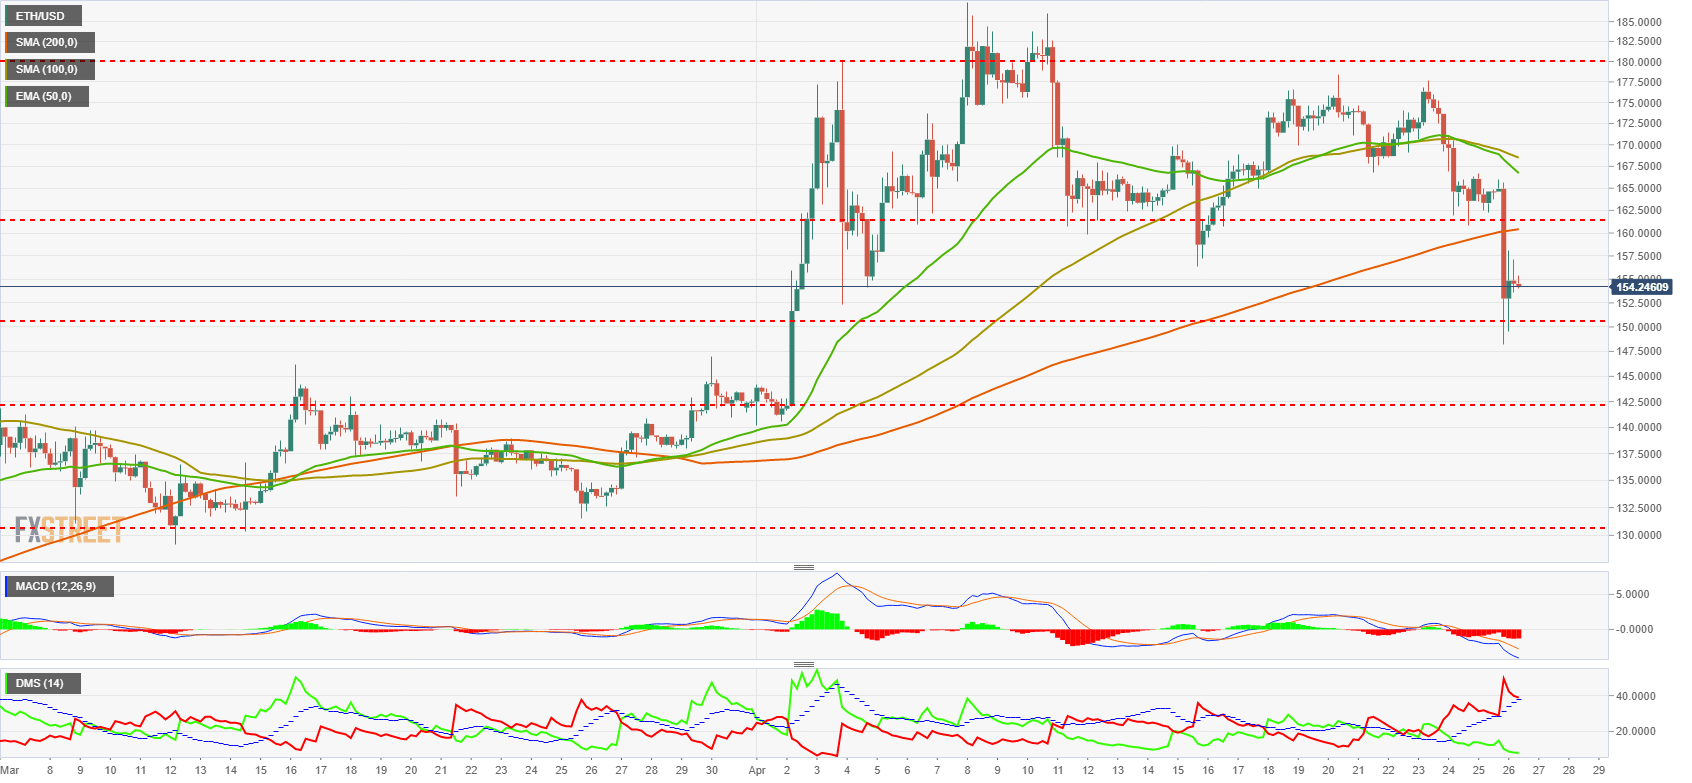
The MACD on the four-hour chart shows moving averages with a significant bearish slope and considerable openness between lines. It is a scenario in which bearish continuity is most likely.
The DMI on the four-hour chart shows an extreme situation, with bears with absolute control and above the ADX. On the opposite side, the bulls are at extreme minimum levels. It is a scenario that will tend more to a return to averages than to continue in extremes.
XRP/USD 4 Hour Chart
XRP/USD is trading at the $0.292 price level after a new downtrend following the general market behavior.
Above the current price, the first resistance level is at $0.293 (price congestion resistance). The second resistance level for the XRP/USD pair is $0.30 (price congestion resistance), then the third resistance level is $0.3175 (EMA50 and price congestion resistance).
Below the current price, the first support level is $0.288 (price congestion support), then the second support level is $0.285 (price congestion support). The third level of support for the XRP/USD pair is $0.282 (price congestion support).
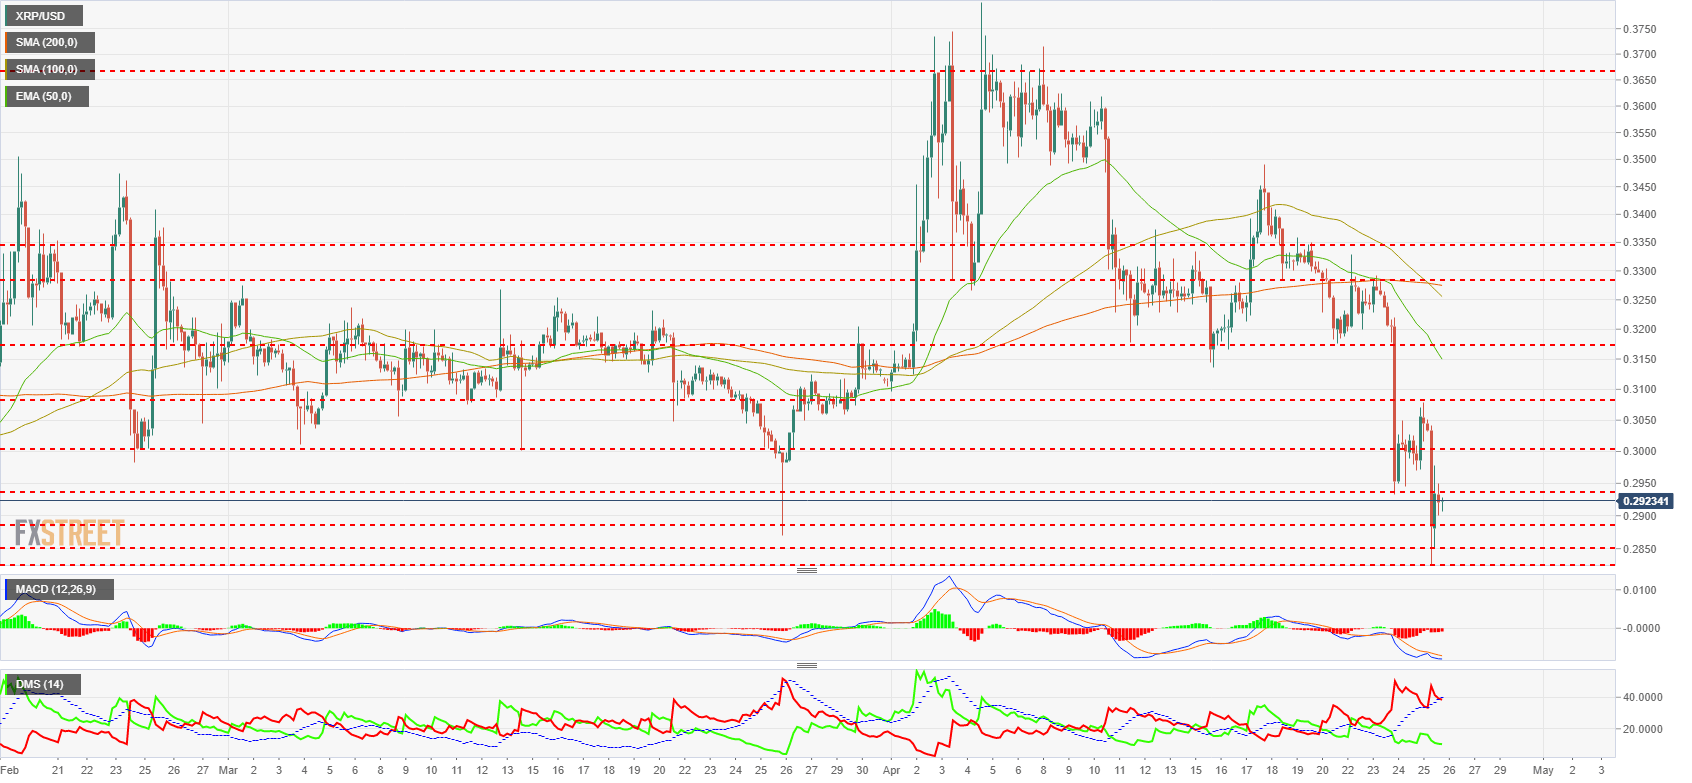
The MACD on the four-hour chart shows a bullish cross profile in the process, very similar to the structure of the ETH/BTC pair. More experienced traders will find the timing interesting for bullish entries.
The DMI on the four-hour chart shows bears dominating the situation but in a very advanced structure and entering a phase of change. Bulls are at minimum levels, and this may help a possible turn in the next few days.
Get 24/7 Crypto updates in our social media channels: Give us a follow at @FXSCrypto and our FXStreet Crypto Trading Telegram channel
Information on these pages contains forward-looking statements that involve risks and uncertainties. Markets and instruments profiled on this page are for informational purposes only and should not in any way come across as a recommendation to buy or sell in these assets. You should do your own thorough research before making any investment decisions. FXStreet does not in any way guarantee that this information is free from mistakes, errors, or material misstatements. It also does not guarantee that this information is of a timely nature. Investing in Open Markets involves a great deal of risk, including the loss of all or a portion of your investment, as well as emotional distress. All risks, losses and costs associated with investing, including total loss of principal, are your responsibility. The views and opinions expressed in this article are those of the authors and do not necessarily reflect the official policy or position of FXStreet nor its advertisers. The author will not be held responsible for information that is found at the end of links posted on this page.
If not otherwise explicitly mentioned in the body of the article, at the time of writing, the author has no position in any stock mentioned in this article and no business relationship with any company mentioned. The author has not received compensation for writing this article, other than from FXStreet.
FXStreet and the author do not provide personalized recommendations. The author makes no representations as to the accuracy, completeness, or suitability of this information. FXStreet and the author will not be liable for any errors, omissions or any losses, injuries or damages arising from this information and its display or use. Errors and omissions excepted.
The author and FXStreet are not registered investment advisors and nothing in this article is intended to be investment advice.
Recommended Content
Editors’ Picks
SEC doubles down on TRON's Justin Sun lawsuit dismissing claims over jurisdiction

The SEC says it has jurisdiction to bring Justin Sun to court as he traveled extensively to the US. Sun asked to dismiss the suit, arguing that the SEC was targeting actions taken outside the US.
XRP fails to break past $0.50, posting 20% weekly losses

XRP trades range-bound below $0.50 for a sixth consecutive day, accumulating 20% losses in the last seven days. Ripple is expected to file its response to the SEC’s remedies-related opening brief by April 22.
ImmutableX extends recovery despite $69 million IMX token unlock
ImmutableX unlocked 34.19 million IMX tokens worth over $69 million early on Friday. IMX circulating supply increased over 2% following the unlock. The Layer 2 blockchain token’s price added nearly 3% to its value on April 19.
Bitcoin Weekly Forecast: BTC post-halving rally could be partially priced in Premium

Bitcoin price briefly slipped below the $60,000 level for the last three days, attracting buyers in this area as the fourth BTC halving is due in a few hours. Is the halving priced in for Bitcoin? Or will the pioneer crypto note more gains in the coming days?
Bitcoin: BTC post-halving rally could be partially priced in Premium
Bitcoin (BTC) price briefly slipped below the $60,000 level for the last three days, attracting buyers in this area as the fourth BTC halving is due in a few hours. Is the halving priced in for Bitcoin? Or will the pioneer crypto note more gains in the coming days?