- Thursday’s low in BTC/USD marks the limit for both tragedy and opportunity.
- The ETH/BTC cross leads the way with three consecutive days of gains.
- XRP resists the massacre and improves its technical setup.
Thursday saw cryptos in the red at the close of the European session. The drop led Bitcoin to shed the significant support line at $7,850. This point was the optimal long entry price, with an economic stop level.
There will be more buying opportunities at these levels, and economic stops can be achieved. However, market forces are not going to make it easy. Volatility and emotions are assured, and whoever gets carried away by them will lose.
We are now entering a phase of attacking new positions – with possible support perforations that make even the calmest trader doubtful.
For next week, we cannot rule out incursions outside the limits of the current scenario – below $7,800. These incursions are unlikely to consolidate since if it happens – they could become extremely complicated.
Earlier this week, the fall of the Hashrate installed in the Bitcoin network topped the headlines. But today, the story is the opposite direction – with a sudden growth of the Hashrate – reaching a new historic high. This pattern is repeated before every bullish explosion in the crypto market.
ETH/BTC Daily Chart
The ETH/BTC cross is currently trading at 0.0206 and is now up for three days. This pair between the two largest crypto-verse projects is a reliable indicator of the market's health status.
Above the current price, the first resistance level is at 0.021, then the second at 0.023 and the third one at 0.025.
Below the current price, the first support level is at 0.020, then the second at 0.0196 and the third one at 0.0187.
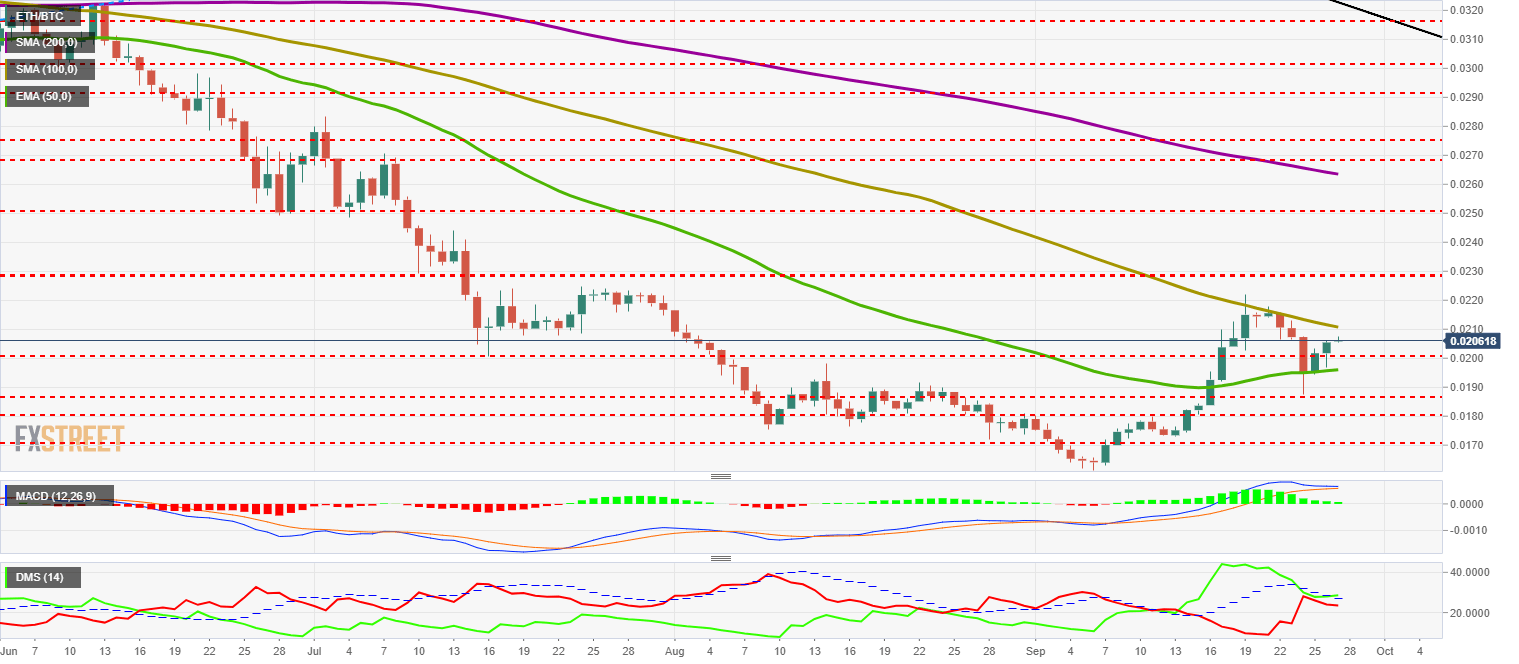
The MACD on the daily chart shows extreme compression between lines as the profile becomes completely horizontal. The lines continue to cross upwards, so the short term scenario is wide open to any direction of the market.
The DMI on the daily chart shows how the bulls take advantage of the bears and also get past the ADX line. The bears lose some strength but still stay above level 20, which allows them to remain in play.
BTC/USD Daily Chart
BTC/USD is currently trading at $8,027 and recovers two support levels from Thursday’s lows. It touched the upper trend line of the ultra long term bearish channel that broke higher at the end of June.
Above the current price, the first resistance level is at $8,200, then the second at $8,400 and the third one at $8,840.
Below the current price, the first level of $8,000, then the second at $7,900 and the third one at $7,750.
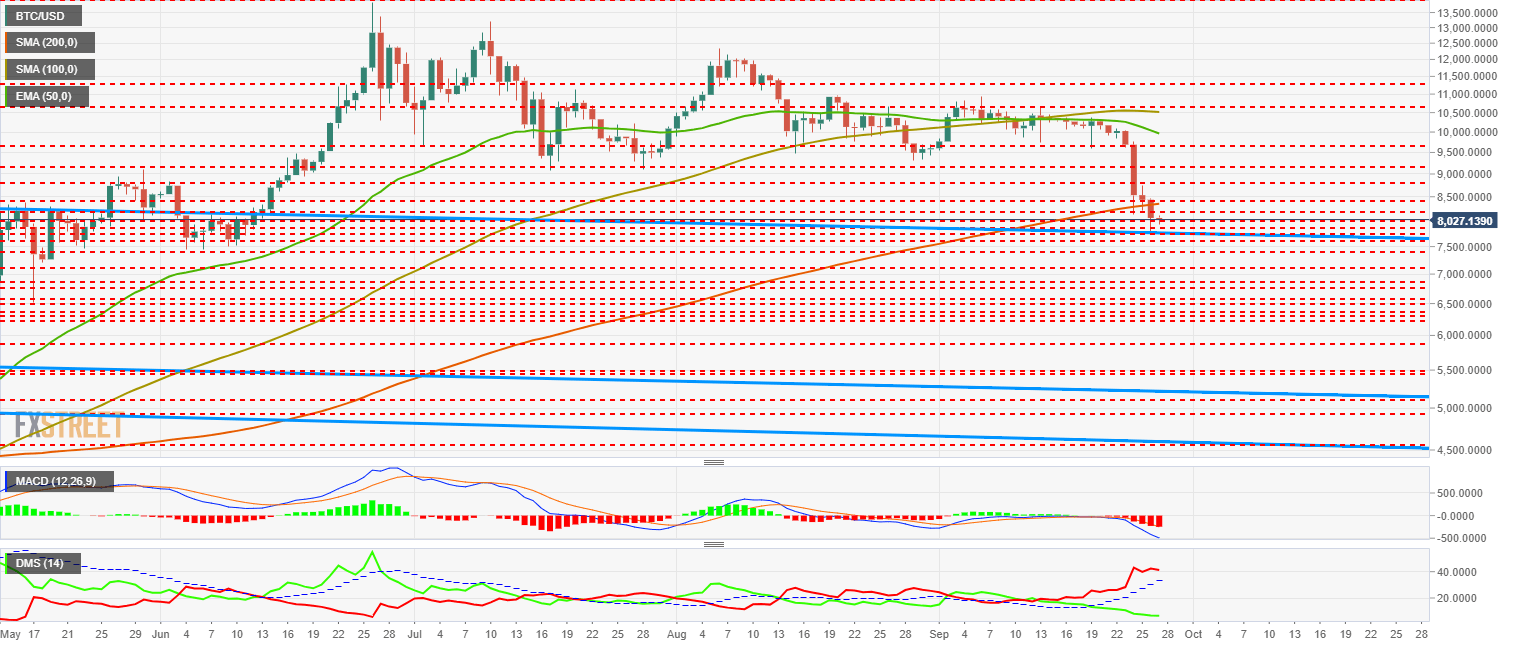
The MACD on the daily chart increases the bearish profile by increasing the downtrend and opening between lines. The most likely development is a continuation of the bearish trend. Nevertheless, given the amplitude between the current lines, an upward rebound may be possible.
The DMI on the daily chart shows the bears dominating the pair, while the bulls go to levels unseen since December 2018, the last time the market made a technical ground.
ETH/USD Daily Chart
ETH/USD is trading at $165.9 after reaching $152.5 yesterday in a typical selling panic episode. Ethereum has regained two levels of support since then, and it is now time to analyze what may happen in the next few days.
Above the current price, the first resistance level is at $170, then the second at $180 and the third one at $190.
Below the current price, the first support level is at $160, then the second at $155 and the third one at $150.
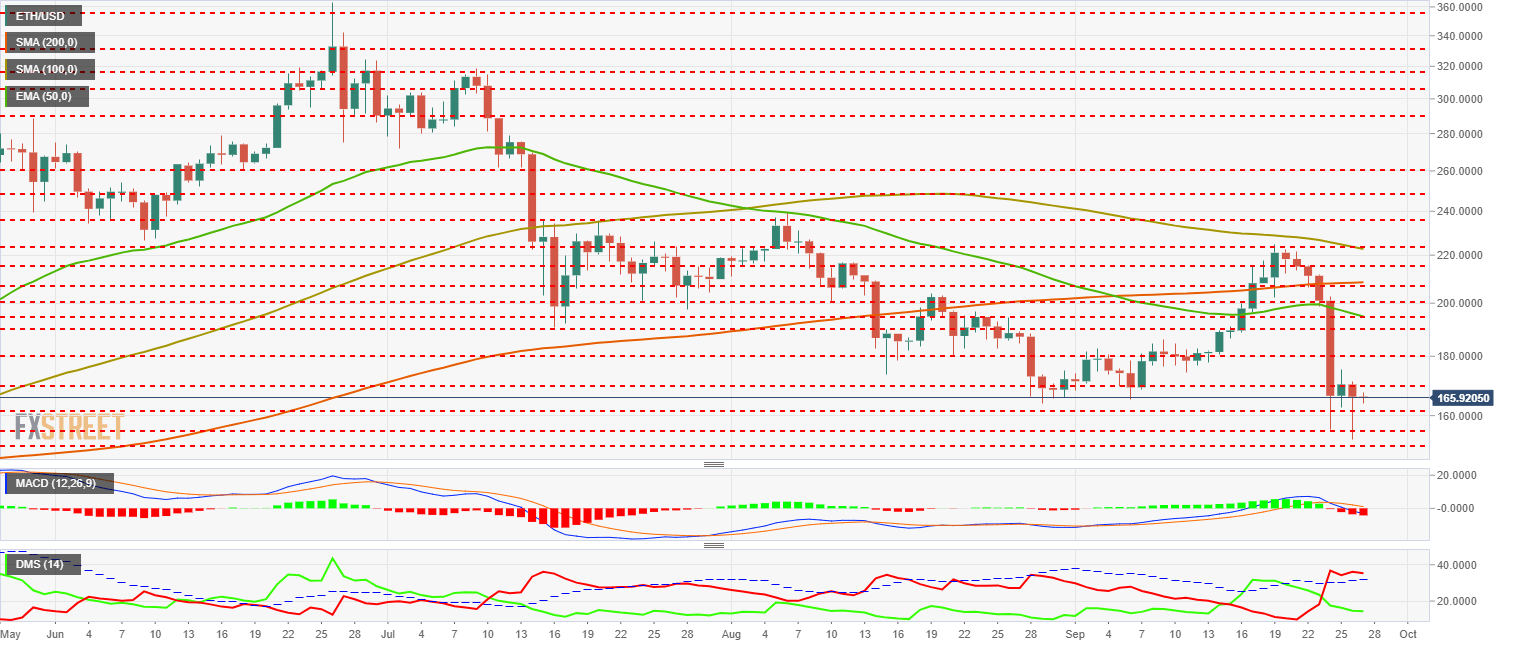
The MACD on the daily chart finds support at the zero levels of the indicator and seeks to resume the bullish trend. We will have the answer in a couple of days on a weekend that may be key to the development of the ETH/USD in the medium term.
The DMI on the daily chart shows bears controlling the situation but failing to increase their trend strength. Bulls fail to gain ground as well, although if it closes in the green – the structure of the buyer side could significantly improve.
XRP/USD Daily Chart
XRP/USD is currently trading at $0.2401 and remains far from the critical $0.25 level.
XRP weathered the selling storm and fell less than Bitcoin and Ethereum. It is potentially indicating that a mood shift in the vilified XRP is possible.
Above the current price, the first resistance level is at $0.253, then the second at $0.26 and the third one at $0.27.
Below the current price, the first support level is $0.237, then the second support level is $0.218, and the third support level is $0.204.
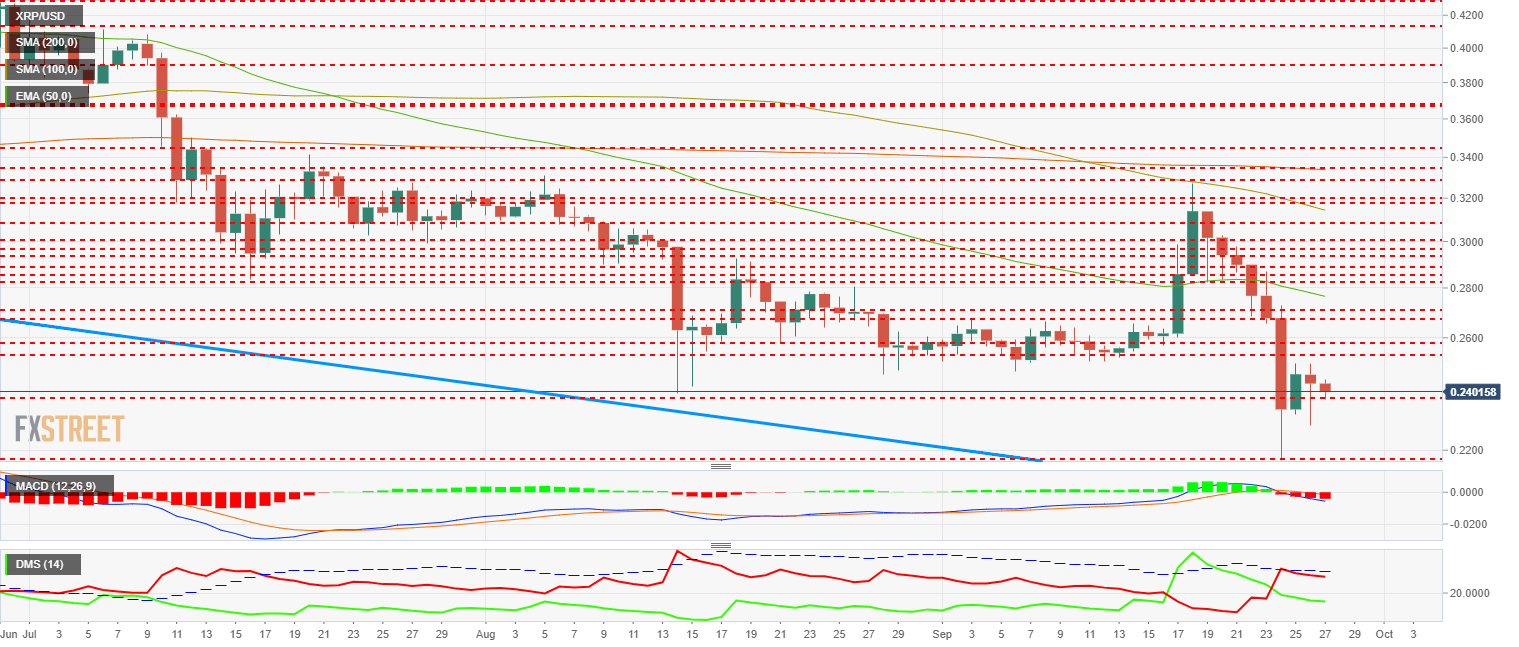
The MACD on the daily chart continues to cross slightly downward and move towards the zero levels of the indicator. The statistics give the bearish side the advantage as a short-term scenario, but the closeness of the bullish side of the indicator provides some chance for a bullish turn.
The DMI on the daily chart shows how bulls lose strength and fail to pass the ADX line. The bulls improve the profile and are close to canceling the bearish trend.
Get 24/7 Crypto updates in our social media channels: Give us a follow at @FXSCrypto and our FXStreet Crypto Trading Telegram channel
Information on these pages contains forward-looking statements that involve risks and uncertainties. Markets and instruments profiled on this page are for informational purposes only and should not in any way come across as a recommendation to buy or sell in these assets. You should do your own thorough research before making any investment decisions. FXStreet does not in any way guarantee that this information is free from mistakes, errors, or material misstatements. It also does not guarantee that this information is of a timely nature. Investing in Open Markets involves a great deal of risk, including the loss of all or a portion of your investment, as well as emotional distress. All risks, losses and costs associated with investing, including total loss of principal, are your responsibility. The views and opinions expressed in this article are those of the authors and do not necessarily reflect the official policy or position of FXStreet nor its advertisers. The author will not be held responsible for information that is found at the end of links posted on this page.
If not otherwise explicitly mentioned in the body of the article, at the time of writing, the author has no position in any stock mentioned in this article and no business relationship with any company mentioned. The author has not received compensation for writing this article, other than from FXStreet.
FXStreet and the author do not provide personalized recommendations. The author makes no representations as to the accuracy, completeness, or suitability of this information. FXStreet and the author will not be liable for any errors, omissions or any losses, injuries or damages arising from this information and its display or use. Errors and omissions excepted.
The author and FXStreet are not registered investment advisors and nothing in this article is intended to be investment advice.
Recommended Content
Editors’ Picks
Why crypto may see a recovery right before or shortly after Bitcoin halving

Cryptocurrency market is bleeding, with Bitcoin price leading altcoins south in a broader market crash. The elevated risk levels have bulls sitting on their hands, but analysts from Santiment say this bleed may only be cauterized right before or shortly after the halving.
Manta Network price braces for volatility as $44 million worth of MANTA is due to flood markets

Manta Network (MANTA) price was not spared from the broader market crash instigated by a weakness in the Bitcoin (BTC) market. While analysts call a bottoming out in the BTC price, the Web3 modular ecosystem token could suffer further impact.
Bitcoin price uptrend to continue post-halving, Bernstein report says as traders remain in disarray

Bitcoin is dropping amid elevated risk levels in the market. It comes as traders count hours to the much-anticipated halving event. Amid the market lull, experts say we may not see a rally until after the halving.
OMNI post nearly 50% loss after airdrop and exchange listing

Omni network (OMNI) lost nearly 50% of its value on Wednesday after investors dumped the token following its listing on top crypto exchanges. A potential reason for the crash may be due to the wider crypto market slump.
Bitcoin: BTC’s rangebound movement leaves traders confused

Bitcoin (BTC) price has been hovering around the $70,000 psychological level for a few weeks, resulting in a rangebound movement. This development could lead to a massive liquidation on either side before a directional move is established.