- ETH/BTC makes the first attempt at the wall at 0.0322.
- Bitcoin weakness unleashes a rally in the Altcoin market.
- XRP retains the greatest short-term potential.
Good morning from old Europe. The Asian session has provided us with significant gains in cryptocurrencies.
The importance of these gains does not stem from their magnitude, but because they have led the market to the brink of a bullish explosion. The trigger that almost went off was ETH/BTC’s near-breach of 0.0332.
Today's high is 0.0331 – almost there – yet there is still a long day ahead.
How important is this? In my opinion, it is a necessary condition to see a new bullish stretch in the bull market, and if the analysis is correct, this upward movement should be intense.
If what the technical scenario proposes happens, the next move would be the first of a new broad bullish cycle in the crypto-sphere.
ETH/BTC 4 Hours Chart
The ETH/BTC crypto cross is currently trading at 0.032435.
Above the current price, the first resistance level is at 0.0332 (price congestion resistance and upper parallel trendline). The second resistance level is between 0.0348 (second upper trendline) and 0.0351 (price congestion resistance), so the third resistance level for the ETH/BTC pair is at 0.036 (third upper parallel trendline).
Below the current price, the first support level is at 0.0316 (price congestion support), so the second support level is at 0.0312 and consists of a triple confluence of the EMA50, the SMA100, and the lower parallel bullish trend line. The third level of support for the ETH/BTC pair is at 0.030, also a double confluence of a price congestion support and the SMA200.
-636948081157899192.png)
The MACD on the four-hour chart shows that the bullish trend has accelerated and the neutral level has been breached, entering the positive zone. The increasing opening between the lines suggests a lasting movement.
The DMI on the 4-hour chart shows the bulls jumping higher with much force and sending the bulls to minimum levels at the same time.
BTC/USD Daily Chart
The BTC/USD pair trades at $ 8,704.24. Technically, the pair is highly conditioned by the overbought situation shown by its indicators. It is likely that, even with a lightning move, it will visit the $8,200 environment.
Above the current price, the first resistance level is at $8,800 (price congestion resistance), then the second resistance level awaits at $9,250 (price congestion resistance). The third resistance level for BTC/USD is at $9,700 (price congestion resistance).
Below the current price, the first support level is at $8,400 (price congestion support), then the second support level is at $8,200 (upper trend line of the long term down channel). The third level of support for the BTC/USD pair is at $8,000 (price congestion support).
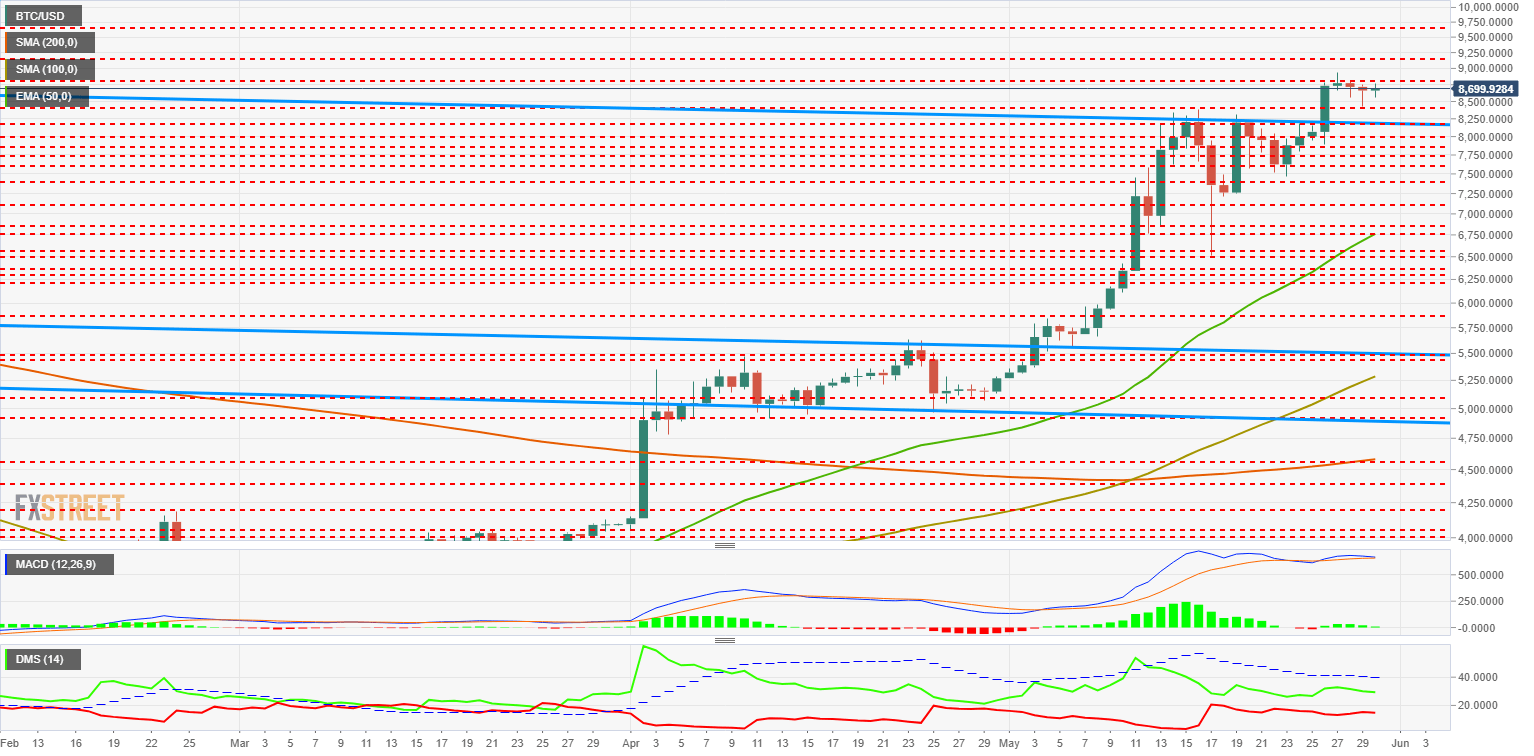
The MACD on the daily chart already clearly shows an overbought structure, where sequences of a bearish cut or precut may be produced before they are returned to the upside – opening up increased volatility.
The DMI on the daily chart does not show any change from the situation in previous days.
ETH/USD Daily Chart
The ETH/USD is trading at the price level of $282.9, after hitting an intraday high at $288.
Above the current price, the first resistance level is at $290 (price congestion resistance), then the second one is $308 (price congestion resistance). And finally, ETH/USD will face $319 (price congestion resistance).
Below the current price, the first support level is $260 (price congestion support), the second is $250 (price congestion support). $238 (price congestion support) is the next one to watch.
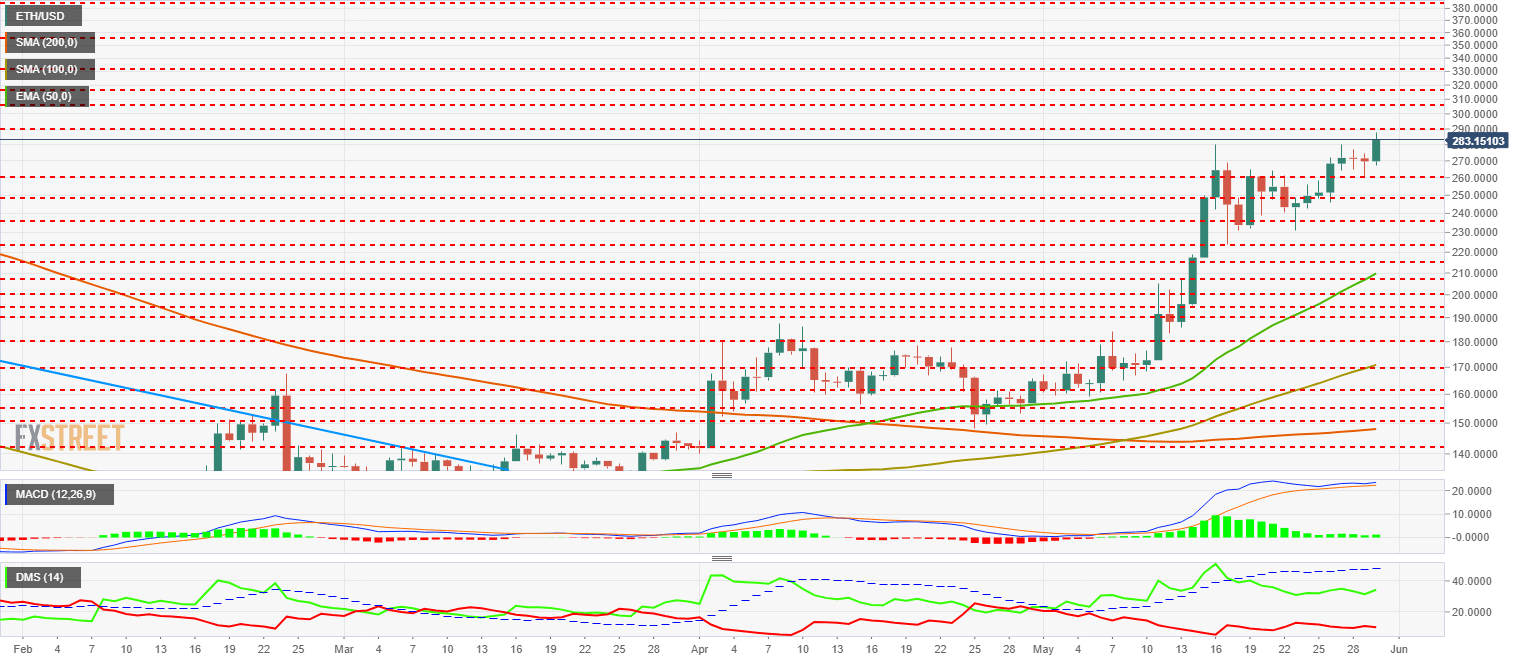
The MACD on the daily chart shows an overbought situation, but unlike BTC/USD pair, there are no multiple cut-offs here. It is a continuous extension.
The DMI on the daily chart shows how the bulls hold a significant advantage over the bears. It is a medium-term continuous structure.
XRP/USD Daily Chart
XRP/USD is trading at $0.459 after a new attempt to break above $0.47 level (price congestion resistance).
Above the current price, the first resistance level is $0.47; then the second resistance level awaits at $0.505 (price congestion resistance). The third resistance level for XRP/USD is $0.53 (price congestion resistance).
Below the current price, the first support level is $0.443 (price congestion support), then the second support level is $0.437 (price congestion support). The third support level for XRP/USD is $0.412 (price congestion support).
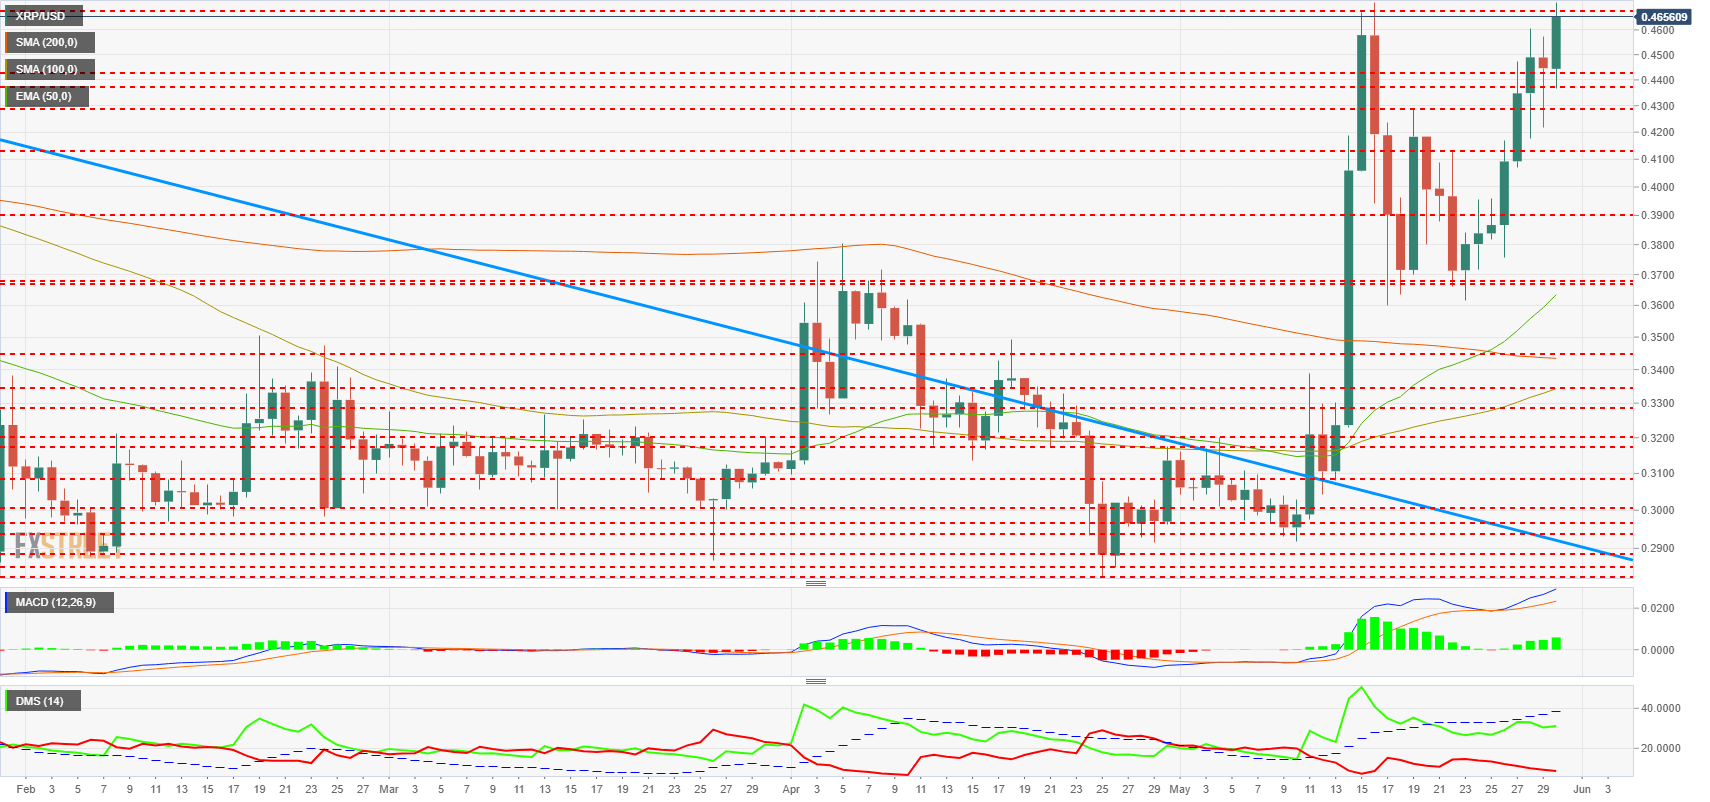
The MACD on the daily chart shows a fully developed bullish structure. It may extend to the upside with force.
The DMI on the daily chart shows bulls dominating and on track to increase the difference against bears. Sellers fall to the lows and show no interest in fighting for leadership.
Get 24/7 Crypto updates in our social media channels: Give us a follow at @FXSCrypto and our FXStreet Crypto Trading Telegram channel
Information on these pages contains forward-looking statements that involve risks and uncertainties. Markets and instruments profiled on this page are for informational purposes only and should not in any way come across as a recommendation to buy or sell in these assets. You should do your own thorough research before making any investment decisions. FXStreet does not in any way guarantee that this information is free from mistakes, errors, or material misstatements. It also does not guarantee that this information is of a timely nature. Investing in Open Markets involves a great deal of risk, including the loss of all or a portion of your investment, as well as emotional distress. All risks, losses and costs associated with investing, including total loss of principal, are your responsibility. The views and opinions expressed in this article are those of the authors and do not necessarily reflect the official policy or position of FXStreet nor its advertisers. The author will not be held responsible for information that is found at the end of links posted on this page.
If not otherwise explicitly mentioned in the body of the article, at the time of writing, the author has no position in any stock mentioned in this article and no business relationship with any company mentioned. The author has not received compensation for writing this article, other than from FXStreet.
FXStreet and the author do not provide personalized recommendations. The author makes no representations as to the accuracy, completeness, or suitability of this information. FXStreet and the author will not be liable for any errors, omissions or any losses, injuries or damages arising from this information and its display or use. Errors and omissions excepted.
The author and FXStreet are not registered investment advisors and nothing in this article is intended to be investment advice.
Recommended Content
Editors’ Picks
Ethereum dips slightly amid Renzo depeg, BlackRock spot ETH ETF amendment

Ethereum (ETH) suffered a brief decline on Wednesday afternoon despite increased accumulation from whales. This follows Ethereum restaking protocol Renzo restaked ETH (ezETH) crashing from its 1:1 peg with ETH and increased activities surrounding spot Ethereum ETFs.
Injective price weakness persists despite over 5.9 million INJ tokens burned
Injective (INJ) price is trading with a bearish bias, stuck in the lower section of the market range. The bearish outlook abounds despite the network's deflationary efforts to pump the price. Coupled with broader market gloom, INJ token’s doomed days may not be over yet.
US intensifies battle against crypto privacy protocols following crackdown on Samourai Wallet

CEO Keonne Rodriguez and CTO William Lonergan of Samourai Wallet were arrested by the US Department of Justice (DoJ) on Wednesday and charged with $100 million in money laundering on a count and illegal money transmitting on another count. This move could see privacy-focused cryptocurrencies take a dip.
Near Protocol Price Prediction: NEAR fulfills targets but a 10% correction may be on the horizon
Near Protocol price has completed a 55% mean reversal from the bottom of the market range at $4.27. Amid growing bearish activity, NEAR could drop 10% to the $6.00 psychological level before a potential recovery. A break and close above $7.95 would invalidate the downleg thesis.
Bitcoin: BTC post-halving rally could be partially priced in Premium

Bitcoin (BTC) price briefly slipped below the $60,000 level for the last three days, attracting buyers in this area as the fourth BTC halving is due in a few hours. Is the halving priced in for Bitcoin? Or will the pioneer crypto note more gains in the coming days?