- ETH/BTC revisits levels last seen in the days leading up to the great Pump.
- Some indicators suggest a change of leadership is on the horizon.
- Uncertainty dominates the market Bitcoin’s predominance is praised.
While Bitcoin attempts an impossible assault on recent highs of $14,000, the rest of the market suffers against the King of cryptocurrencies. The panic spreads, and the dilemma is between staying in Alt positions or jumping on the running train that is Bitcoin.
This type of extreme environment in which emotions begin weighing more than reason is fertile ground for compulsive decision making.
But does it make sense to move from Altcoins to Bitcoin right now?
The relative losses to BTC are already considerable and have reached 35% since the bullish reaction in early May. If we take the December 2017 highs as a reference, the level of value loss is close to 400%.
The current acceleration – after such a long and deep period of declines – fits very well into a terminal scenario, which does not exclude the possibility that the bearish trend will continue for longer.
Any rotation towards Bitcoin should be taken as a measure of protection that will only be effective if it reacts with agility when the Bitcoin/Altcoins relationship changes direction.
ETH/BTC Daily Chart
The ETH/BTC pair has hit levels last seen in the days before the big rise in December 2017. In my opinion, it is a significant level for the pair that best represents the health of the market as a whole
ETH/BTC is currently trading at the price level of 0.02378, while in December 2017 it reached 0.2337.
Above the current price, the first resistance level is at 0.0269 (price congestion resistance), then the second resistance level is 0.0276 (price congestion resistance) and the third one at 0.0282 (EMA50).
Below the current price, the first support level is at 0.02337 (price congestion support), then the second at 0.0200 (price congestion support) and the third one at 0.015 (price congestion support).
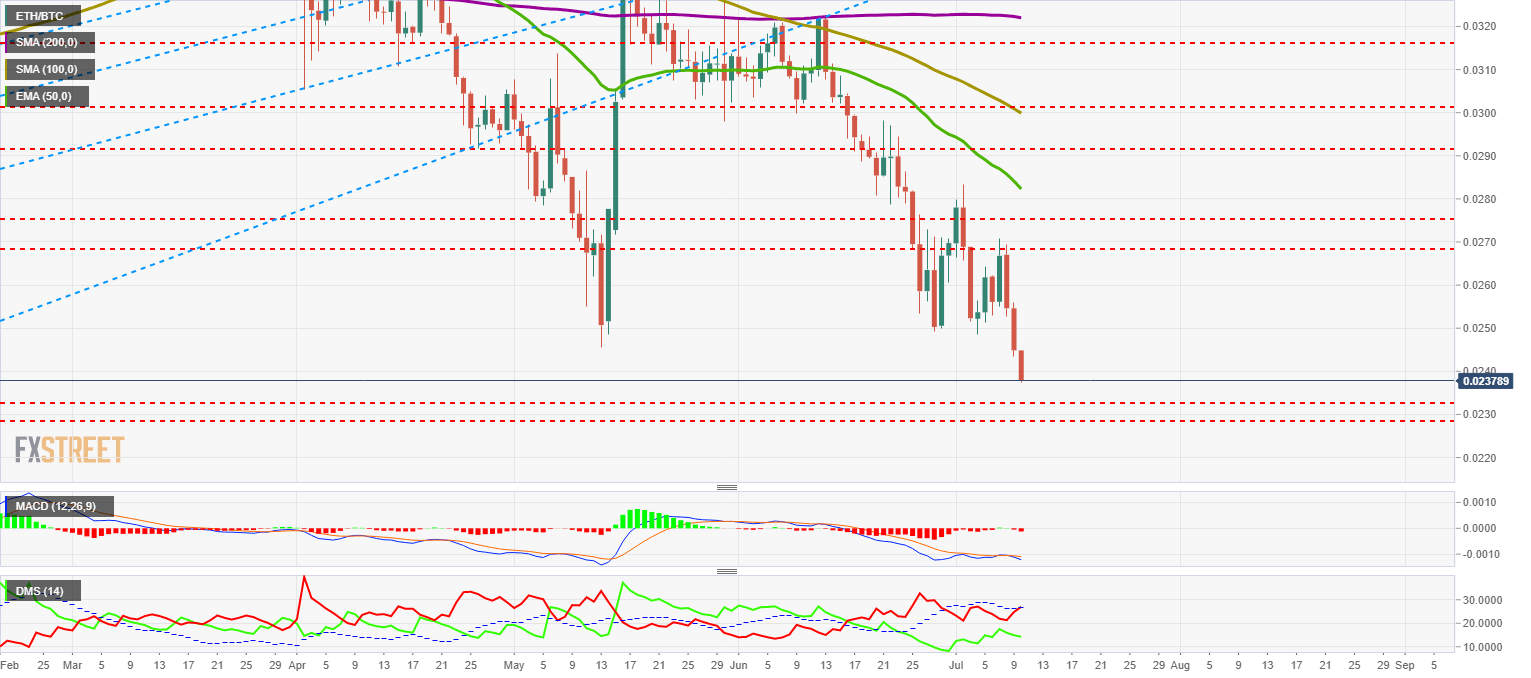
The MACD on the daily chart barely reflects today's drop and remains very flat. The structure is hopeful for a bullish cut, but without ruling out remaining in this situation a few more days.
The DMI in the daily chart shows the bulls sharply increasing the activity and even trying to surpass the ADX line. It is surprising that the bulls, contrary to what one would expect, maintain a high level, and maintain a divergent behavior to the price.
BTC/USD Daily Chart
BTC/USD is trading at $12,982 after hitting $13,000 in the early morning hours in Europe.
Above the current price, the first resistance level is at $14,000 (price congestion resistance), then the second at $17,000 (price congestion resistance) and the third one at $19,890 (historical highs).
Below the current price the first level of support is at $12,000 (price congestion support), then the second at $11,280 (price congestion support) and the third one at $10,600 (price congestion support).
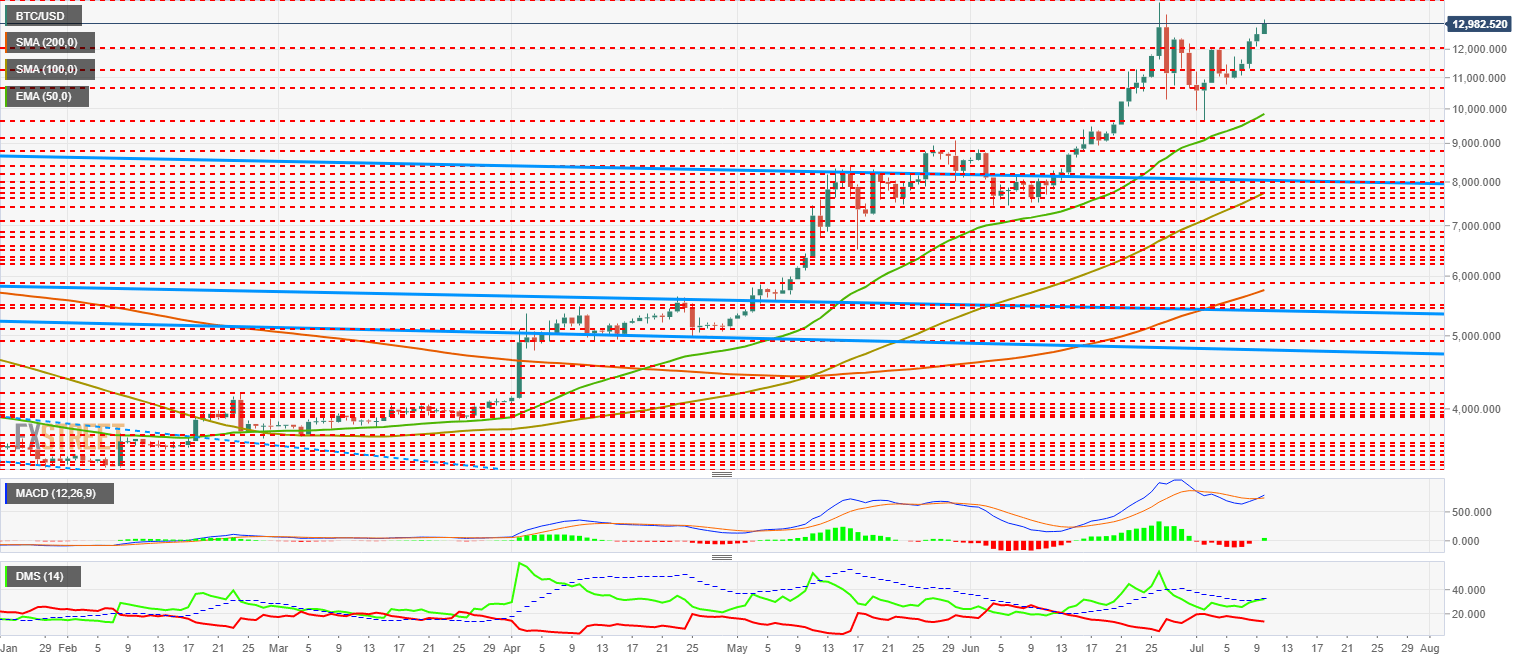
The MACD on the daily chart confirms the bullish cross and opens the door to a continuation of the movement. On the negative side, the pattern is clearly divergent and can lead to falls in the short term.
The DMI on the daily chart shows the bulls taking advantage of the bears once again. In this case, it is worth highlighting how the selling side remains at high levels despite the bullish price pull.
ETH/USD Daily Chart
ETH/USD is currently trading at $308.5 and has been stuck in this price range since the last week of June.
Above the current price, the first resistance level is at $318 (price congestion resistance), then the second at $330 (price congestion resistance) and the third one at $360 (price congestion resistance).
Below the current price, the first level of support is at $305 (price congestion support), then the second at $290 (price congestion support) and the third one at $273 (EMA50).
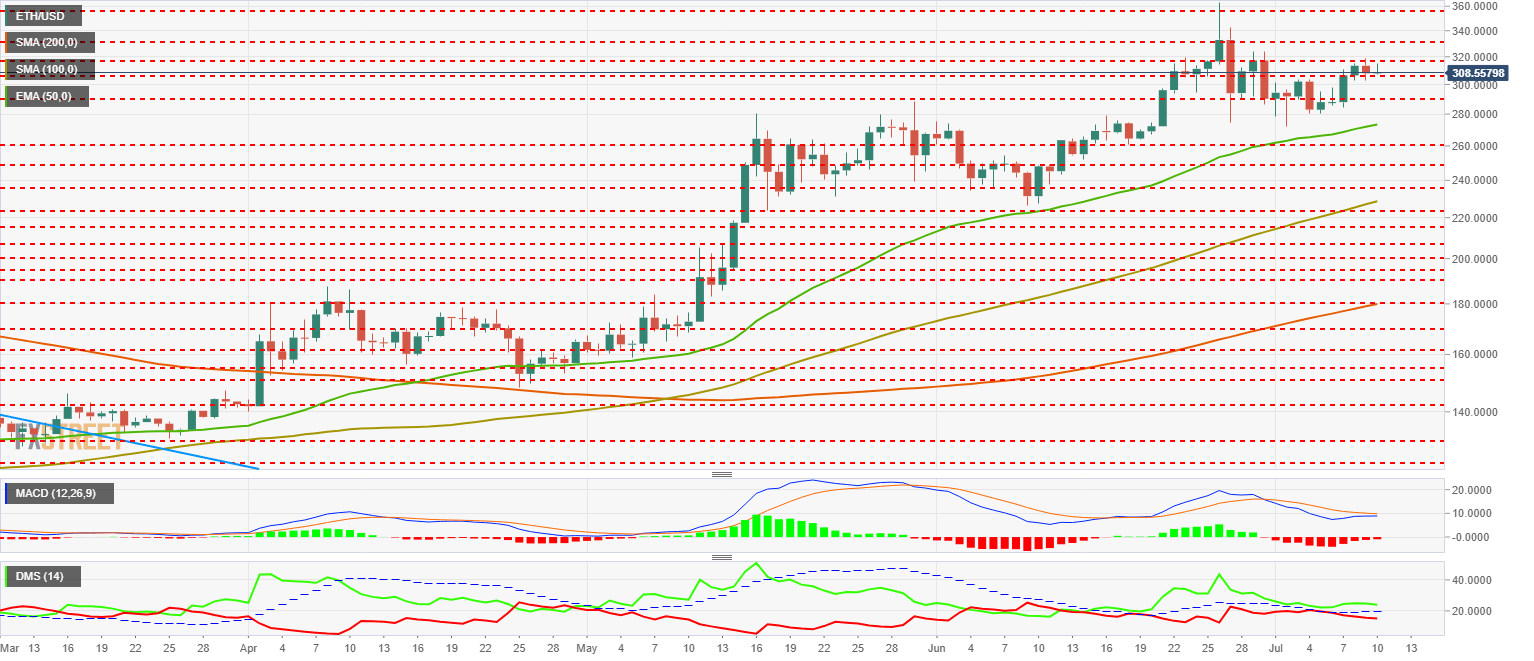
The MACD on the daily chart shows a very flat, downward profile. It is a negative, neutral structure that can change quickly.
The DMI on the daily chart shows bulls leading on the price. The buying side remains above the ADX line, so it retains the bullish potential.
XRP/USD Daily Chart
XRP/USD is currently trading at $0.393, remaining apart from the rest of the market. The valuation of XRP as a utility against Bitcoin or Ethereum as a Store of Value (SOV) is weighing heavily on the price.
Above the current price, the first resistance level is at $0.413 (EMA 50 and price congestion resistance), then the second at $0.4284 (price congestion resistance) and the third one at $0.44 (double price congestion resistance).
Below the current price, the first level of support is at $0.390 (price congestion support), then the second at $0.376 (SMA100) and the third one at $0.349 (price congestion support and SMA200).
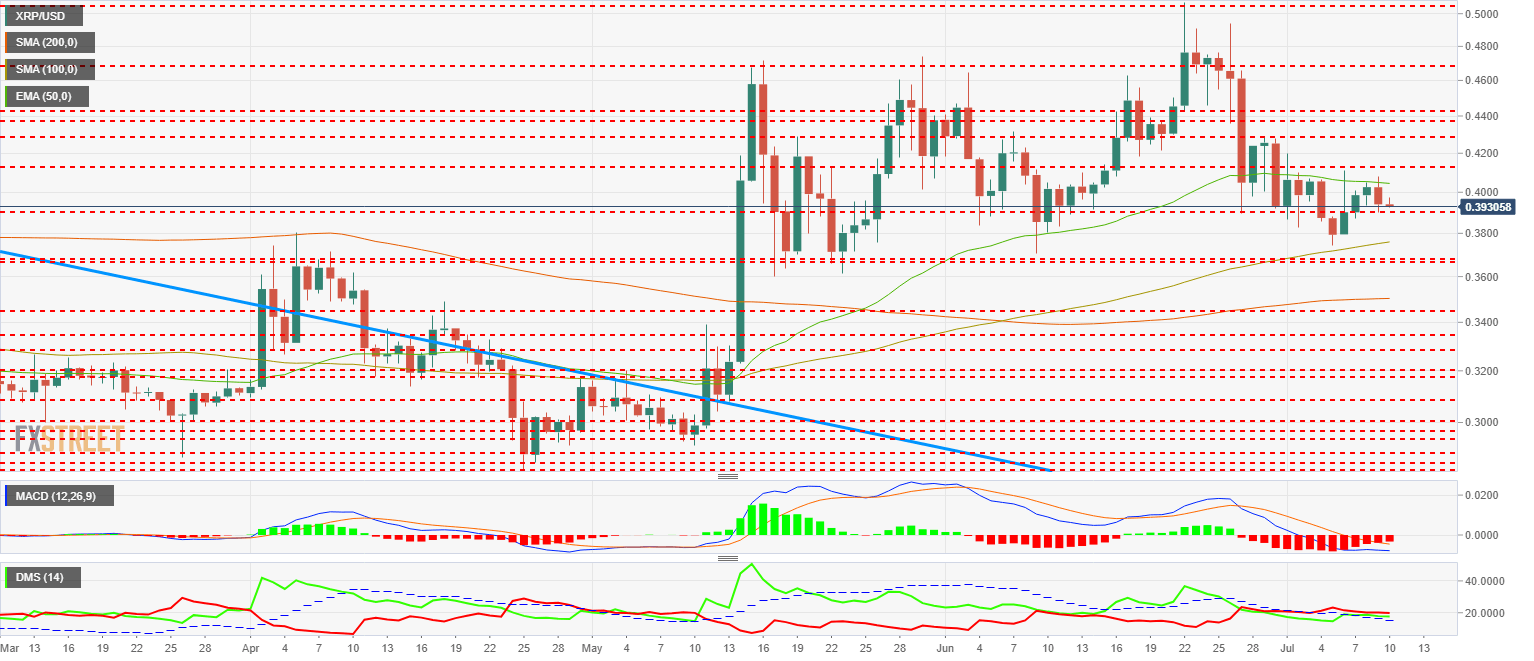
The MACD on the daily chart shows a sideways bearish profile with a likely increase in volatility in the coming sessions.
The DMI on the daily chart shows bears with a small advantage over the bulls. Both sides of the market are above the ADX line, which suggests a scenario of increased volatility.
Get 24/7 Crypto updates in our social media channels: Give us a follow at @FXSCrypto and our FXStreet Crypto Trading Telegram channel
Information on these pages contains forward-looking statements that involve risks and uncertainties. Markets and instruments profiled on this page are for informational purposes only and should not in any way come across as a recommendation to buy or sell in these assets. You should do your own thorough research before making any investment decisions. FXStreet does not in any way guarantee that this information is free from mistakes, errors, or material misstatements. It also does not guarantee that this information is of a timely nature. Investing in Open Markets involves a great deal of risk, including the loss of all or a portion of your investment, as well as emotional distress. All risks, losses and costs associated with investing, including total loss of principal, are your responsibility. The views and opinions expressed in this article are those of the authors and do not necessarily reflect the official policy or position of FXStreet nor its advertisers. The author will not be held responsible for information that is found at the end of links posted on this page.
If not otherwise explicitly mentioned in the body of the article, at the time of writing, the author has no position in any stock mentioned in this article and no business relationship with any company mentioned. The author has not received compensation for writing this article, other than from FXStreet.
FXStreet and the author do not provide personalized recommendations. The author makes no representations as to the accuracy, completeness, or suitability of this information. FXStreet and the author will not be liable for any errors, omissions or any losses, injuries or damages arising from this information and its display or use. Errors and omissions excepted.
The author and FXStreet are not registered investment advisors and nothing in this article is intended to be investment advice.
Recommended Content
Editors’ Picks
SEC doubles down on TRON's Justin Sun lawsuit dismissing claims over jurisdiction

The SEC says it has jurisdiction to bring Justin Sun to court as he traveled extensively to the US. Sun asked to dismiss the suit, arguing that the SEC was targeting actions taken outside the US.
XRP fails to break past $0.50, posting 20% weekly losses

XRP trades range-bound below $0.50 for a sixth consecutive day, accumulating 20% losses in the last seven days. Ripple is expected to file its response to the SEC’s remedies-related opening brief by April 22.
ImmutableX extends recovery despite $69 million IMX token unlock
ImmutableX unlocked 34.19 million IMX tokens worth over $69 million early on Friday. IMX circulating supply increased over 2% following the unlock. The Layer 2 blockchain token’s price added nearly 3% to its value on April 19.
Bitcoin Weekly Forecast: BTC post-halving rally could be partially priced in Premium

Bitcoin price briefly slipped below the $60,000 level for the last three days, attracting buyers in this area as the fourth BTC halving is due in a few hours. Is the halving priced in for Bitcoin? Or will the pioneer crypto note more gains in the coming days?
Bitcoin: BTC post-halving rally could be partially priced in Premium
Bitcoin (BTC) price briefly slipped below the $60,000 level for the last three days, attracting buyers in this area as the fourth BTC halving is due in a few hours. Is the halving priced in for Bitcoin? Or will the pioneer crypto note more gains in the coming days?