- BTC/USD suffers more than its main rivals.
- ETH/USD is not configured to take advantage of the King's easing.
- ETH/BTC forms a double bottom and sets the pace of the market.
It is already dawn in Europe on this first day of July and the weekend leaves us with relative tranquility in prices.
The red numbers have indeed been the protagonists of recent days, but this was somewhat expected. The falls have not broken critical levels in any of the three market leaders we analyzed in the Top 3.
The one who comes out best for the moment is XRP, which enjoys the weak moments of the market of the same atony as in rallies. It is holding up there without bragging, yet with a sense of indirection.
The market is configuring for an Alt season, that is already selectively taking place. Most accounts are seeing their dollar balances go down and up in Bitcoins.
For a better look, let's continue with the analysis of my favorite pair, ETH/BTC.
ETH/BTC Daily Chart
The ETH/BTC pair is currently trading at 0.02689 and continues forming a double bottom that is beginning to look reasonably consistent. This setup is a hopeful one as the continuation of the downturns would have caused a shock in the market.
Above the current price, the first resistance level is at 0.0275 (price congestion resistance), then the second at 0.0291 (price congestion resistance and EMA50) and the third one between 0.030 and 0.0316 (double price congestion resistance, SMA100, and SMA200). Above this level, the pair may accelerate the bullish process.
Below the current price, the first support level is at 0.025 (price congestion support), then the second at 0.0228 (price congestion support) and the third one at 0.020 (price congestion support).
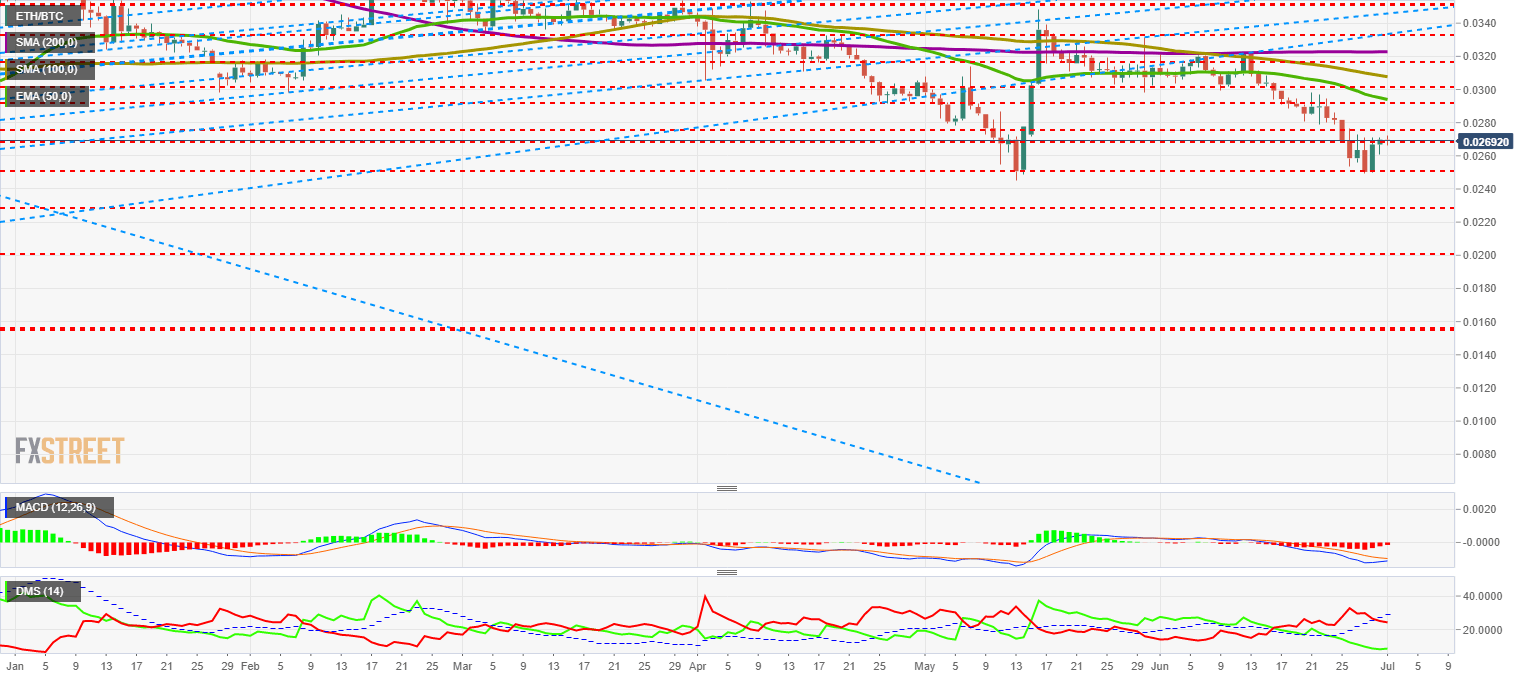
The MACD on the daily chart shows a structure before a bullish cut. There has not yet been any attempt, so the first one will likely fail in the effort.
The DMI on the daily chart shows how the bears cross down the ADX and initiate a pattern that will lead them to impact the ADX line from below and then continue downwards. This scenario would coincide with the failure described in the MACD cut.
BTC/USD Daily Chart
BTC/USD is currently trading at $11,050 and stops for the time being the accelerated decline we have seen yesterday. The consolidation process looks like it will last several weeks and possibly reach the $9,000 level.
Above the current price, the first resistance level is at $11,260 (price congestion resistance, then the second at $14,000 (price congestion resistance) and the third one at $17,150 (price congestion resistance).
Below the current price, the first level of support is at $10,650 (price congestion support), then the second at $9,600 (price congestion support) and the third one at $9,150 (price congestion support and EMA50).
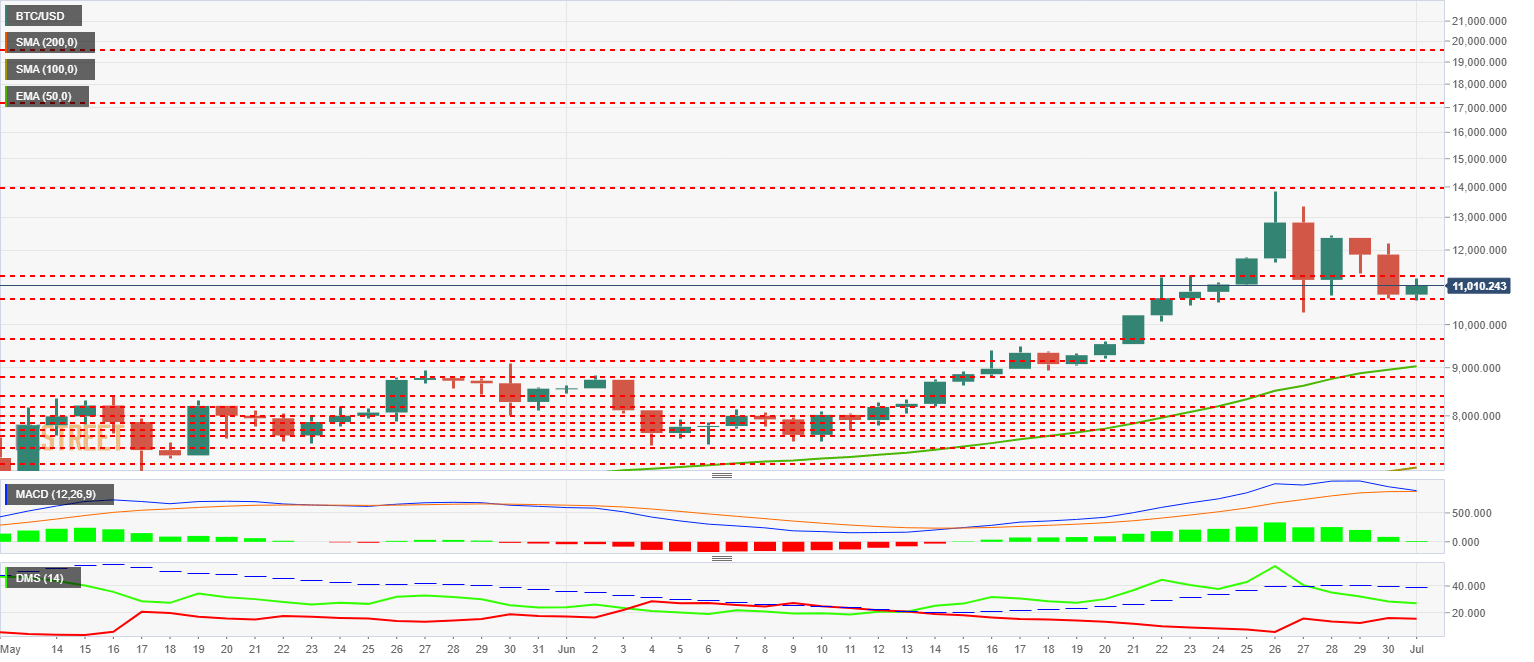
The MACD on the daily chart shows the inverse configuration to the one we have seen on the ETH/BTC pair. In Bitcoin’s case, I see a bearish cross in development that could bounce upwards and then fall again between today and tomorrow. Beware of long positions.
The DMI on the daily chart shows the bulls leading but with less and less advantage over the bears. Neither side of the market seems to want to change the current dynamics.
ETH/USD Daily Chart
The ETH/USD pair is currently trading at the $296.77 price level.
Above the current price, the first resistance level is at $308 (price congestion resistance), then the second at $318 (price congestion resistance) and the third one at $332 (price congestion resistance).
Below the current price, the first level of support is at $290 (price congestion support), then the second at $260 (price congestion support and EMA50) and the third one at $250 (price congestion support).
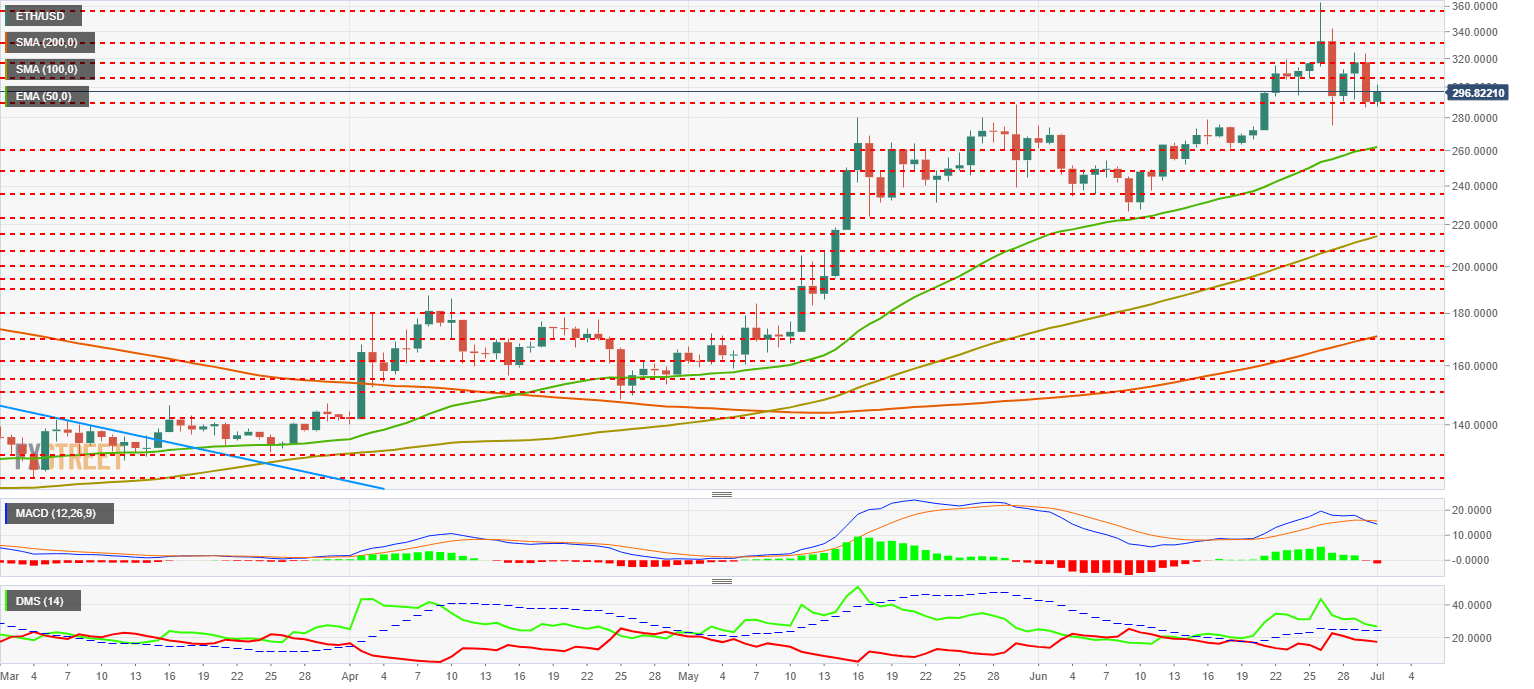
The MACD on the daily chart shows a bearish cut confirming a slightly divergent price structure. The first support zone will likely be visited.
The DMI on the daily chart shows how the bulls continue to hold on and still move above the ADX line, a sign of strength on the buying side that compensates for the increased force on the selling side.
XRP/USD Daily Chart
The XRP/USD is currently trading at the $0.407 price level and is the only one of the Top Three that has not lost its last few days ranges. Nevertheless, it shows signs of weakness.
Above the current price, the first support is at $0.412 (price congestion resistance), then the second at $0.428 (price congestion resistance) and the third one at $0.44 (double price congestion resistance).
Below the current price, the first level of support is at $0.39 (price congestion support), then the second at $0.366 (double price congestion support and SMA100) and the third one at $0.345 (price congestion support and SMA200).
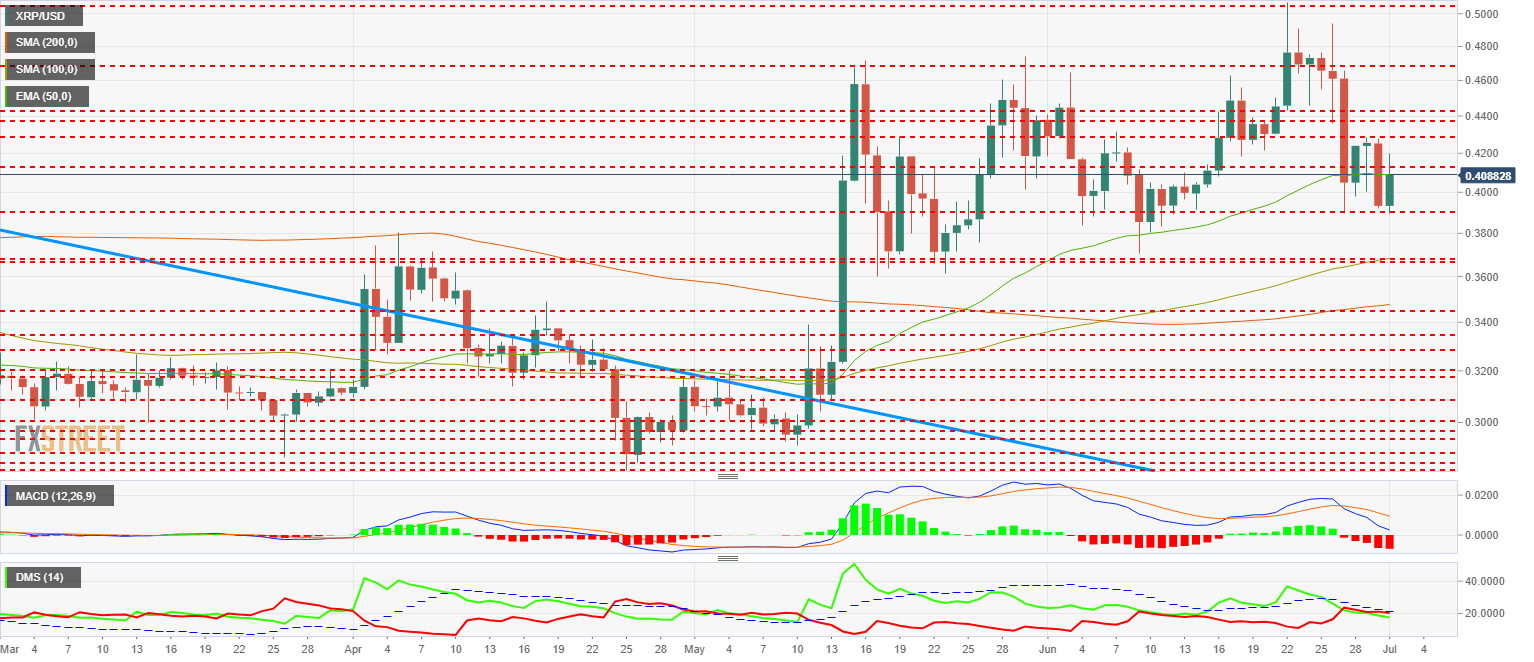
The MACD on the daily chart shows an already highly developed bearish cross. It is already moving close to the 0 levels of the indicator, so there is a possibility that it will turn upwards at that level.
The DMI on the daily chart shows bears with a small advantage over bulls. Both are below the ADX line, so the most likely scenario is sideways price action.
Get 24/7 Crypto updates in our social media channels: Give us a follow at @FXSCrypto and our FXStreet Crypto Trading Telegram channel
Information on these pages contains forward-looking statements that involve risks and uncertainties. Markets and instruments profiled on this page are for informational purposes only and should not in any way come across as a recommendation to buy or sell in these assets. You should do your own thorough research before making any investment decisions. FXStreet does not in any way guarantee that this information is free from mistakes, errors, or material misstatements. It also does not guarantee that this information is of a timely nature. Investing in Open Markets involves a great deal of risk, including the loss of all or a portion of your investment, as well as emotional distress. All risks, losses and costs associated with investing, including total loss of principal, are your responsibility. The views and opinions expressed in this article are those of the authors and do not necessarily reflect the official policy or position of FXStreet nor its advertisers. The author will not be held responsible for information that is found at the end of links posted on this page.
If not otherwise explicitly mentioned in the body of the article, at the time of writing, the author has no position in any stock mentioned in this article and no business relationship with any company mentioned. The author has not received compensation for writing this article, other than from FXStreet.
FXStreet and the author do not provide personalized recommendations. The author makes no representations as to the accuracy, completeness, or suitability of this information. FXStreet and the author will not be liable for any errors, omissions or any losses, injuries or damages arising from this information and its display or use. Errors and omissions excepted.
The author and FXStreet are not registered investment advisors and nothing in this article is intended to be investment advice.
Recommended Content
Editors’ Picks
PancakeSwap loses nearly 3% value intraday as the DEX crosses $1 billion in trade volume

Decentralized exchange (DEX) PancakeSwap (CAKE) announced in an official tweet that it has crossed $1 billion in trade volume on the Layer 2 chain, Base. CAKE on-chain metrics support the thesis of a recovery in the DEX token’s price.
Shiba Inu hits new milestone, over $9 billion worth of SHIB tokens burnt

Shiba Inu (SHIB), the second-largest meme coin in the crypto ecosystem, recently hit a milestone in the volume of tokens burned. Shiba Inu has burnt over 410.72 trillion SHIB tokens since the inception of the burn mechanism in the project, worth over $9 billion.
Dogwifhat crashes 60%, but here's why you should not buy WIF yet Premium

Dogwifhat (WIF) price shows a slowdown in the bearish momentum as it sets up a potential range. This development could lead to a good buying opportunity from a long-term perspective.
XRP struggles to overcome $0.50 resistance, SEC vs. Ripple could enter final pretrial conference

XRP is struggling with resistance at $0.50 as Ripple and the US Securities and Exchange Commission (SEC) are gearing up for the final pretrial conference on Tuesday at a New York court.
Bitcoin: BTC’s rangebound movement leaves traders confused

Bitcoin (BTC) price has been hovering around the $70,000 psychological level for a few weeks, resulting in a rangebound movement. This development could lead to a massive liquidation on either side before a directional move is established.