- BTC and ETH suffer a coup and lose the bullish tone.
- XRP retains bullish momentum.
- Thursday’s move is worthy of the best Technical Analysis textbooks.
The first attempt to break the status quo has suffered its first failure. The movement that we have seen during Thursday’s American session is technically impeccable and fully expected.
It began with a rapid rupture movement of technical levels and was followed by triggering sellers’ positions. In turn, these positions increased at the moment of more significant late entries and far from the stop levels where fear is allowed to roam. The price tumbled down to levels close to the stop-loss points where the fear disappears, and the certainty of action increases.
Technically, the movement is positive, as it verifies the new scenario after BTC/USD surpassed the ceiling of the bearish channel.
The danger of the situation – and there is always a negative side – is that BTC/USD loses the levels it fought so hard to conquer and falls back into the bearish channel. If so, we should put raise the possibility of visiting the base of the technical channel at around $5,500 and the SMA100. Doesn't it seem so far-fetched?
ETH/BTC 4 Hours Chart
The ETH/BTC pair has also been impacted by the pullback, dropping to the SMA200 level and currently trading at 0.0306. It has been put back into an area densely populated with technical obstacles, which may delay the start for a few days.
Above the current price, the first resistance level is in the 0.0315 zone, where there is a strong confluence including the EMA50, SMA100, price congestion resistance, and upper parallel trend line. The second resistance level, again in the clean territory, is at 0.0332 (Price congestion resistance and upper parallel trendline. The third resistance level for ETH/BTC is at 0.035 (price congestion resistance and upper parallel trendline).
Below the current price, the first support level is at 0.030 (price congestion support and SMA200), then the second support level is at 0.0292 (price congestion support and bottom parallel trendline). The third support level for ETH/BTC awaits at 0.0275 (price congestion support).
-636948942888636416.png)
The MACD on the 4-hour chart crosses down but remains in the bullish region of the indicator. The current profile suggests a sideways movement for the next few hours as a possible scenario.
The DMI on the 4-hour chart shows how the bears regained control of the asset thanks to Thursday’s declines. Bulls get below the ADX line, which suggests weakness for the next few hours.
BTC/USD Daily Chart
BTC/USD is currently trading at $8,321 after hitting a low of $8,000 on Thursday and is sure to have triggered a lot of automatic stops.
Above the current price, the first resistance level is at $8,323 (price congestion resistance), then the second resistance level is at $8,800 (price congestion resistance). The third resistance level for BTC/USD is at $9,160 (price congestion resistance and relative maximum).
Below the current price, the first support level is at $9,200 (price congestion support and long term down channel trendline ceiling), then the second support level is at $8,000 (price congestion support). The third level of support for BTC/USD is at $7,860 (price congestion support).
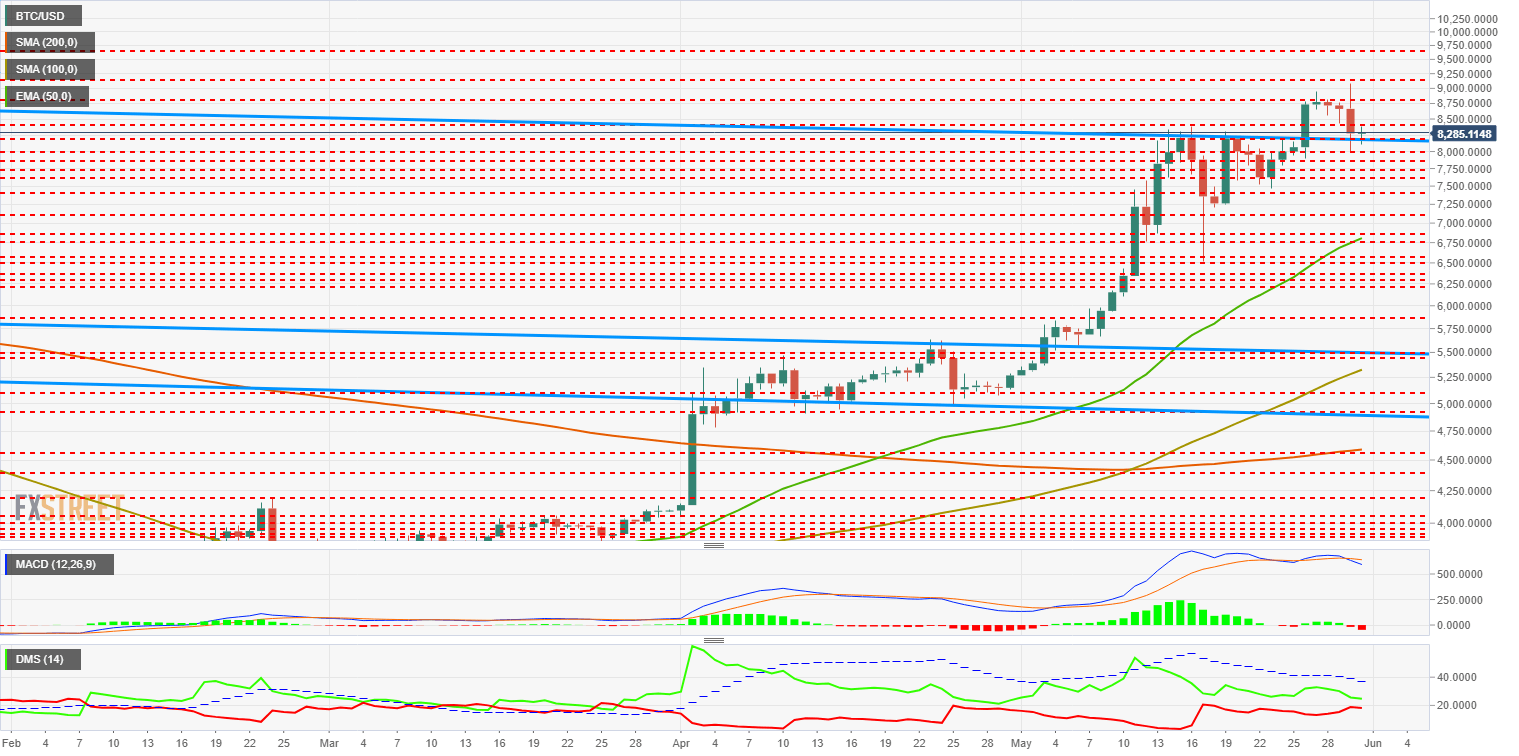
The MACD on the daily chart shows a bearish cross with a high probability of deepening into the bearish momentum. The structure jeopardizes the current support and increases the chances that the BTC/USD pair will re-enter the long term bearish channel. Be very careful with this, short term holders.
The DMI on the daily chart shows a drastic reduction in the advantage of bulls over bears. The clash between both sides of the market – which does not occur since late April – will happen in the coming days and mark the development in the medium term.
ETH/USD Daily Chart
ETH/USD is currently trading at $254.6, after Thursday’s high of $290. The magnitude of the drop is substantial, but we must keep in mind that between $260 and $290, Ethereum has no support.
Above the current price, the first resistance level is at $260 (price congestion resistance), then the second resistance level is at $290 (price congestion resistance and relative maximum). The third resistance level for the ETH/USD pair is at $306.
Below the current price, the first support level is at $250 (price congestion support), then the second support level is at $238 (price congestion support). The third level of support for ETH/USD is at $224 (price congestion support).
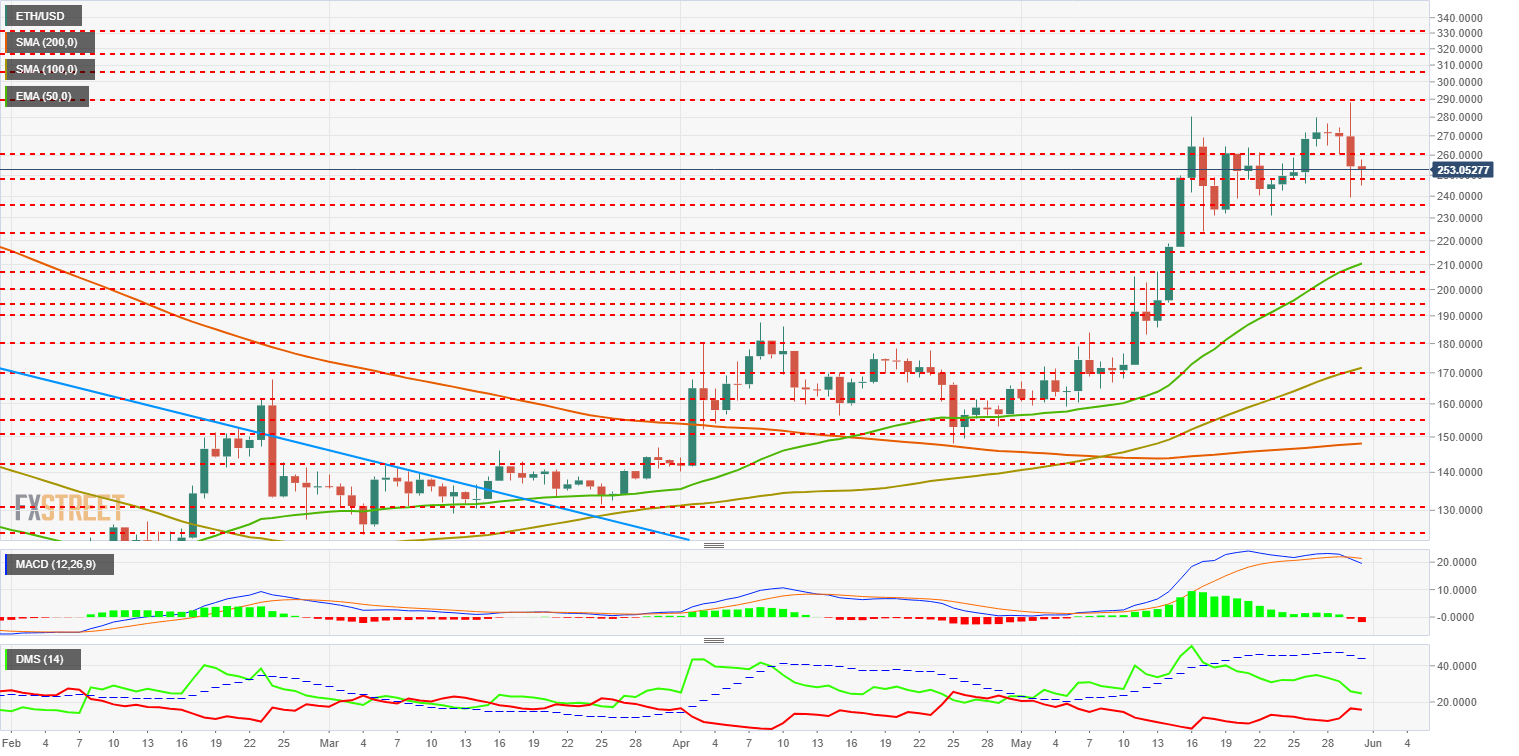
The MACD on the daily chart shows a precise bearish cross, so the potential downward increases. The most likely scenario is a lateral bearish one.
The DMI on the daily chart shows how the difference between bulls and bears has narrowed a lot. It should be noted that both sides of the market have been moving lower in the last few hours.
XRP/USD Daily Chart
XRP/USD is currently trading at $0.4203, after peaking at $0.474 yesterday.
Above the current price, the first resistance level is $0.428 (price congestion resistance), then the second resistance level is $0.438 (price congestion resistance). The third resistance level for XRP/USD is $0.44 (price congestion resistance).
Below the current price, the first support level is $0.412 (price congestion support), then the second support level is $0.39 (price congestion support). The third level of support for XRP/USD is $0.368 (Price congestion support over multiple time frames).
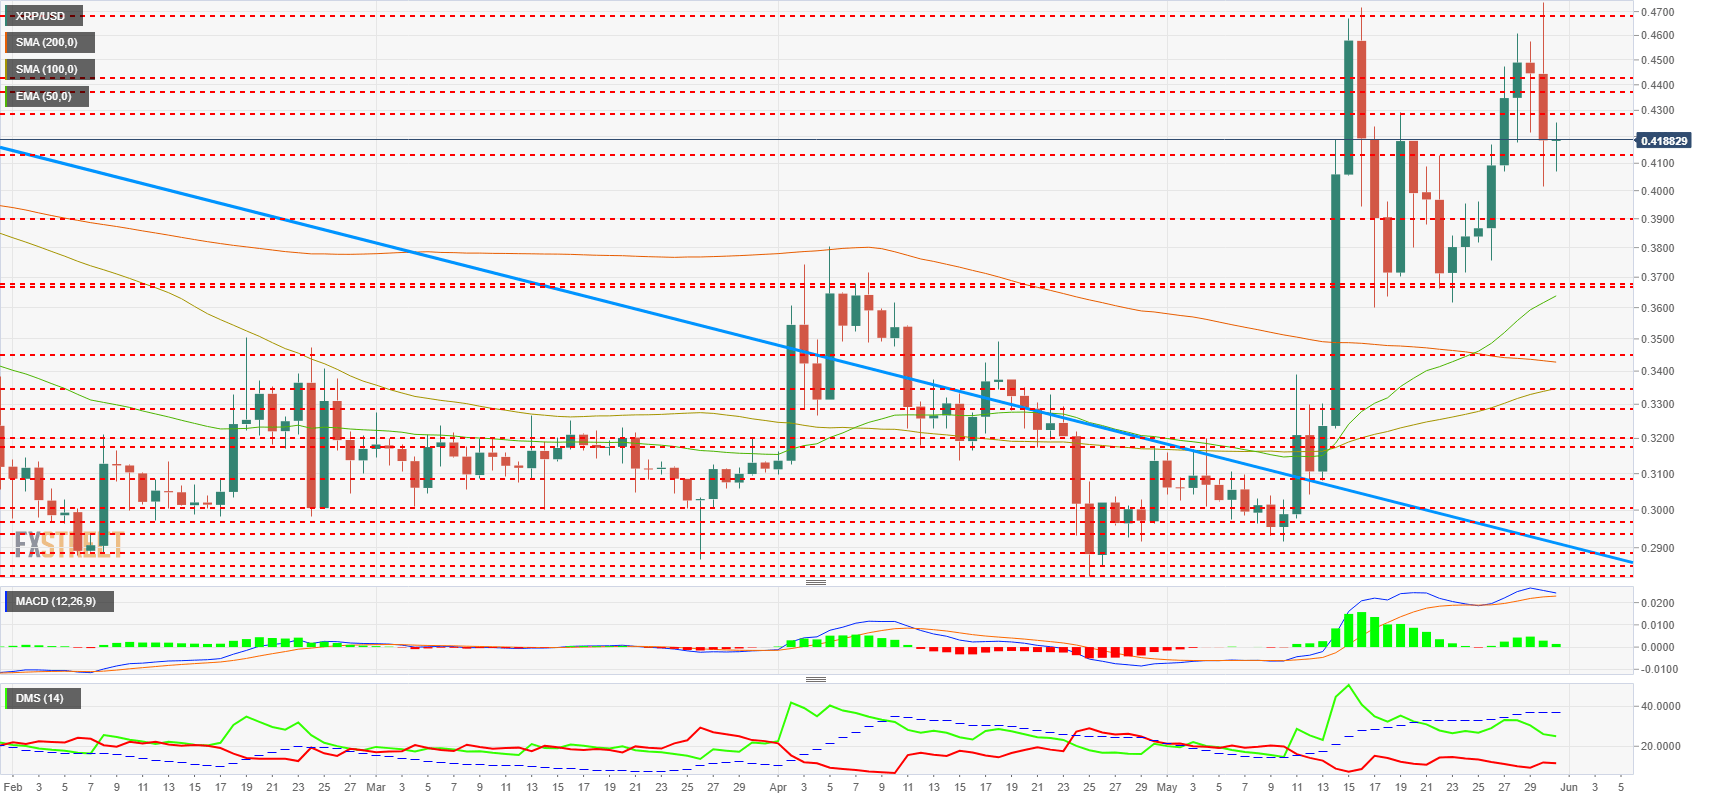
The MACD on the daily chart does not show a bearish cross as seen in Bitcoin and Ethereum. This data is enough to sense who can be the winner in the next few days.
The DMI in the daily chart shows how the bulls have lost intensity but still have a substantial advantage over the bears. To emphasize – the seller side of the market remains at shallow levels despite the apparent broad change of tone in the short term.
Get 24/7 Crypto updates in our social media channels: Give us a follow at @FXSCrypto and our FXStreet Crypto Trading Telegram channel
Information on these pages contains forward-looking statements that involve risks and uncertainties. Markets and instruments profiled on this page are for informational purposes only and should not in any way come across as a recommendation to buy or sell in these assets. You should do your own thorough research before making any investment decisions. FXStreet does not in any way guarantee that this information is free from mistakes, errors, or material misstatements. It also does not guarantee that this information is of a timely nature. Investing in Open Markets involves a great deal of risk, including the loss of all or a portion of your investment, as well as emotional distress. All risks, losses and costs associated with investing, including total loss of principal, are your responsibility. The views and opinions expressed in this article are those of the authors and do not necessarily reflect the official policy or position of FXStreet nor its advertisers. The author will not be held responsible for information that is found at the end of links posted on this page.
If not otherwise explicitly mentioned in the body of the article, at the time of writing, the author has no position in any stock mentioned in this article and no business relationship with any company mentioned. The author has not received compensation for writing this article, other than from FXStreet.
FXStreet and the author do not provide personalized recommendations. The author makes no representations as to the accuracy, completeness, or suitability of this information. FXStreet and the author will not be liable for any errors, omissions or any losses, injuries or damages arising from this information and its display or use. Errors and omissions excepted.
The author and FXStreet are not registered investment advisors and nothing in this article is intended to be investment advice.
Recommended Content
Editors’ Picks
SEC doubles down on TRON's Justin Sun lawsuit dismissing claims over jurisdiction

The SEC says it has jurisdiction to bring Justin Sun to court as he traveled extensively to the US. Sun asked to dismiss the suit, arguing that the SEC was targeting actions taken outside the US.
XRP fails to break past $0.50, posting 20% weekly losses

XRP trades range-bound below $0.50 for a sixth consecutive day, accumulating 20% losses in the last seven days. Ripple is expected to file its response to the SEC’s remedies-related opening brief by April 22.
ImmutableX extends recovery despite $69 million IMX token unlock
ImmutableX unlocked 34.19 million IMX tokens worth over $69 million early on Friday. IMX circulating supply increased over 2% following the unlock. The Layer 2 blockchain token’s price added nearly 3% to its value on April 19.
Bitcoin Weekly Forecast: BTC post-halving rally could be partially priced in Premium

Bitcoin price briefly slipped below the $60,000 level for the last three days, attracting buyers in this area as the fourth BTC halving is due in a few hours. Is the halving priced in for Bitcoin? Or will the pioneer crypto note more gains in the coming days?
Bitcoin: BTC post-halving rally could be partially priced in Premium
Bitcoin (BTC) price briefly slipped below the $60,000 level for the last three days, attracting buyers in this area as the fourth BTC halving is due in a few hours. Is the halving priced in for Bitcoin? Or will the pioneer crypto note more gains in the coming days?