- Patience and knowledge of the key levels, essential to properly manage the technical moment.
- Top 3 continue in bearish scenarios and arrive exhausted to the bullish breakout zone.
- The short term is configured upwards, contradicting what the medium-term charts convey, with a more sideways profile.
The crypto market opens the trading week by taking advantage of the momentum of the movement that started early Sunday morning.
As if it were an established rhythm, this week it is time to go up after going down the previous one, and up again the previous one.
Technically the bullish scenario in the short term was not the most probable. At the moment there are no changes in the medium term, although seeing how the Top 10 altcoins are rising, we can rule out a surprise bullish breakout.
The situation is perfect for waking up FOMO among investors and trigger impulse buying.
In this article, I will try to make clear the levels of change of scenario, hoping that it will help them make the right decisions.
ETH/BTC 4-Hours Chart
The ETH/BTC pair deserves all the attention because for investors focused on getting Bitcoins at all costs, it's a primary tool. The ETH/BTC pair managed to escape the long term bearish scenario two weeks ago.
Short-term technical analysis.
The ETH/BTC is currently trading at the price level of 0.01929.
Above the current price, the first resistance level is at 0.020, then the second at 0.022 and the third one at 0.023.
Below the current price, the first support level is at 0.019, then the second at 0.0187 and the third one at 0.0183.
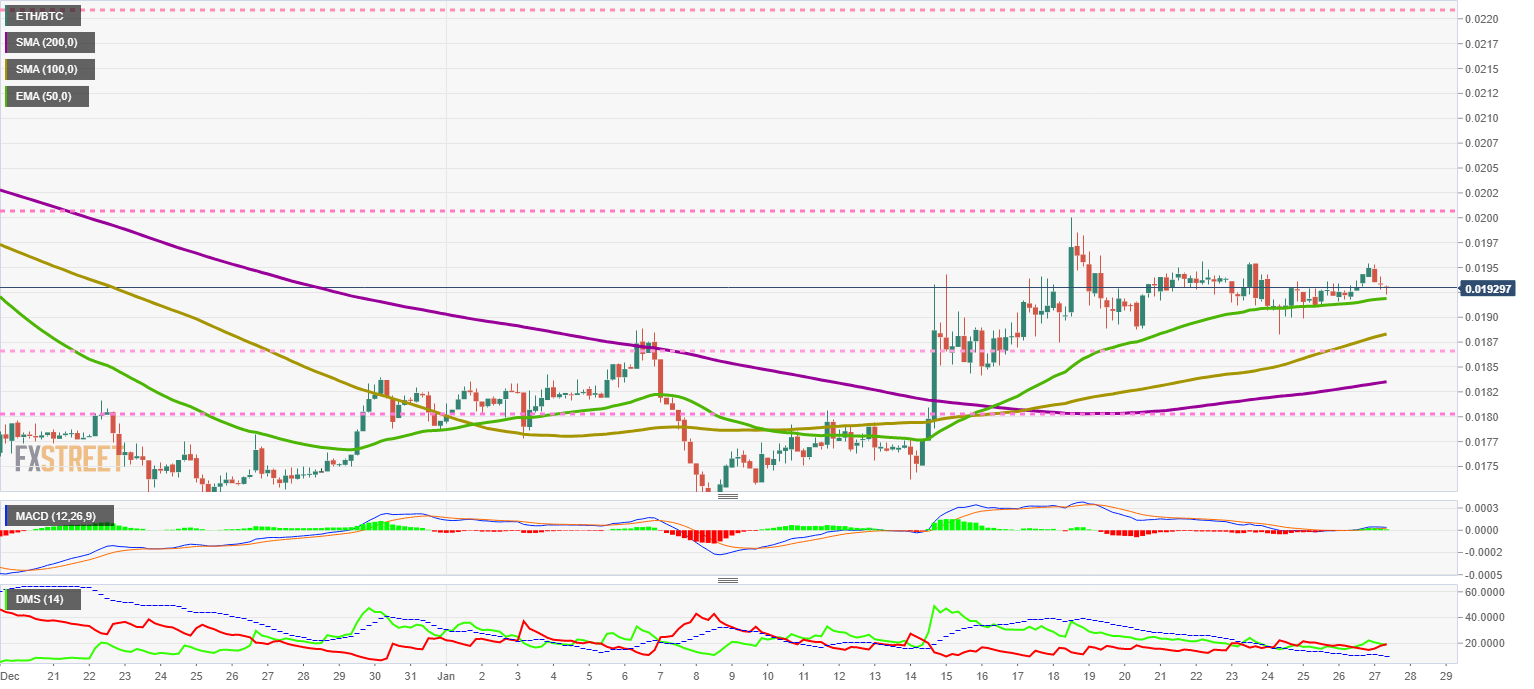
The MACD on the 4-hour chart is slightly tilted and rests comfortably on the 0 levels of the indicator. This setting does not provide any information.
The DMI on the daily chart shows that the pair is in a tight spot between the two sides of the market. Both bears and bulls tend to increase their trend force and increase the chances of an explosive exit to the current equilibrium situation.
BTC/USD 4-Hours Chart
The BTC/USD pair is moving above yesterday's highs but is losing some of the upward momentum we saw during the Asian session.
The Bitcoin needs to break above $9,000 to escape the current consolidation scenario. On the risk side, the situation will get worse with the loss of the $7,350 support level.
Short-term technical analysis.
The BTC/USD is currently trading at $8,578 and is in a bearish position after yesterday's gains. Following the opening of the Asian bullish trend, the chart shows a Doji and now a bearish candlestick. A close in this configuration would be harmful in the short term.
Above the current price, the first resistance level is at $8,800, then the second at $9,175 and the third one at $9,600.
Below the current price, the first support level is at $8,515, then the second at $8,400 and the third one at $8,200.
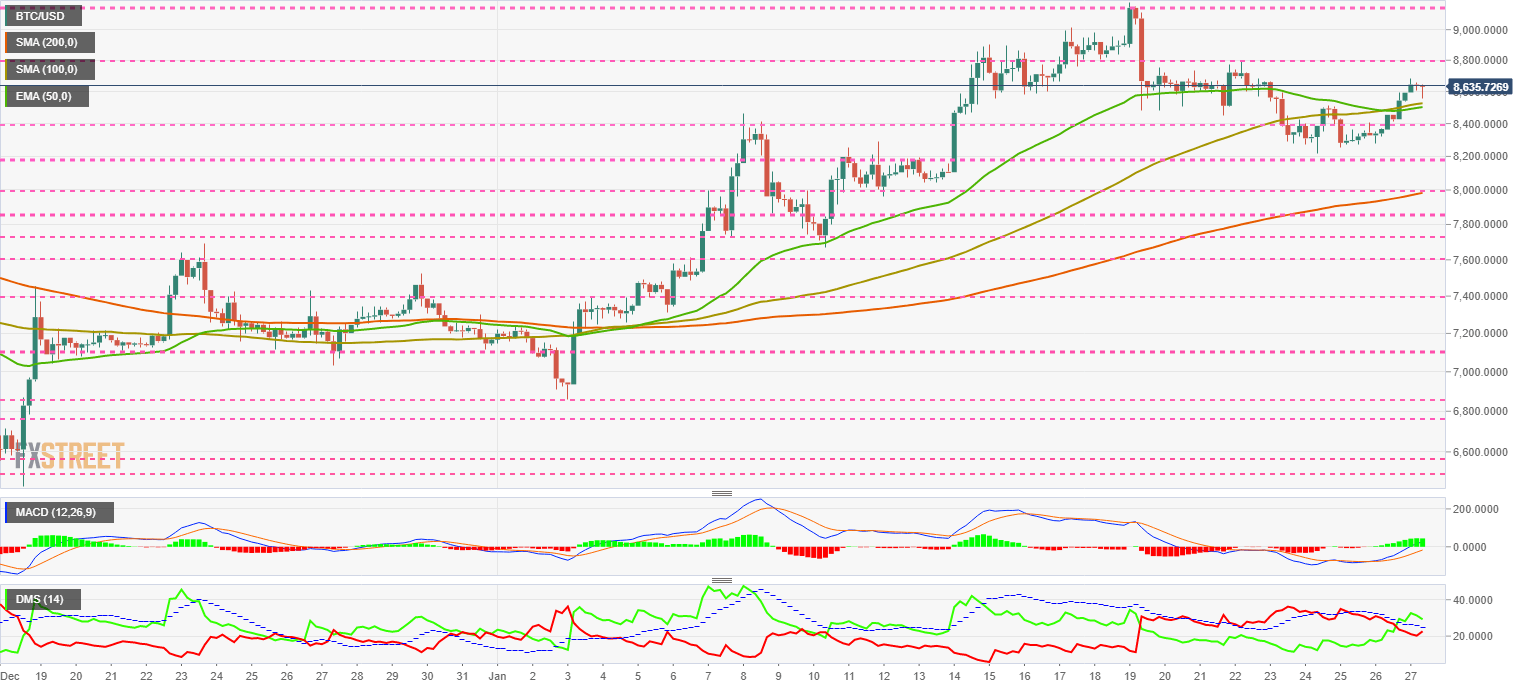
The MACD on the 4-hour chart shows a bullish cross has formed. The upward slope of the moving averages and the opening between the lines support the continuation of the upward trend.
The DMI on the 4-hour chart shows an active bullish pattern, with the bulls above the ADX line. As long as the bears move below the ADX line, the pattern will remain active.
ETH/USD 4-Hours Chart
The ETH/USD pair has slowed to the $170 resistance level and is far from the $185 level that marks the exit from the consolidation scenario and a new bullish phase. On the risk side, the $120 level marks the level at which the scene would mutate into a very negative one.
Short-term technical analysis.
The ETH/USD is currently trading at the price level of $166.6 and is retreating after an attempt to overcome price congestion resistance at $170.
Above the current price, the first resistance level is at $170, then the second at $176.5 and the third one at $180.
Below the current price, the first support level is at $160, the second at $155 and the third one at $150.
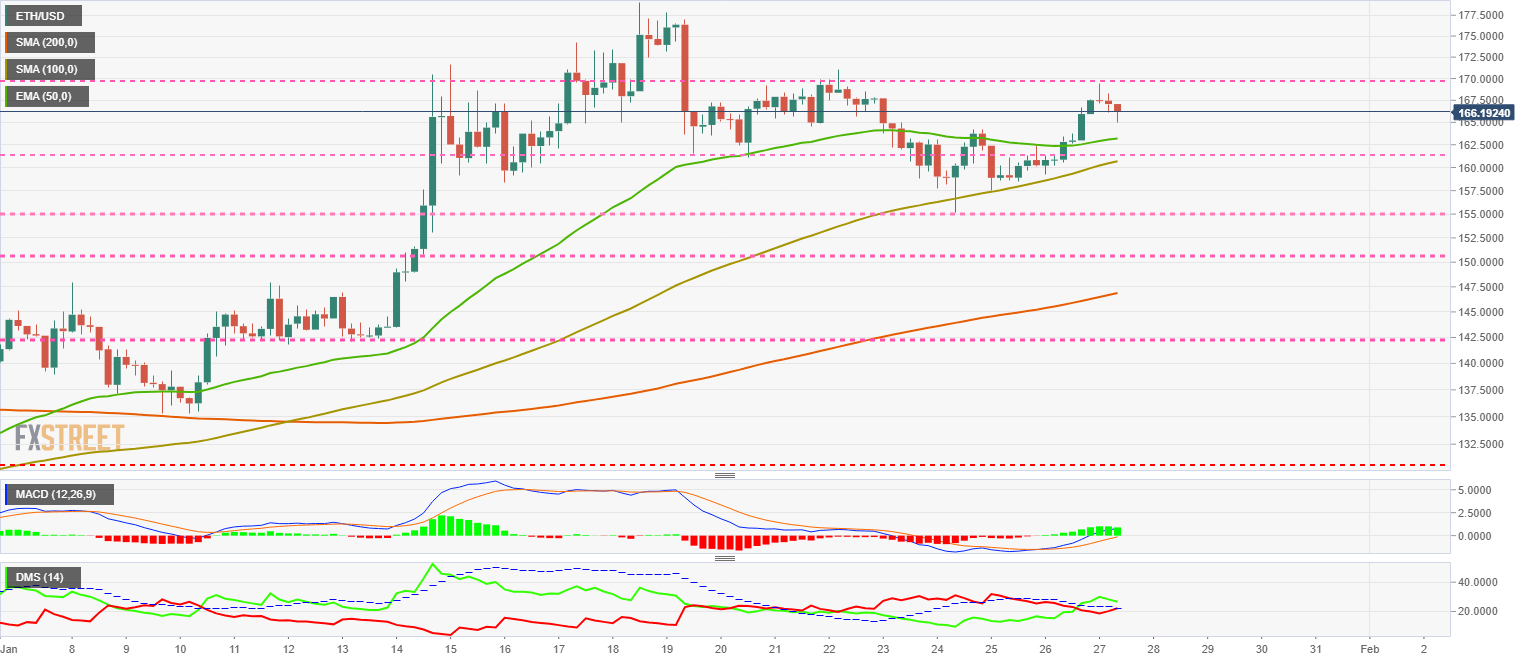 The MACD on the 4-hour chart shows an active bullish cross profile, with a significant upward slope and the opening between the lines. The current setup is potentially bullish in the short term.
The DMI on the 4-hour chart shows the bulls with an active bullish pattern. The buy-side moves smoothly above the ADX line and triggers a bullish pattern in the short term. The bears are not giving up and are trying at this time to dispute the control over the pair.
XRP/USD 4-Hours Chart
The XRP/USD pair managed to escape the long term bearish scenario with yesterday's rally but is risking it again today as soon as sales appear. The XRP would enter a new bullish phase above the $0.260 level, while the gates of hell are beyond the $0.17 level.
Short-term technical analysis.
The XRP/USD is currently trading at $0.227, and after the last few hours of gains, it is outperforming all the major moving averages.
Above the current price, the first resistance level is at $0.2366, then the second at $0.2535 and the third one at $0.265.
Below the current price, the first support level is at $0.225, then the second at $0.217 and the third one at $0.2120.
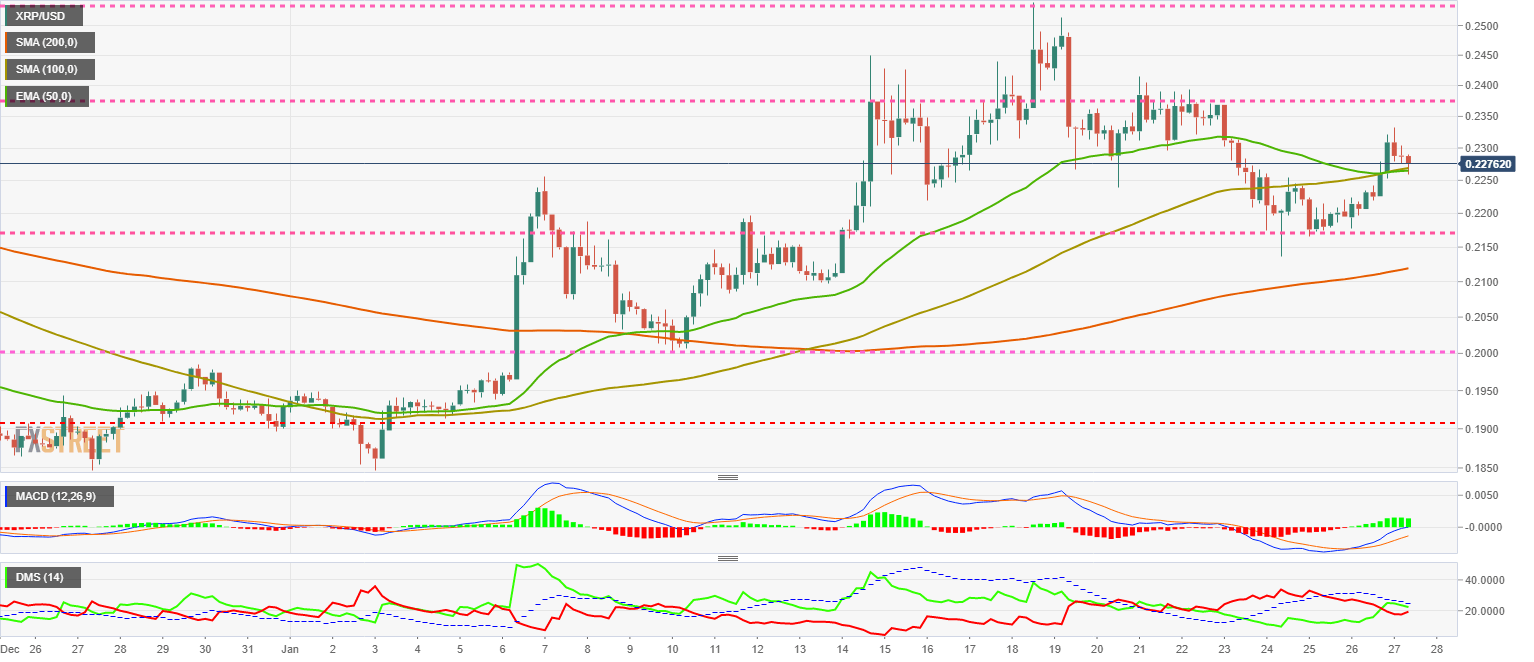
The MACD on the 4-hour chart shows a very bullish profile only limited by the presence of level 0, which separates the downward and upward sides. If the XRP/USD continues to move higher, the indicator will enter the bullish zone and take on more strength.
The DMI on the 4-hour chart shows the bulls and bears in a technical tie as they both move just below the ADX line. The side that manages to get above this line that measures the strength of the trend will activate a pattern that will give you control of the market.
Get 24/7 Crypto updates in our social media channels: Give us a follow at @FXSCrypto and our FXStreet Crypto Trading Telegram channel
Information on these pages contains forward-looking statements that involve risks and uncertainties. Markets and instruments profiled on this page are for informational purposes only and should not in any way come across as a recommendation to buy or sell in these assets. You should do your own thorough research before making any investment decisions. FXStreet does not in any way guarantee that this information is free from mistakes, errors, or material misstatements. It also does not guarantee that this information is of a timely nature. Investing in Open Markets involves a great deal of risk, including the loss of all or a portion of your investment, as well as emotional distress. All risks, losses and costs associated with investing, including total loss of principal, are your responsibility. The views and opinions expressed in this article are those of the authors and do not necessarily reflect the official policy or position of FXStreet nor its advertisers. The author will not be held responsible for information that is found at the end of links posted on this page.
If not otherwise explicitly mentioned in the body of the article, at the time of writing, the author has no position in any stock mentioned in this article and no business relationship with any company mentioned. The author has not received compensation for writing this article, other than from FXStreet.
FXStreet and the author do not provide personalized recommendations. The author makes no representations as to the accuracy, completeness, or suitability of this information. FXStreet and the author will not be liable for any errors, omissions or any losses, injuries or damages arising from this information and its display or use. Errors and omissions excepted.
The author and FXStreet are not registered investment advisors and nothing in this article is intended to be investment advice.
Recommended Content
Editors’ Picks
SEC doubles down on TRON's Justin Sun lawsuit dismissing claims over jurisdiction

The SEC says it has jurisdiction to bring Justin Sun to court as he traveled extensively to the US. Sun asked to dismiss the suit, arguing that the SEC was targeting actions taken outside the US.
XRP fails to break past $0.50, posting 20% weekly losses

XRP trades range-bound below $0.50 for a sixth consecutive day, accumulating 20% losses in the last seven days. Ripple is expected to file its response to the SEC’s remedies-related opening brief by April 22.
ImmutableX extends recovery despite $69 million IMX token unlock
ImmutableX unlocked 34.19 million IMX tokens worth over $69 million early on Friday. IMX circulating supply increased over 2% following the unlock. The Layer 2 blockchain token’s price added nearly 3% to its value on April 19.
Bitcoin Weekly Forecast: BTC post-halving rally could be partially priced in Premium

Bitcoin price briefly slipped below the $60,000 level for the last three days, attracting buyers in this area as the fourth BTC halving is due in a few hours. Is the halving priced in for Bitcoin? Or will the pioneer crypto note more gains in the coming days?
Bitcoin: BTC post-halving rally could be partially priced in Premium
Bitcoin (BTC) price briefly slipped below the $60,000 level for the last three days, attracting buyers in this area as the fourth BTC halving is due in a few hours. Is the halving priced in for Bitcoin? Or will the pioneer crypto note more gains in the coming days?