- XRP tests the bullish scenario and clings strongly to the upside.
- ETH/BTC consolidates in the bullish zone and prepares its ascent to the skies.
- Bitcoin and Ether move away from the combat zone in search of new upward forces.
Last week, the ETH/BTC pair managed to escape the bearish scenario that has kept it depressed since Christmas 2017.
Many analysts were expecting this breakout as a sign of change in the market – and it is finally happening. The evolution of the top ten altcoins against Bitcoin has been spectacular in the past few days – a basket of these assets would have improved its valuation in Bitcoin by around 25%.
Today the dominant color is red after the top three cryptocurrencies have reached the upper limits of the bearish scenario in which they run.
Well, maybe not all three. XRP managed to break the long term bearish channel upwards on Friday and is currently playing with the trend line, losing its support when writing these lines.
The magnitude of the decline is negligible compared to the previous gains. Reliable support is far away for Bitcoin and Ether, while XRP is rewarded after the upward breakout and could find very consistent support just 5% below.
ETH/BTC Weekly Chart
ETH/BTC is currently trading at 0.01906, down from 0.020 on Saturday. The presence of the SMA200 and SMA100 at that level already indicated that a breakout would be very difficult on the first attempt.
Above the current price, the first resistance level is at 0.020, then the second at 0.022 and the third one at 0.023.
Below the current price, the first support level is at 0.0188, then the second at 0.018 and the third one at 0.017.
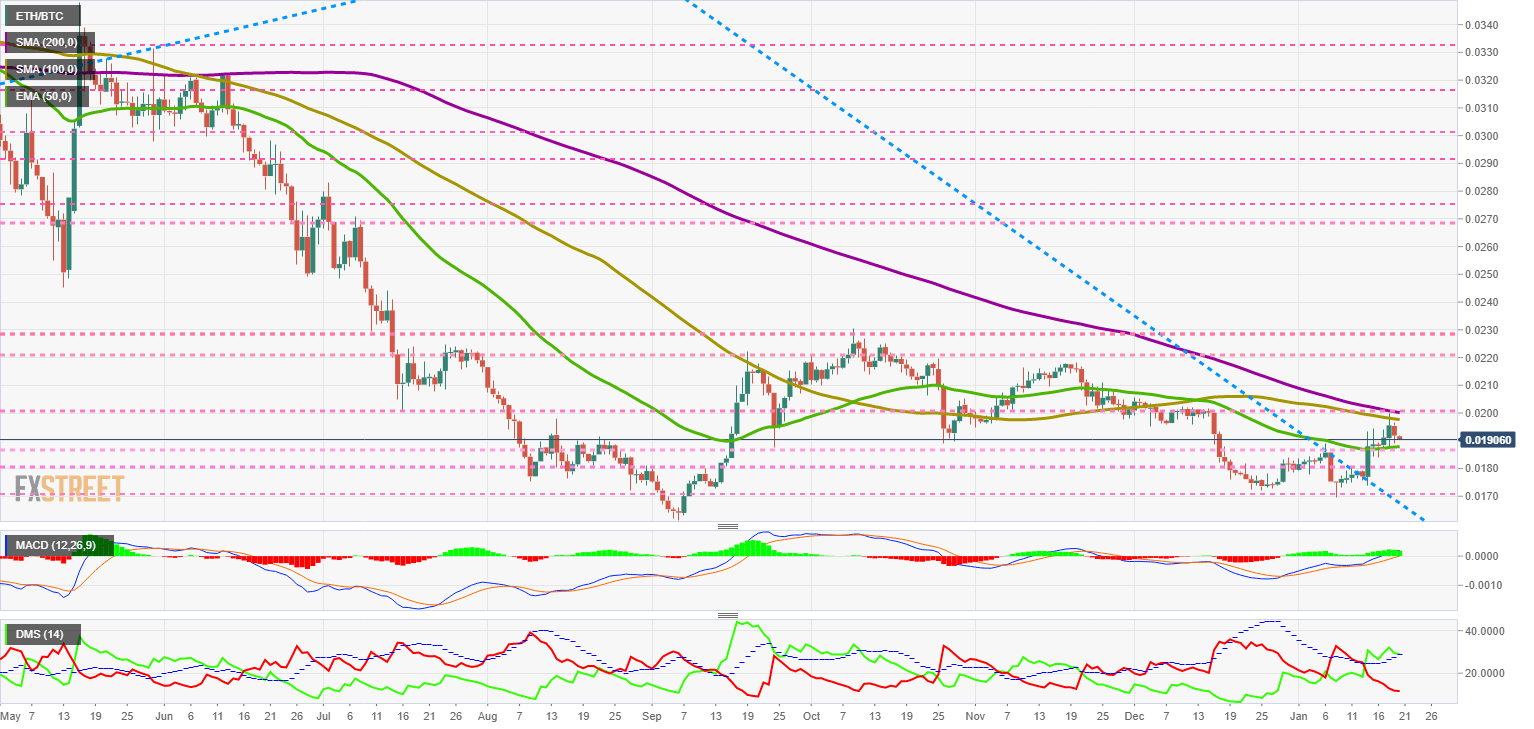 The MACD on the daily chart shows how the moving averages are already moving in a bullish direction. The opening between the lines and the slope continue to provide the optimal aspect for the bullish continuity.
The DMI on the daily chart shows bulls still above the ADX line – a situation that indicates the bullish trend is intact. The bears are losing some of their downward momentum, but continue to be at infrequent levels.
BTC/USD Weekly Chart
BTC/USD is currently trading at $8,635.5 after Sunday’s attempt to break the long term downward trend. At the intraday high, the presence of the SMA200 helped the trend line to hold.
The first significant support is at $8,000, although BTC/USD may not reach it due to the presence of buy positions between $8,400 and $8,500.
Above the current price, the first resistance level is at $8,800, then the second at $9,150 and the third one at $9,550.
Below the current price, the first support level is at $8,500, then the second at $8,150 and the third one at $8,000.
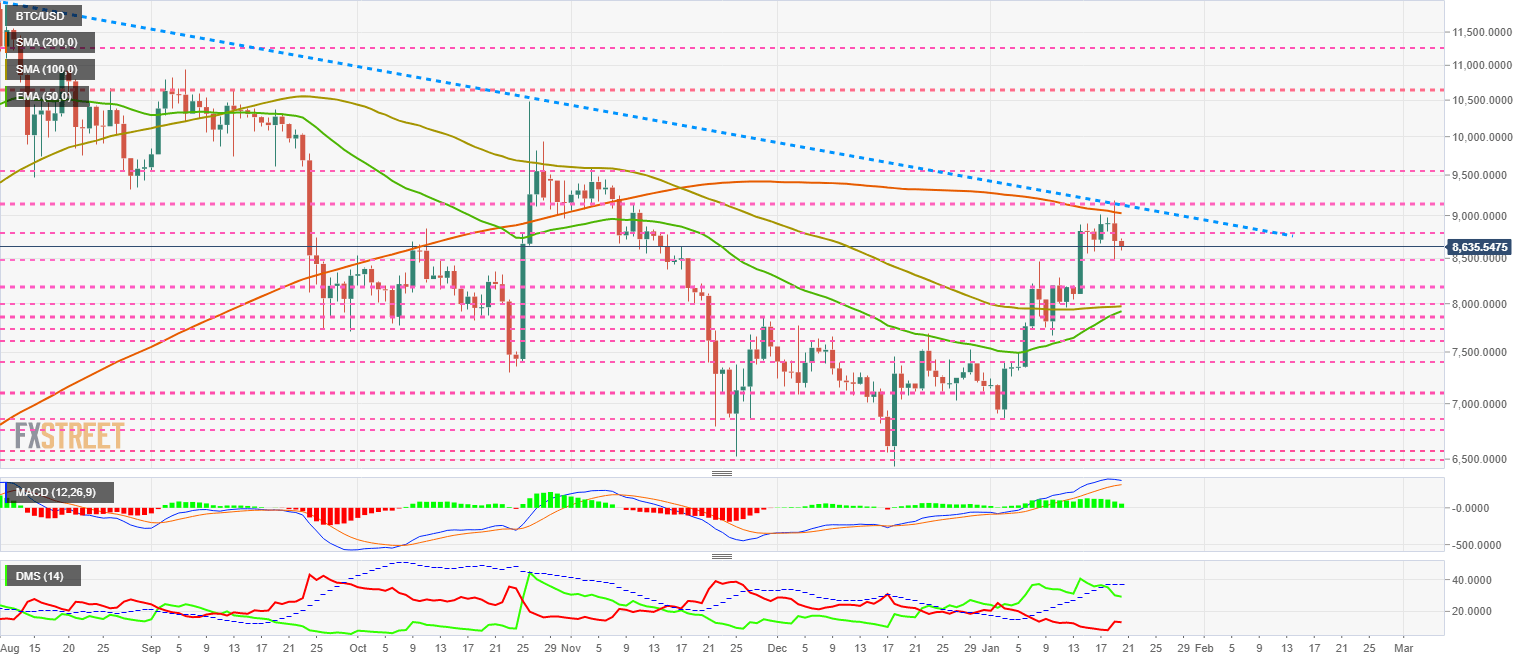 The MACD on the daily chart shows the loss of bullish momentum, with moving averages sloping lower and losing openness between the lines. The situation suggests a consolidation scenario in the short term.
The DMI on the daily chart shows the bulls losing support from the ADX line, which cancels the upward movement and leads to a lateral bullish scenario. The bears react to the bullish move and confirm the weakness in the BTC/USD price.
ETH/USD Weekly Chart
ETH/USD is currently trading at $164.5 after failing to cross the SMA200 in a big way. The failure was so clear that the Ether did not even touch the long term moving average.
Above the current price, the first resistance level is at $170, then the second at $180 and the third at $190.
Below the current price, the first support level is at $160, then the second at $155 and the third one at $150.
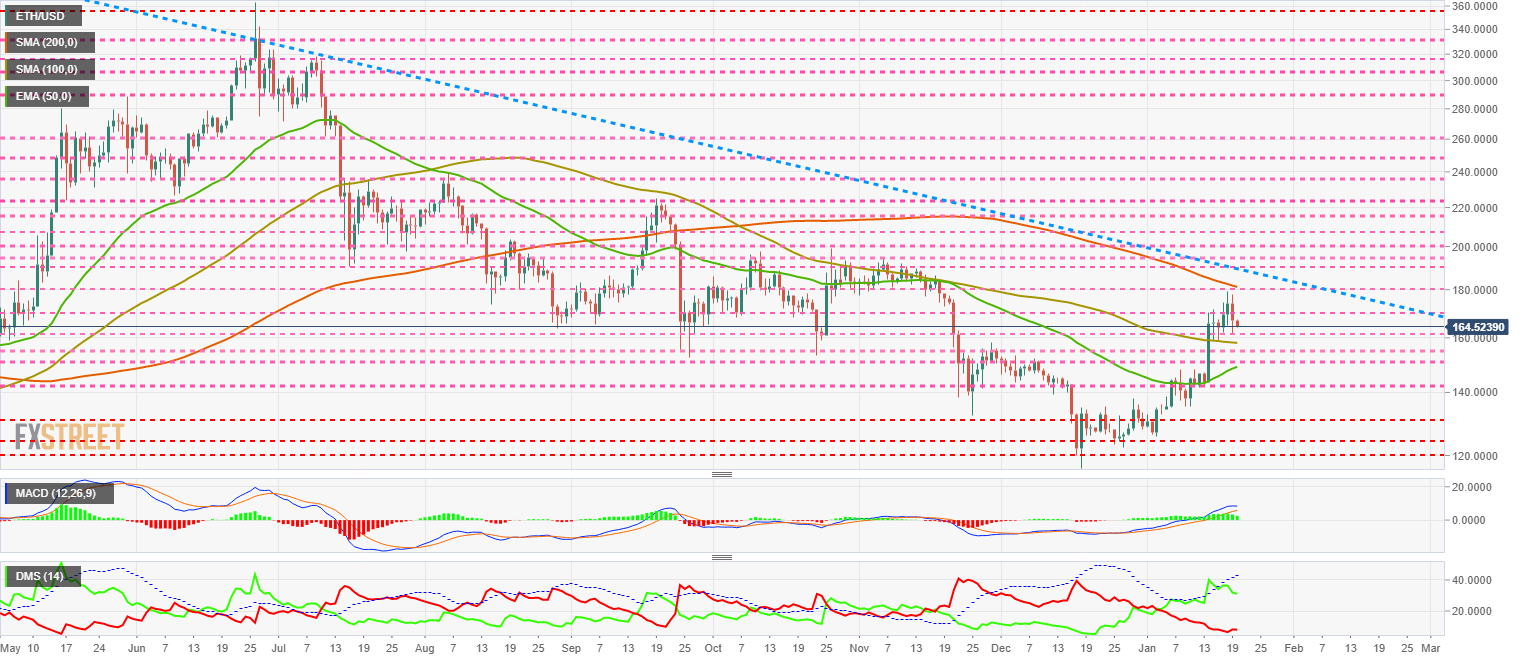 The MACD on the daily chart shows a loss of upward momentum, although the distance between the moving averages remains. The current setup suggests that the bullish trend will continue in its final stages.
The DMI on the daily chart shows the bulls below the ADX line, cancelling out the pure uptrend and indicating a proper rise from the exhausted trend. The bears are not reacting to the upward movement and do not appear to be confident of taking control of the pair in the near term.
XRP/USD Weekly Chart
XRP/USD is currently trading at $0.2308 and is clinging to the upper line of the long term bearish channel that now acts as support. If XRP gets a close above it, it will send a strong bullish message to the market.
Above the current price, the first resistance level is at $0.2422, then the second at $0.253 and the third one at $0.267.
Below the current price, the first support level is at $0.222, then the second at $0.214 and the third one at $0.197.
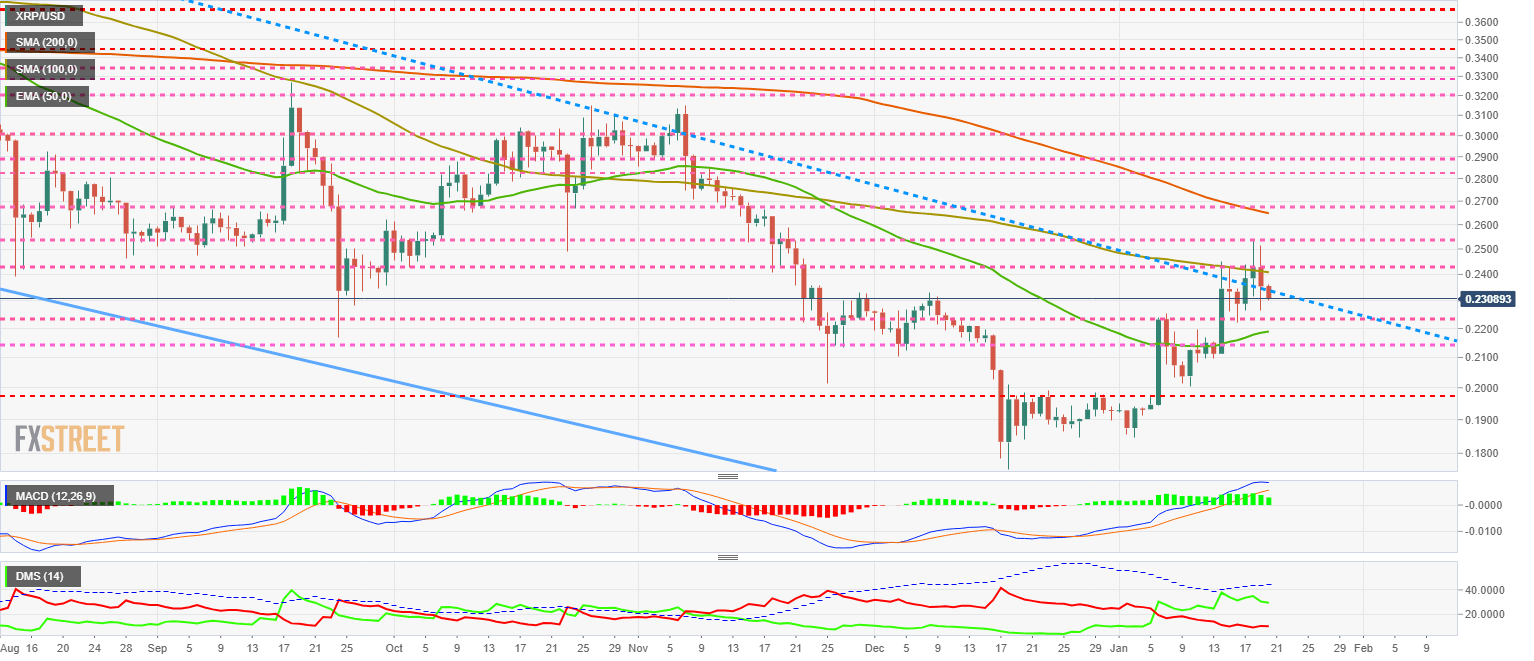 The MACD on the daily chart shows a loss of upward slope, although preserving the line separation. This setup proposes a terminal bullish scenario with a possible increase in volatility.
The DMI on the daily chart shows that the bulls are unable to break the ADX line, but maintain control of the pair with this unfavorable setting. Bears also see it that way, as they remain at low levels and barely react to the upward movement.
Get 24/7 Crypto updates in our social media channels: Give us a follow at @FXSCrypto and our FXStreet Crypto Trading Telegram channel
Information on these pages contains forward-looking statements that involve risks and uncertainties. Markets and instruments profiled on this page are for informational purposes only and should not in any way come across as a recommendation to buy or sell in these assets. You should do your own thorough research before making any investment decisions. FXStreet does not in any way guarantee that this information is free from mistakes, errors, or material misstatements. It also does not guarantee that this information is of a timely nature. Investing in Open Markets involves a great deal of risk, including the loss of all or a portion of your investment, as well as emotional distress. All risks, losses and costs associated with investing, including total loss of principal, are your responsibility. The views and opinions expressed in this article are those of the authors and do not necessarily reflect the official policy or position of FXStreet nor its advertisers. The author will not be held responsible for information that is found at the end of links posted on this page.
If not otherwise explicitly mentioned in the body of the article, at the time of writing, the author has no position in any stock mentioned in this article and no business relationship with any company mentioned. The author has not received compensation for writing this article, other than from FXStreet.
FXStreet and the author do not provide personalized recommendations. The author makes no representations as to the accuracy, completeness, or suitability of this information. FXStreet and the author will not be liable for any errors, omissions or any losses, injuries or damages arising from this information and its display or use. Errors and omissions excepted.
The author and FXStreet are not registered investment advisors and nothing in this article is intended to be investment advice.
Recommended Content
Editors’ Picks
Dogwifhat price pumps 5% ahead of possible Coinbase effect

Dogwifhat (WIF) price recorded an uptick on Thursday, going as far as to outperform its peers in the meme coins space. Second only to Bonk Inu (BONK), WIF token’s show of strength was not just influenced by Bitcoin (BTC) price reclaiming above $63,000.
Runes likely to have massive support after BRC-20 and Ordinals frenzy

PUPS, WZRD, and PEPE are gaining liquidity through Bitcoin Ordinals. Creator of Bitcoin’s Ordinals protocol is debuting a new fungible token standard to rival BRC-20, Runes.
Ethereum shows firm support at key level as its correlation with US indices increase

Ethereum's price continued a sideways movement on Thursday as the market still awaits a trigger. Ethereum isn't alone in this horizontal trend; several major index funds have also traded sideways.
Mango Market attacker convicted of fraud and market manipulation

Mango Market attacker Avi Eisenberg was convicted by a federal jury on Thursday for "fraudulently obtaining" funds from the Solana-based decentralized exchange (DEX). He could face up to 20 years in prison for his role in the $110 million attack.
Bitcoin: BTC’s rangebound movement leaves traders confused

Bitcoin (BTC) price has been hovering around the $70,000 psychological level for a few weeks, resulting in a rangebound movement. This development could lead to a massive liquidation on either side before a directional move is established.