Top 3 Price Prediction Bitcoin, Ethereum, XRP: Bitcoin dominance in play for a full bull run
- Bitcoin's dominance chart now sets the future for the entire market.
- XRP comes into play and moves strongly to take over from the big two, Bitcoin and Ether.
- Bitcoin could go into a lateral-bullish mode for a few days.

Bitcoin is testing the bullish trend of the chart's dominance over the rest of the market. The guideline has its origin in January 2018, where it started after the strong upward movement at the end of 2017.
This chart is critical to understand where the crypto market is and where it can go.
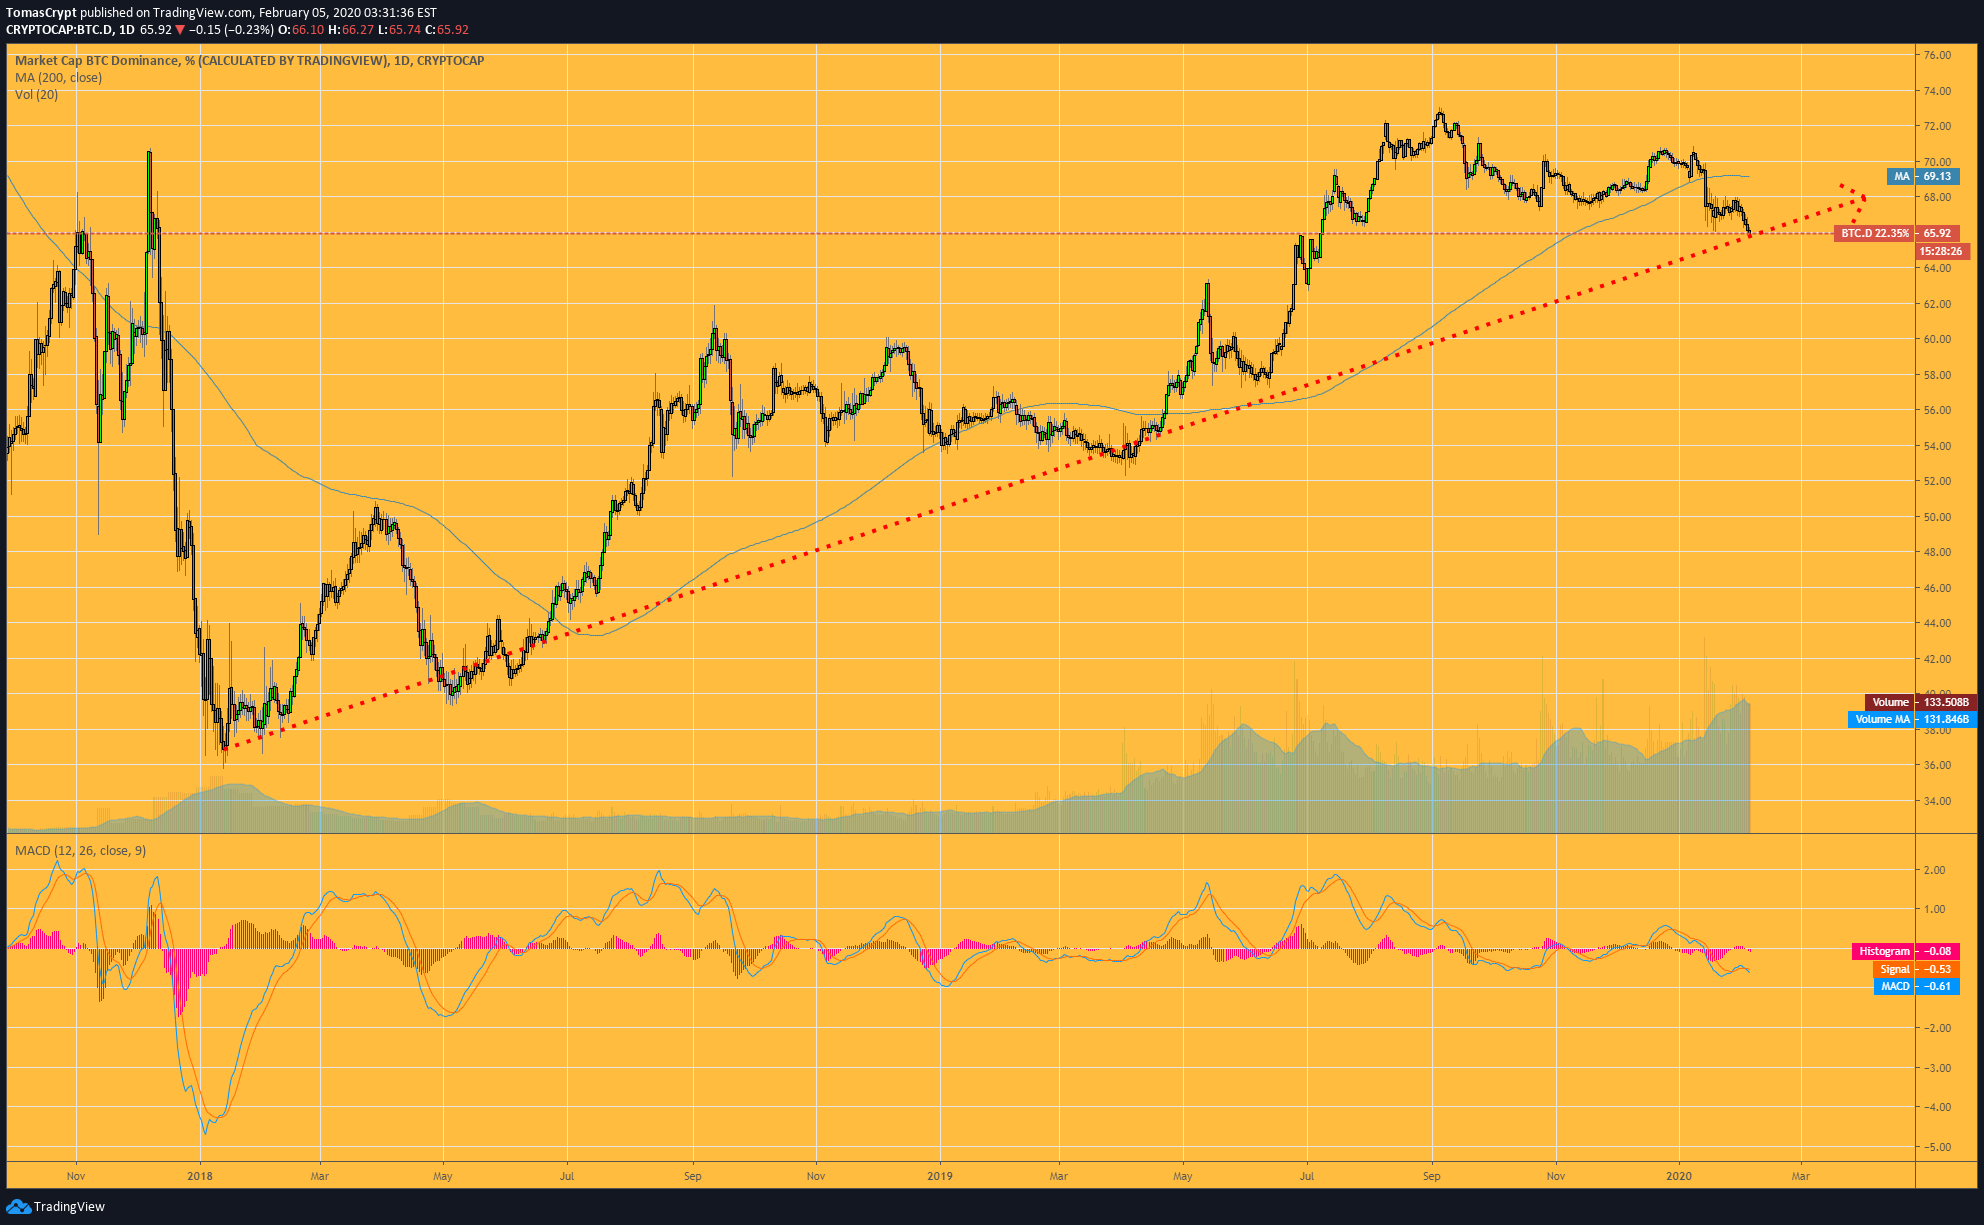
Scenario a:
Bitcoin continues to increase its dominance over the market. This continuation of the trend would cause a slowdown in the excellent performance of Altcoins and capital would flow into Bitcoin. In a future moment, the dominance level would be very deviated from the trend line, and the movement would revert as it already happened in September 2018 and 2019. This reversal to the trend would bring improvements for the Altcoins.
Scenario b:
Bitcoin dominance chart loses the current trend line. This would initiate a significant downward movement like the one that occurred during 2017 and that culminated in the historically high levels for both the Bitcoin and the Altcoins. Probably in the future, the dominance level would find support and begin a new upward phase.
The leader of the day is XRP, continuing the bullish festival that started yesterday at the beginning of the American session.
While King Bitcoin and Altcoin leader Ether are taking it easy, the Altcoins in the second row appears to maintain a positive tone in the market.
The European morning leaders are XRP (+10.51%), MIOTA (+26.38%) and Stellar Lumens (7.83%).
ETH/BTC Daily Chart
The ETH/BTC pair is currently trading at the price level of 0.02066. This crypto pair has a direct relationship to Bitcoin's dominance over the rest of the market.
The technical configuration of the ETH/BTC pair gives us information about the possible resolution of this technical moment.
The profile of the moving averages shows a bullish cross developing but far from complete. The time it takes to complete it is the time that the Bitcoin dominance chart will take to be defined as well.
Above the current price, the first resistance level is at 0.021, then the second at 0.022 and the third one at 0.023.
Below the current price, the first support level is at 0.020, then the second at 0.0195 and the third one at 0.0187.
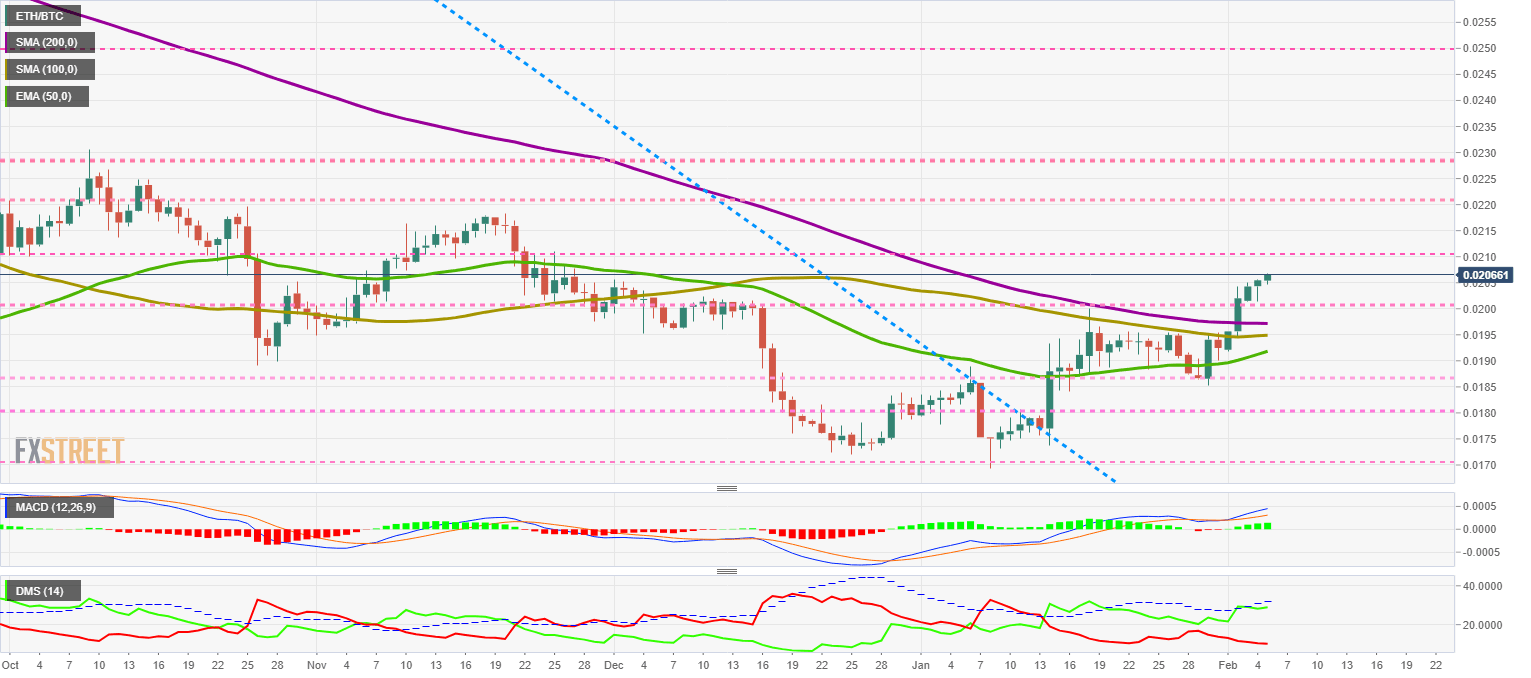
The MACD on the daily chart is gaining in openness and bullish momentum, showing a significant upward movement pattern.
The DMI on the daily chart shows that the bulls are gaining strength again despite failing to break the ADX line. Bears continue to lose ground and have no confidence in regaining the lead in the short term.
BTC/USD Daily Chart
BTC/USD is currently trading at the price level of $9241 and confirms the strength of support at the $9200 level. The arrival of the Bitcoin dominance chart at the trend line could drive the price higher.
Above the current price, the first resistance level is at $9500, then the second at $10750 and the third one at $11250.
Below the current price, the first support level is at $9200, then the second at $8750 and the third one at $8500.
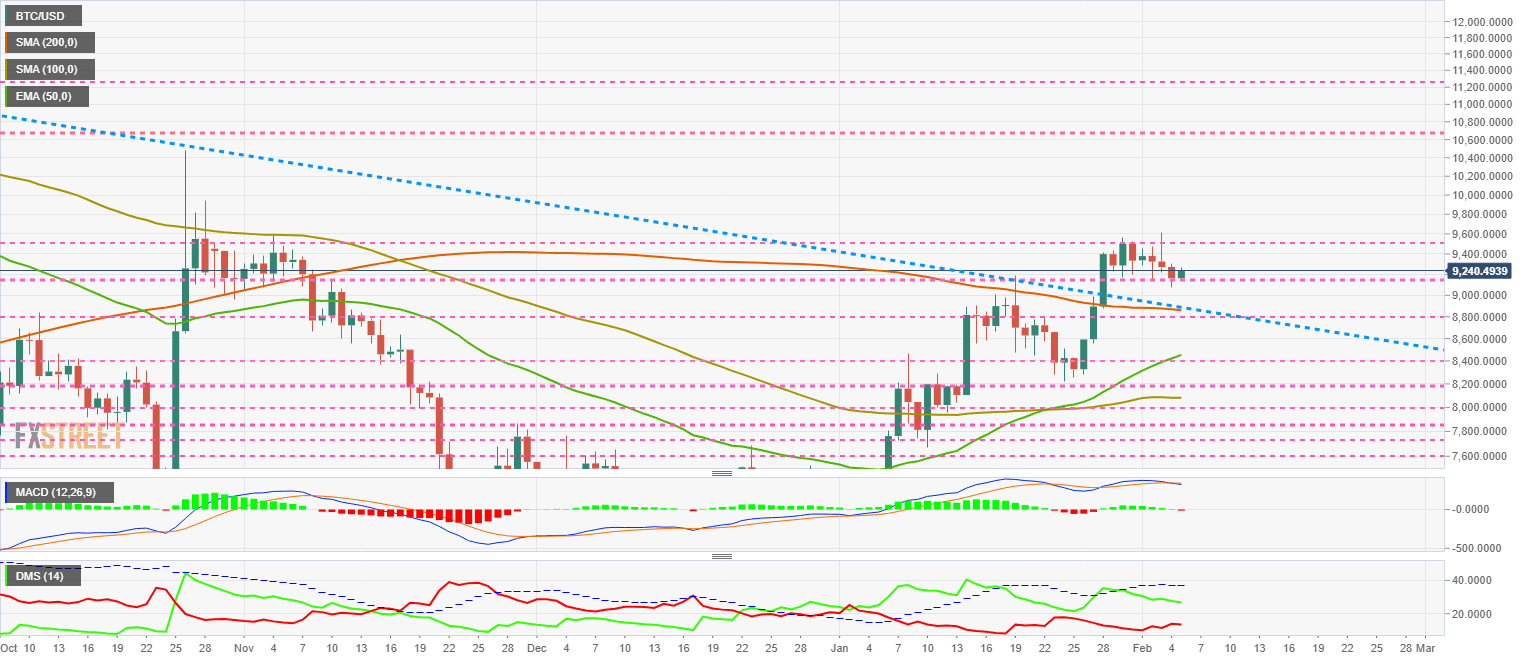
The MACD on the daily chart shows a complete but undeveloped bearish cross. The current profile suggests a loss of upward momentum and a more than likely lateral downward development.
ETH/USD Daily Chart
ETH/USD is currently trading at the price level of $190.93 on the fourth day of trying to break the price congestion resistance level at $190.
Above the current price, the first resistance level is at $195, then the second at $200 and the third one at $206.
Below the current price, the first support level is at $180, then the second at $170 and the third one at $160.
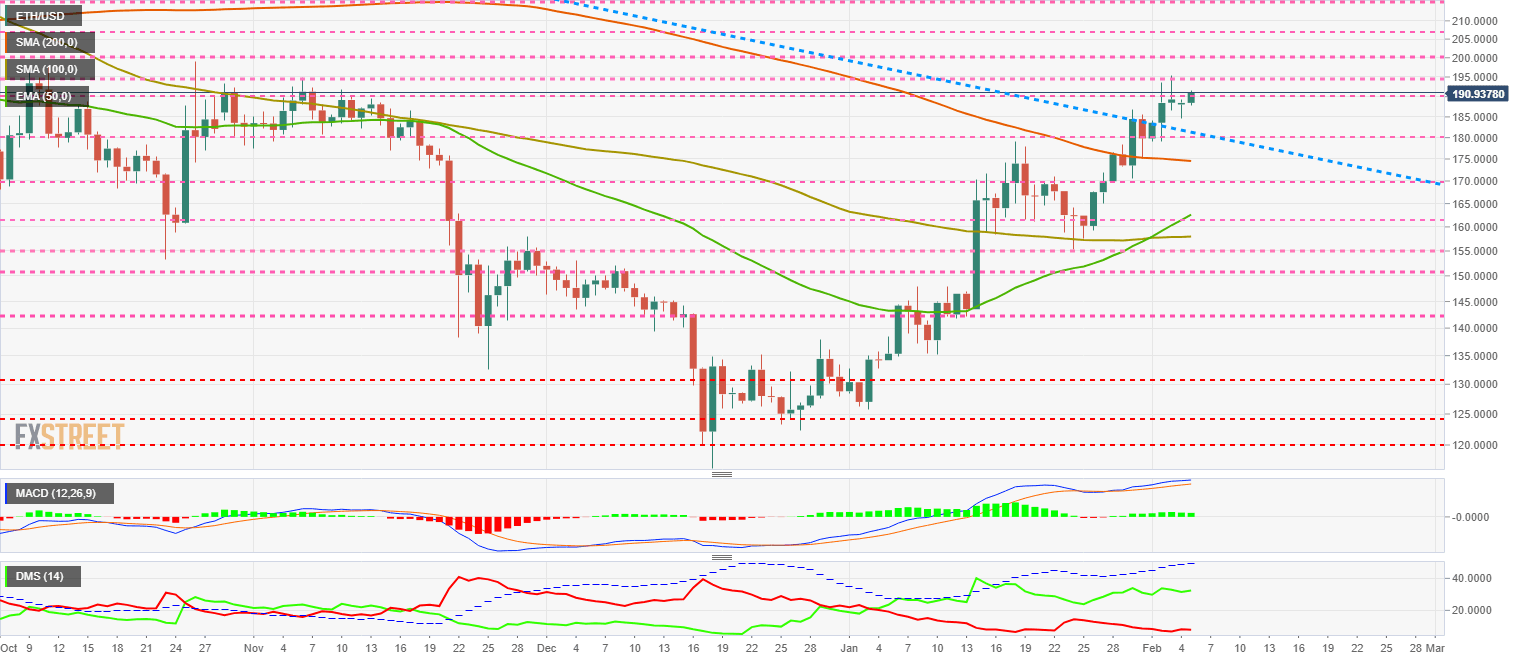
The DMI on the daily chart shows bulls increasing their trend force, while bears react from lows and improve their appearance a bit.
XRP/USD Daily Chart
XRP/USD is currently trading at $0.2785 after a first attempt at the $0.28 level. Today's significant rise immediately followed yesterday's move above the SMA200. Ripple’s XRP is approaching a complex zone full of resistance, a barrier that doesn't end until it passes $0.315.
Above the current price, the first resistance level is at $0.28, then the second at $0.29 and the third one at $0.30.
Below the current price, the first support level is at $0.27, then the second at $0.255 and the third one at $0.24.
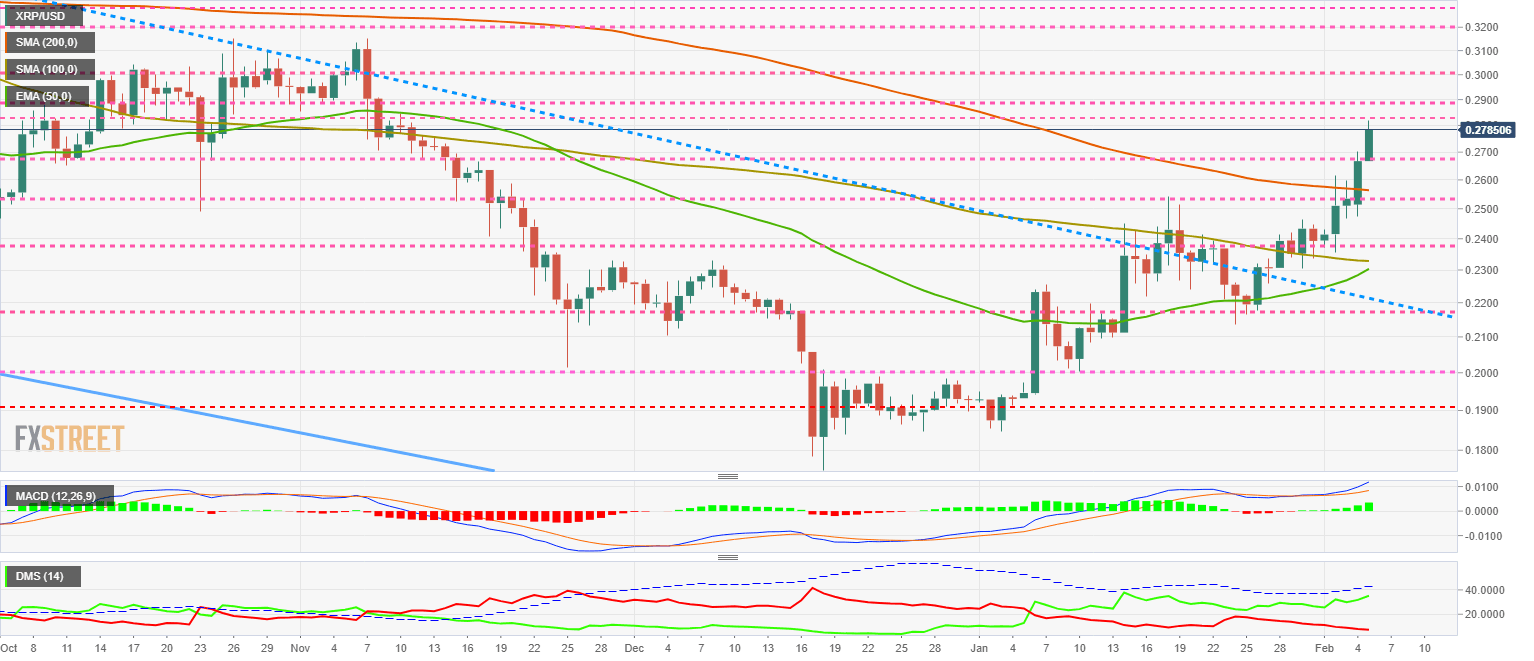
The MACD on the daily chart is opening sharply higher and is also steeply rising. The pattern is very bullish in the short term.
The DMI on the daily chart shows the bulls increasing their trend force, although they are unable to get above the ADX line. The bears continue to retreat and give up the fight for the leadership on the buying side.
Get 24/7 Crypto updates in our social media channels: Give us a follow at @FXSCrypto and our FXStreet Crypto Trading Telegram channel
Author

Tomas Salles
FXStreet
Tomàs Sallés was born in Barcelona in 1972, he is a certified technical analyst after having completing specialized courses in Spain and Switzerland.