- The main pairs of the market reach limit levels, traditional buying areas for professionals.
- The active bullish patterns in the technical indicators of Bitcoin and Ethereum are surprising.
- The market has quickly reached an oversold zone, but the pain can last until the end of the year.
The day's headlines focus on finding culprits for recent falls along with the crypto board.
In my opinion, excuses should not be sought. The current movement develops within a purely technical story, and pointing out any given reason can help us dramatize the moment.
An unpleasant, disillusioning story that is difficult to look directly at because of the anguish it can generate.
Fortunately, technical analysis provides us with tools to contextualize the current moment and discover the possible opportunities hidden behind the negativity of the moment.
Opportunities appear in times of crisis, and for those who still find the crypto market attractive, the chances are there.
ETH/BTC Daily Chart
ETH/BTC is currently trading at the price level of 0.0183 and is losing more than 10% on the last three days, with fear driving the market.
The price once lost the magic support at the 0.20 level, has collapsed on the confluence of two trend lines originating from the two most critical relative lows in recent years. The first occurred in December 2016 (A), while the second occurred in September (B) this year.
I want to highlight that December 2016 marked the beginning of the last bull market in the crypto market.
The information provided by this chart is, in my opinion, enough to have reliable scenarios.
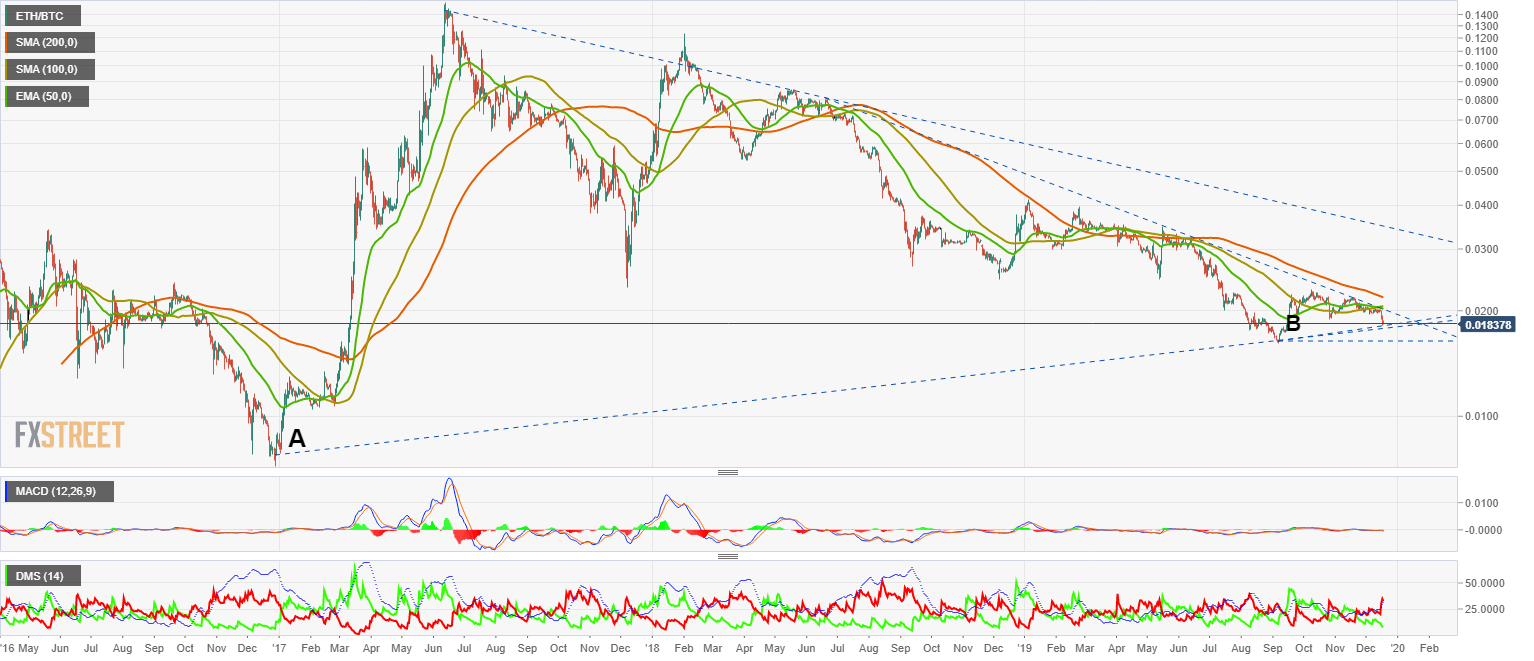
Below these trend lines, the pair ETH/BTC lost the bullish triangle that was born in December 2016. You can give it some margin up to the relative minimum at 0.016408. The bearish break of this support would activate a massive movement of money from the Ethereum to the Bitcoin.
Above the current price, the situation can worsen if the ETH/BTC does not recover the 0.020 price level. It is a probable move since the SMA100 and the EMA50 move at that price level. Even the SMA200 at 0.022 is a point of upward attraction.
I want to highlight the situation of the leading moving averages. All three averages enter the bullish zone of the scenario and with quite a margin of distance to the bearish zone.
The MACD on the daily chart does not reflect the strength of the movement. The lines are leaning lower but are barely able to open between them. The current structure should allow a quick turn upwards.
The DMI on the daily chart reflects –here it does– the impact of the drop on the indicator. The bears explode to the upside and exceed the line of ADX, which activates a bearish pattern in the short term. The bulls are going to levels not seen since December 2016!
BTC/USD Daily Chart
The BTC/USD pair is currently trading at the price level of $6631 and stops falling for the time being as it finds support in one of the trendlines born in December 2018 (B). At the time of writing these lines, the candle is green, which confirms that the support is minimally considered valid.
Below the current price, the BTC/USD pair has two opportunities to stay within the bullish scenario that was born in December 2018 (A). The first support level (C) goes through $5,480 today and coincides with Fibonacci's 23.6% retracement level of all previous rally. The second support level (D) at $4,400. If BTC/USD lost the support (D), the current bullish trend would fail and we could consider any lower price level.
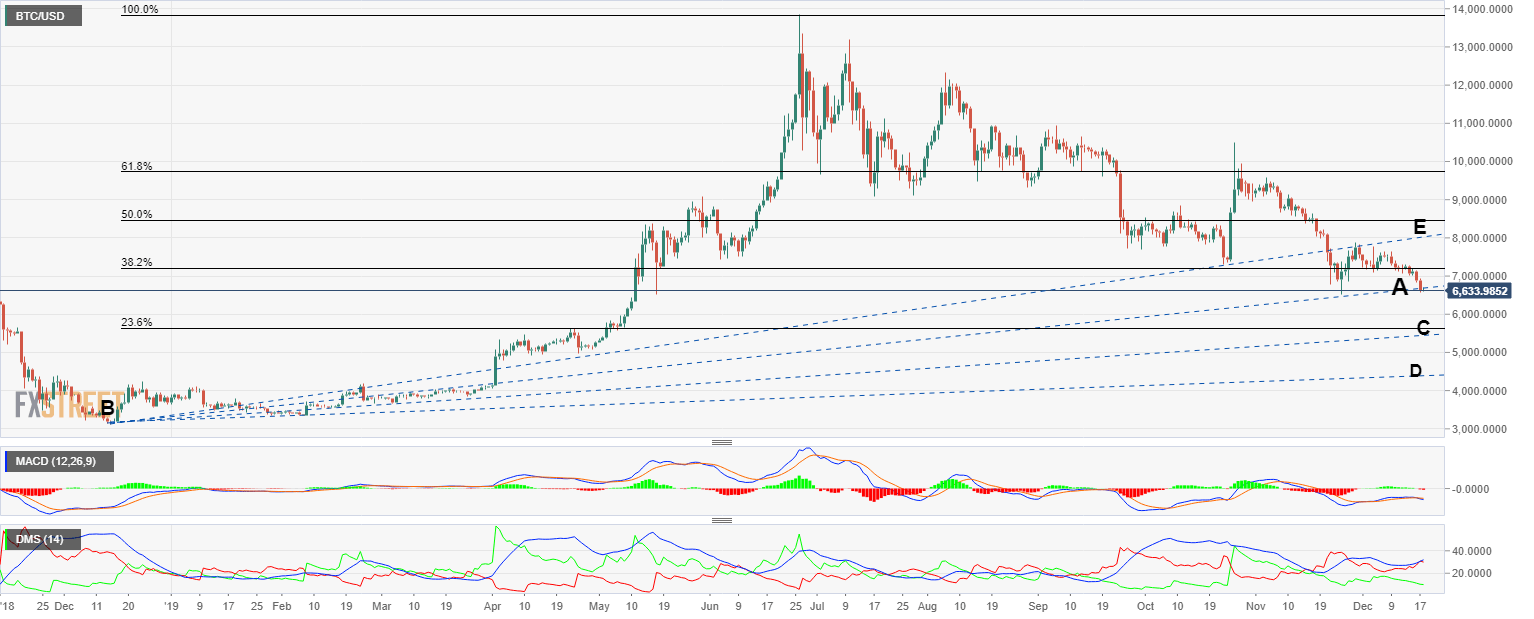
Above the current price, the first trend line (E) is at $8.075, then the second resistance at the Fibonacci retracement level 50% of the entire previous rise.
The MACD on the daily chart does not show the strength of the bearish movement, and although it inclines downward, it fails to open between the lines.
The DMI on the daily chart shows how the bears are climbing sharply, but crashing into the ADX line and, surprisingly, activating a bullish pattern! The bulls, in spite of the falls, show divergences from the lows at the end of November.
ETH/USD Daily Chart
ETH/USD is traded at the price level of $121.8, supported by a price congestion level (A) at $120. Ethereum is not within a bullish structure according to the current chart available. The only decisive factor in the pair is the situation of the leading moving averages, which move above the bearish trend line (B) from the June highs. The main moving averages are a strong price attractor, and running within the bullish scenario is hopeful.
Below the current price, the first support level is at $120 (A), then the second price congestion support level at $100 (D) and the third one at $82 (E).
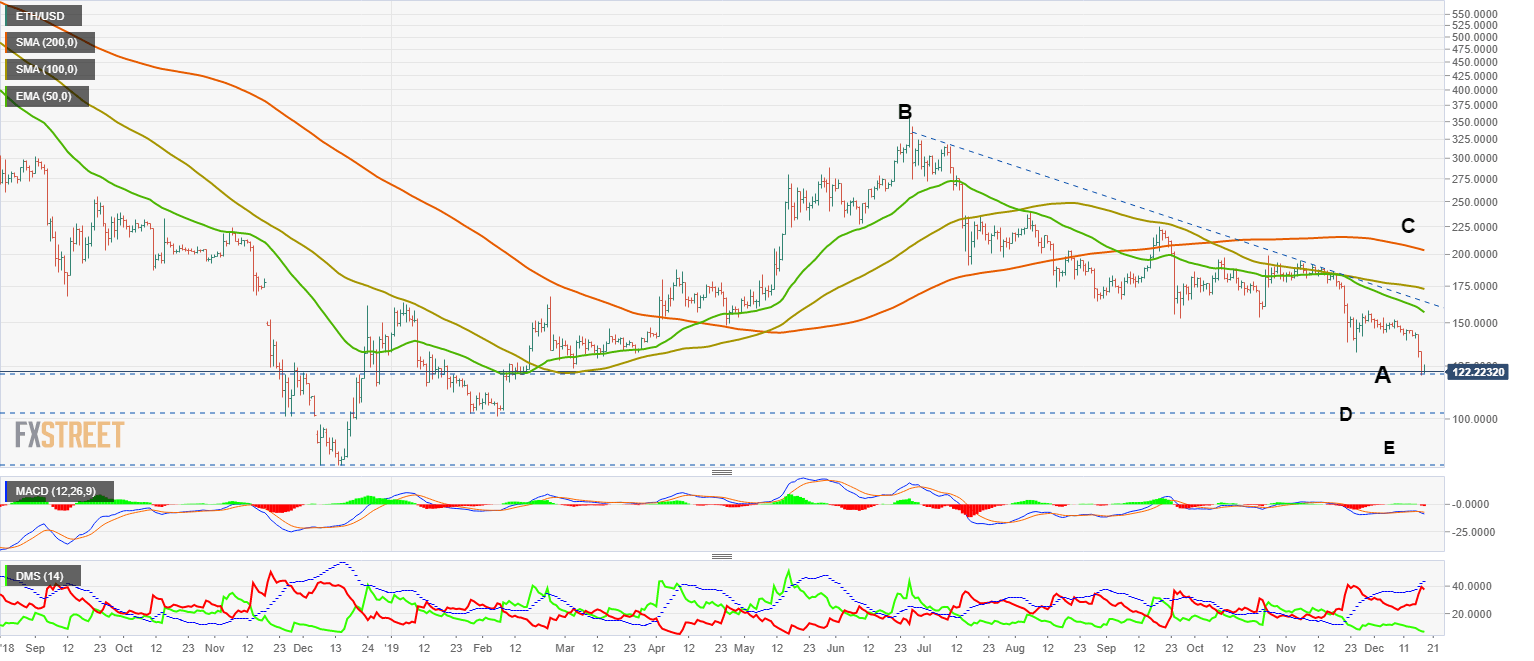
Above the current price, the first resistance level is at $160 (EMA50), then the second at $162 (B) and the third one in the long term moving averages (C) zone.
The MACD on the daily chart shows a downwardly inclined profile but hardly any opening between the lines.
The DMI on the daily chart shows bears shooting upwards even though they do not make it past the ADX line. This structure, for the moment, activates an upward pattern!
XRP/USD Daily Chart
XRP/USD is currently trading at the $0.18 price level and is dropping the $0.20 support that had worked since the last months of 2017. The macrostructure of the XRP/USD is bearish, with no bullish trend to take refuge in.
Below the current price, the first price (A) congestion support is at $0.18. This level is reinforced by the bearish trend line that is ruling the price movement of the XRP since April 2017. The second support level (B) is $0.15. Below this support level, the scenario is uncertain and could take the price to the $0.10 zone.
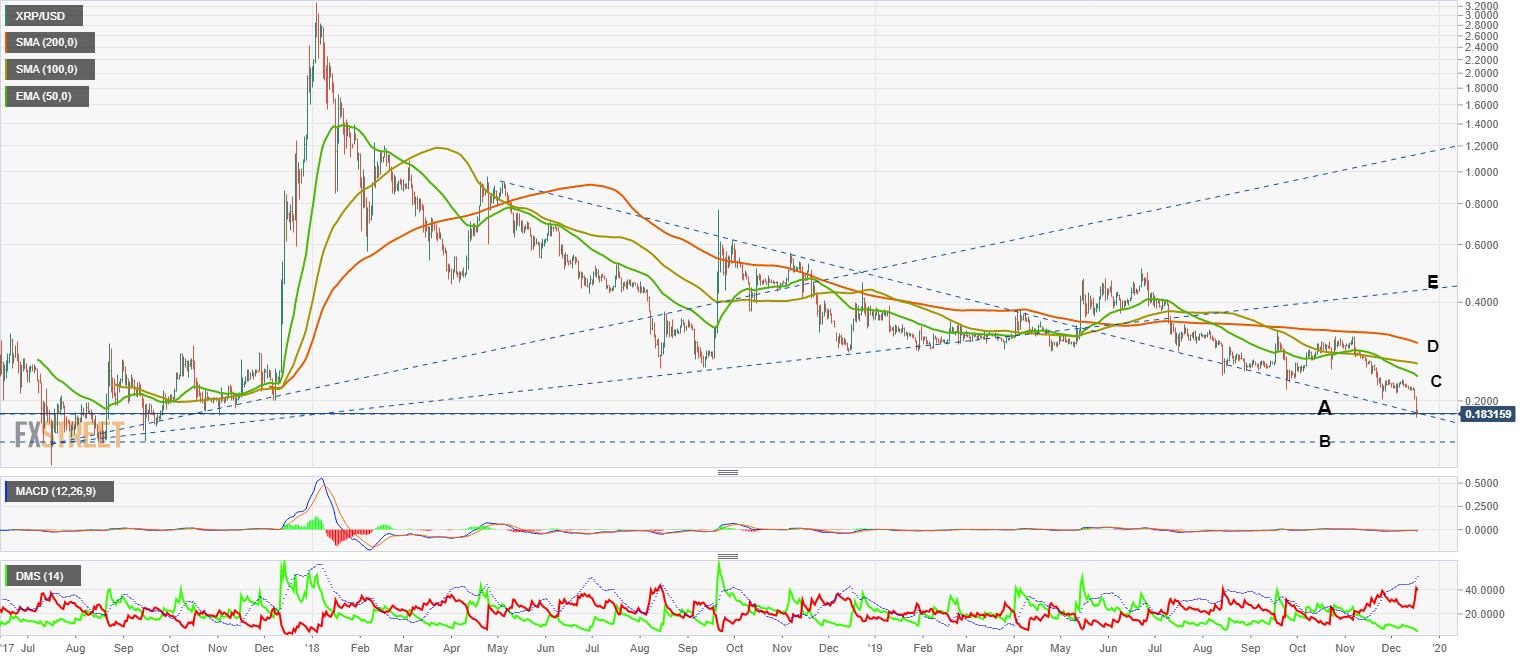
Above the current price, the first resistance level is in the confluence zone (C) of the EMA50 and the SMA100 at the $0.25 price level. The second resistance level is formed by the SMA200 (D) at $0.30. The XRP/USD pair will not enter a bullish scenario if it does not breach the first line of the trend (E) by $0.44.
The MACD on the daily chart shows little bearishness and no opening. We have to wait a few days to get reliable information.
The DMI on the daily chart shows how the bears move quickly upwards but remain below the ADX line, which cancels the activation of the bearish trend. Bulls go extreme levels not seen since late 2016 — possible bullish rebound in play.
Get 24/7 Crypto updates in our social media channels: Give us a follow at @FXSCrypto and our FXStreet Crypto Trading Telegram channel
Information on these pages contains forward-looking statements that involve risks and uncertainties. Markets and instruments profiled on this page are for informational purposes only and should not in any way come across as a recommendation to buy or sell in these assets. You should do your own thorough research before making any investment decisions. FXStreet does not in any way guarantee that this information is free from mistakes, errors, or material misstatements. It also does not guarantee that this information is of a timely nature. Investing in Open Markets involves a great deal of risk, including the loss of all or a portion of your investment, as well as emotional distress. All risks, losses and costs associated with investing, including total loss of principal, are your responsibility. The views and opinions expressed in this article are those of the authors and do not necessarily reflect the official policy or position of FXStreet nor its advertisers. The author will not be held responsible for information that is found at the end of links posted on this page.
If not otherwise explicitly mentioned in the body of the article, at the time of writing, the author has no position in any stock mentioned in this article and no business relationship with any company mentioned. The author has not received compensation for writing this article, other than from FXStreet.
FXStreet and the author do not provide personalized recommendations. The author makes no representations as to the accuracy, completeness, or suitability of this information. FXStreet and the author will not be liable for any errors, omissions or any losses, injuries or damages arising from this information and its display or use. Errors and omissions excepted.
The author and FXStreet are not registered investment advisors and nothing in this article is intended to be investment advice.
Recommended Content
Editors’ Picks
Dogwifhat price pumps 5% ahead of possible Coinbase effect

Dogwifhat (WIF) price recorded an uptick on Thursday, going as far as to outperform its peers in the meme coins space. Second only to Bonk Inu (BONK), WIF token’s show of strength was not just influenced by Bitcoin (BTC) price reclaiming above $63,000.
Runes likely to have massive support after BRC-20 and Ordinals frenzy

PUPS, WZRD, and PEPE are gaining liquidity through Bitcoin Ordinals. Creator of Bitcoin’s Ordinals protocol is debuting a new fungible token standard to rival BRC-20, Runes.
Ethereum shows firm support at key level as its correlation with US indices increase

Ethereum's price continued a sideways movement on Thursday as the market still awaits a trigger. Ethereum isn't alone in this horizontal trend; several major index funds have also traded sideways.
Mango Market attacker convicted of fraud and market manipulation

Mango Market attacker Avi Eisenberg was convicted by a federal jury on Thursday for "fraudulently obtaining" funds from the Solana-based decentralized exchange (DEX). He could face up to 20 years in prison for his role in the $110 million attack.
Bitcoin: BTC’s rangebound movement leaves traders confused

Bitcoin (BTC) price has been hovering around the $70,000 psychological level for a few weeks, resulting in a rangebound movement. This development could lead to a massive liquidation on either side before a directional move is established.