- Despite the limited falls, fear leads market sentiment.
- Ripple has chances to surprise on the upside, targeting $0.213.
- Market shows no direction in the short term.
The market falls back to sleep after the scare of the beginning of the week and leaves prices adrift waiting for a new surprise move.
The BTC/USD pair failed to close within the bullish quadrant on the chart yesterday, remaining now within an expansive triangular structure that offers ample room for the development of the Bitcoin price in the run-up to the end of the year. On the upside, the ceiling is at $18400, while the maximum target on the downside is $7300.
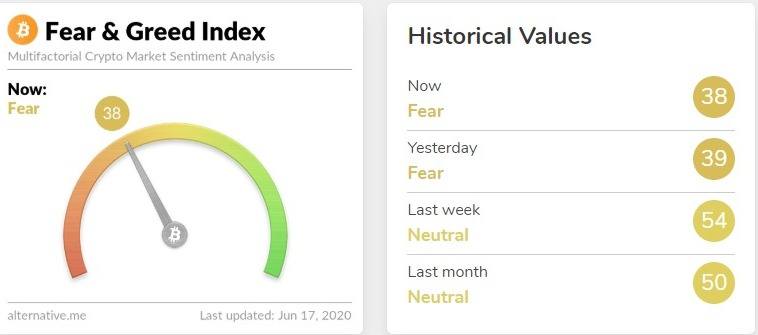
Source: alternative.me
Market sentiment remains weak, with today's reading at 39 (fear) from yesterday's 38. This market remains fearful and finds it very difficult to look favorably at the price development in the short term.
ETH/BTC Daily Chart
The ETH/BTC pair is currently trading at 0.02246 after a slight rise yesterday and today following the opening of the Asian market. The price continues to fall below the price congestion resistance at 0.025, as the triangular pattern in the price narrows and potential breakout approaches.
Above the current price, the first level of resistance is at 0.025, then the second at 0.0252 and the third one at 0.026.
Below the current price, the first support level is at 0.0235, then the second at 0.0225 and the third one at 0.0221.
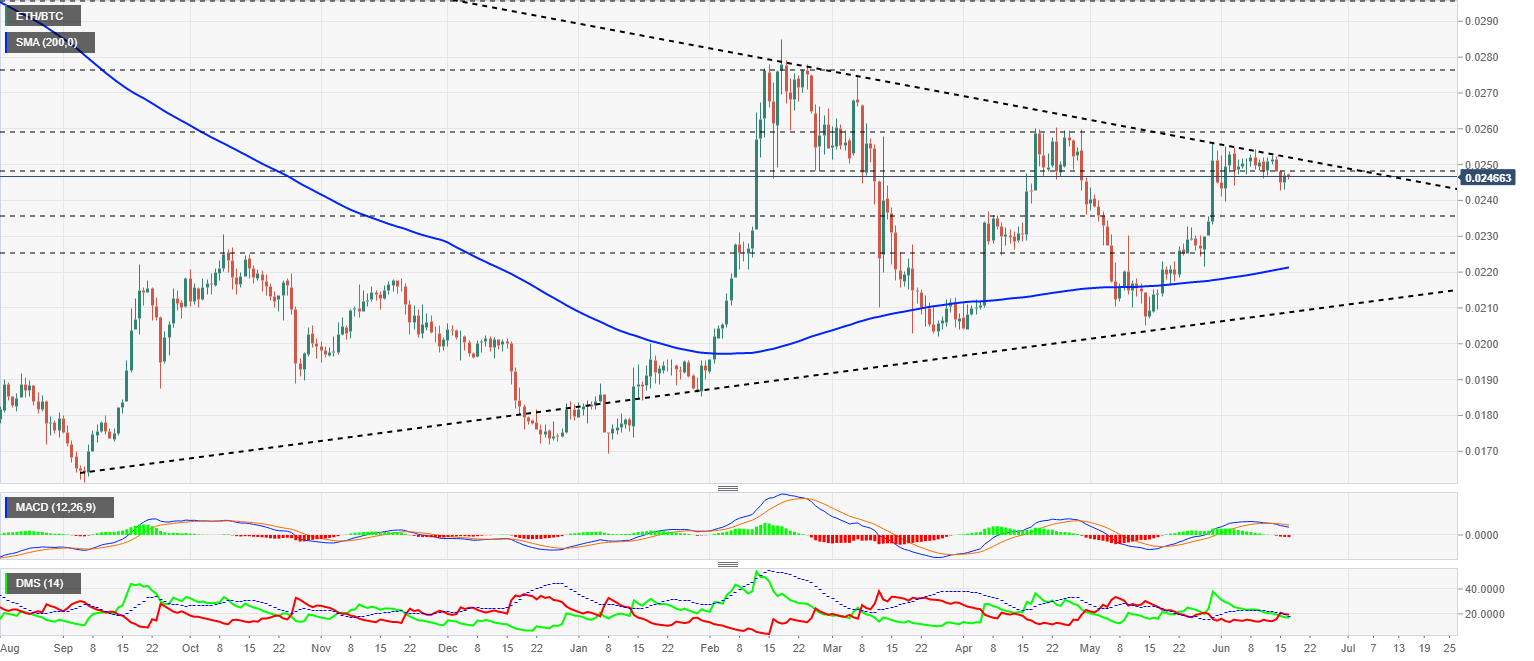
The MACD on the daily chart continues to show an active bearish cross but does not yet have the necessary slope or opening to see a significant downward movement.
The DMI on the daily chart is a perfect representation of the bearish, neutral situation. The bears are barely holding above the ADX line and are returning to the level of the bulls. A violent breakout is possible in either direction.
BTC/USD Daily Chart
The BTC/USD pair is currently trading at the price level of $9486, just above the price support/resistance price level of $9475. The opportunity for Bitcoin to move into a fully-fledged bullish scenario is fading away, and only a robust bullish reaction could turn it around from the current neutral scenario.
Above the current price, the first resistance level is at $9600, then the second at $10400 and the third one at $11350.
Below the current price, the first support level is at $9470, then the second at $9100 and the third one at $8550.
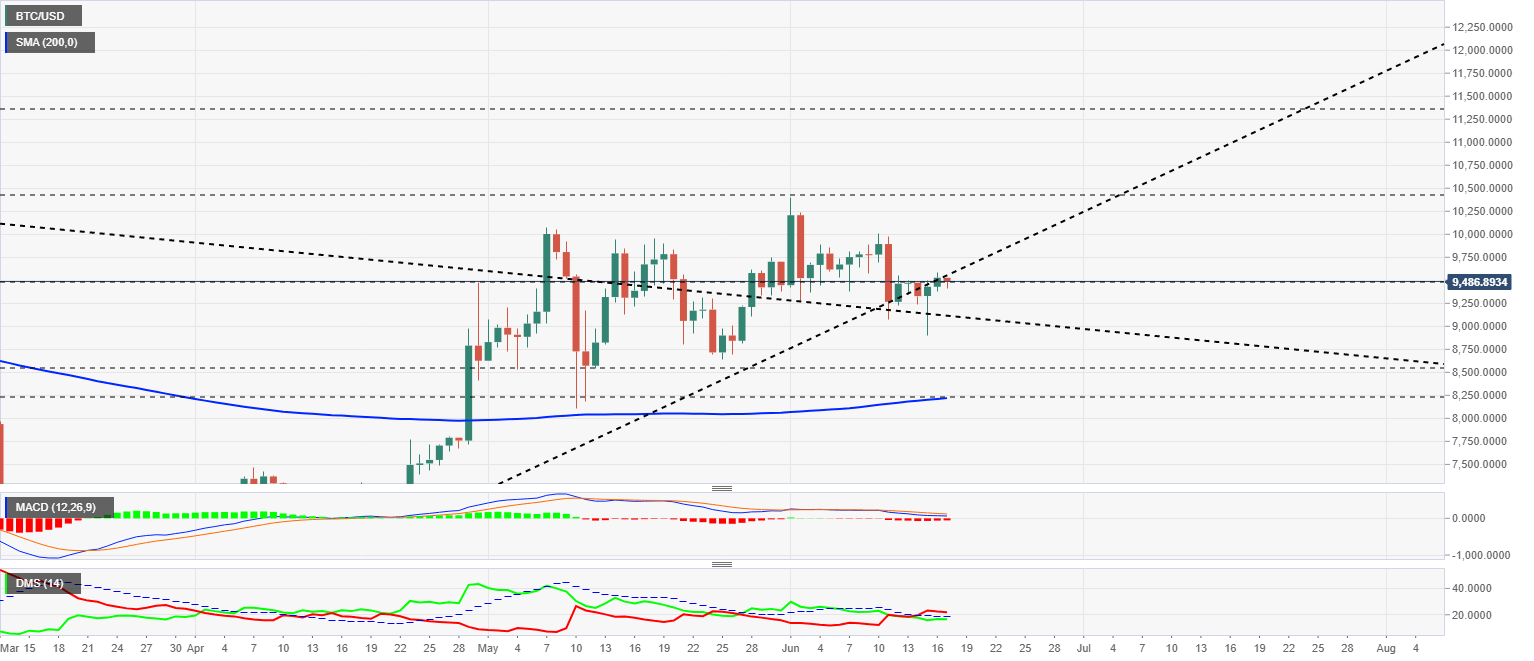
The MACD on the daily chart continues to crawl above the neutral level of the indicator, crossing downwards but with a very flat and dull profile. The most likely exit from the current structure implies a considerable increase in volatility.
The DMI on the daily chart shows the bears retaining the advantage gained in the last few days, which does not prevent the bulls from continuing to be at optimal levels for an attack on the bearish positions.
ETH/USD Daily Chart
The ETH/USD pair is currently trading at the $234.7 price level and is managing to stay in the upper range of the current structure. The primary bullish trend line, which comes from the December 2019 lows, offers support within the long-term bearish channel. The 200-day simple moving average is still moving at the $190 level, taking a very positive upward profile for the price.
Above the current price, the first resistance level is at $250, then the second at $267 and the third one at $285.
Below the current price, the first support level is at $230, then the second at $220 and the third one at $200.
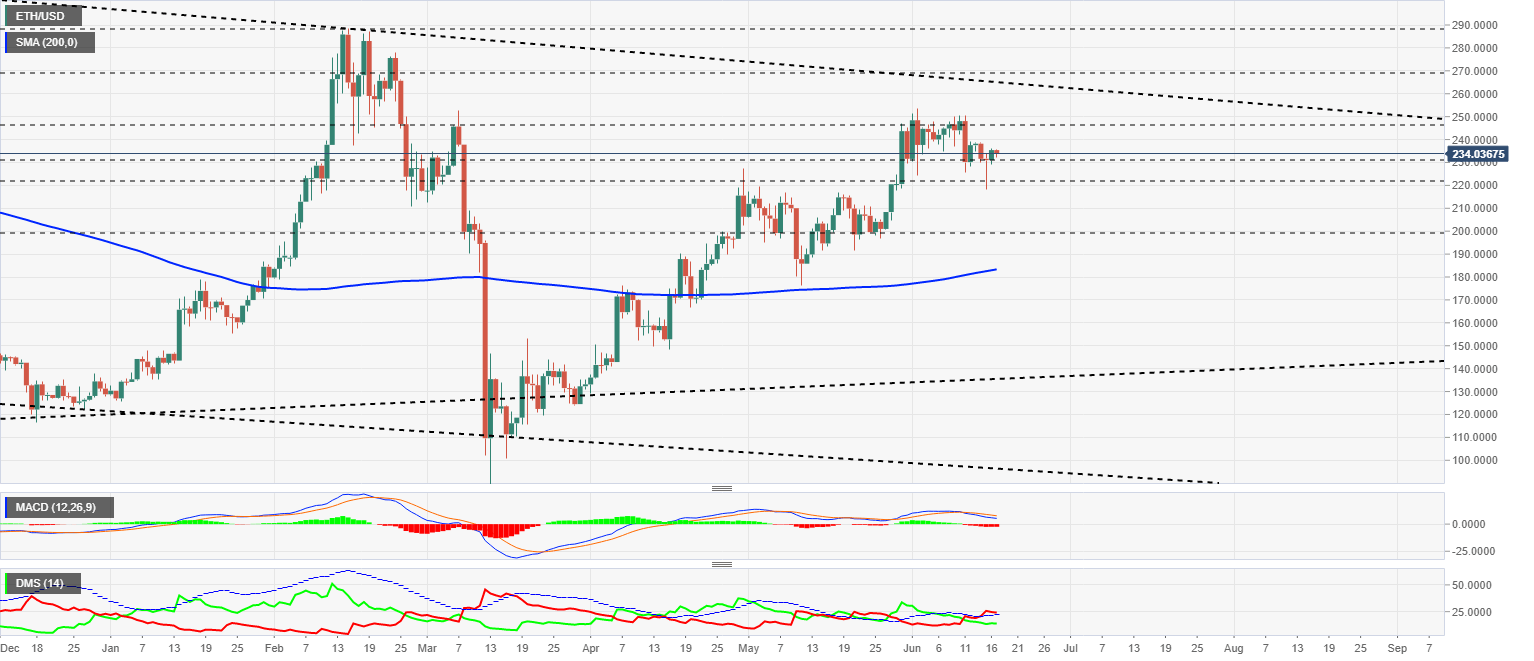
The MACD on the daily chart continues to cross within the bullish zone of the indicator. The moving averages are suggesting an acceleration of the decline in the next few sessions.
The DMI on the daily chart shows bears finding support at the ADX line, from where they may move upward following a further downward trend in ETH/USD.
XRP/USD Daily Chart
The XRP/USD pair is currently trading at $0.1951 while the daily chart is showing a bullish trend as the pair has broken out of the very short-term consolidation zone.
Above the current price, the first resistance level is at $0.202, then the second at $0.212 and the third one at $0.237.
Below the current price, the first support level is at $0.186, then the second at $0.18 and the third one at $0.163.
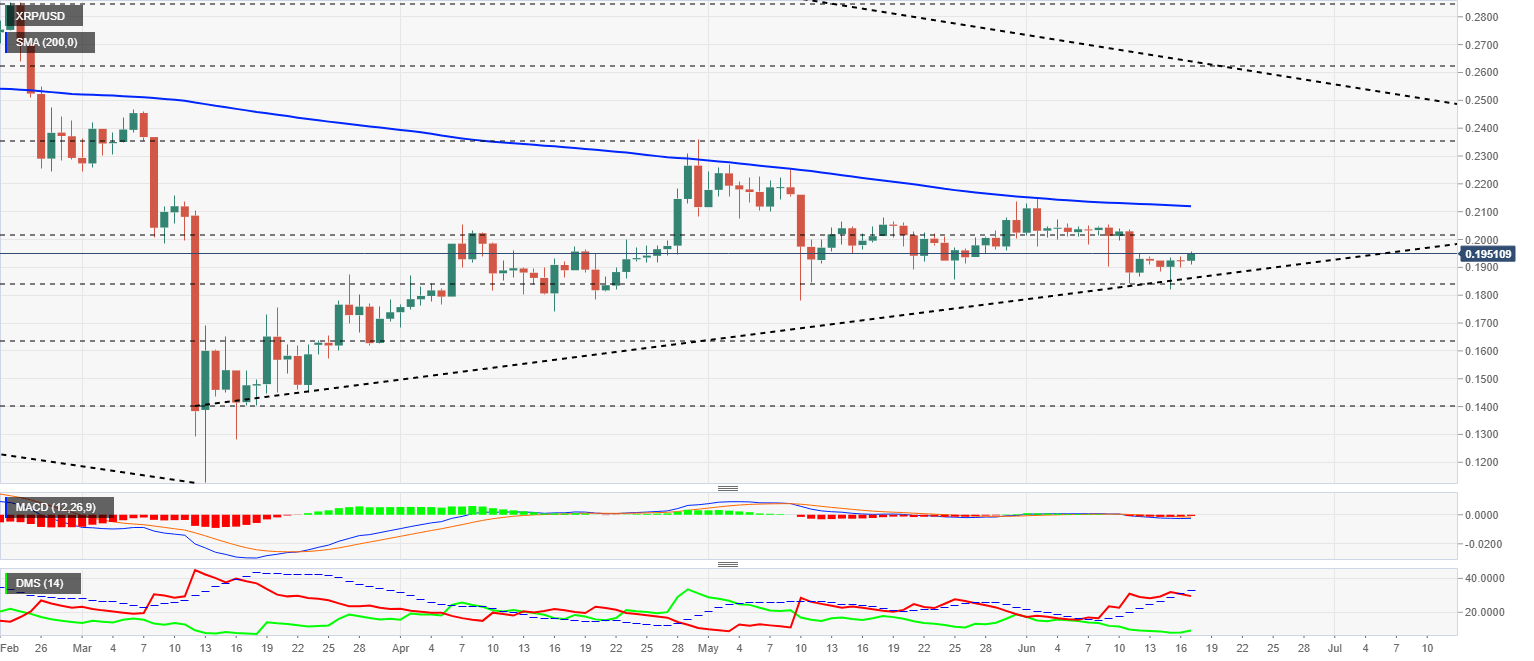
The MACD on the daily chart shows an entirely flat profile with no out and direction. The MACD on the daily chart shows a completely flat profile, with no outside and direction.
The DMI on the daily chart shows bulls disabling the bearish pattern by losing support from the ADX line. The bulls are reacting to the bullish move and may try to take control of the pair in the next few days.
Information on these pages contains forward-looking statements that involve risks and uncertainties. Markets and instruments profiled on this page are for informational purposes only and should not in any way come across as a recommendation to buy or sell in these assets. You should do your own thorough research before making any investment decisions. FXStreet does not in any way guarantee that this information is free from mistakes, errors, or material misstatements. It also does not guarantee that this information is of a timely nature. Investing in Open Markets involves a great deal of risk, including the loss of all or a portion of your investment, as well as emotional distress. All risks, losses and costs associated with investing, including total loss of principal, are your responsibility. The views and opinions expressed in this article are those of the authors and do not necessarily reflect the official policy or position of FXStreet nor its advertisers. The author will not be held responsible for information that is found at the end of links posted on this page.
If not otherwise explicitly mentioned in the body of the article, at the time of writing, the author has no position in any stock mentioned in this article and no business relationship with any company mentioned. The author has not received compensation for writing this article, other than from FXStreet.
FXStreet and the author do not provide personalized recommendations. The author makes no representations as to the accuracy, completeness, or suitability of this information. FXStreet and the author will not be liable for any errors, omissions or any losses, injuries or damages arising from this information and its display or use. Errors and omissions excepted.
The author and FXStreet are not registered investment advisors and nothing in this article is intended to be investment advice.
Recommended Content
Editors’ Picks
Ripple wipes out weekly gains, experts comment on role of Ripple stablecoin

Ripple declined to $0.52 on Thursday, erasing all gains registered earlier this week. Ripple SVP Eric van Miltenburg’s comments on the firm’s stablecoin, and how it is expected to benefit the XRP Ledger and native token XRP have raised concerns among crypto experts.
Hedera HBAR slips nearly 10% after air is cleared on mistaken link with giant BlackRock
HBAR price is down nearly 10% on Thursday, partly erasing gains inspired by the misinterpreted link with BlackRock. Despite the recent correction, Hedera’s price is up 44% in the past seven days.
The reason behind Bonk’s 105% rise and if you should buy now Premium

Bonk price has shot up 105% in the past five weeks. A retracement into $0.0000216 or the $0.0000152 to $0.0000186 imbalance would be a good buying opportunity. Patient investors can expect double-digit gains from BONK that could extend up to 70%.
Injective price weakness persists despite over 5.9 million INJ tokens burned
Injective price is trading with a bearish bias, stuck in the lower section of the market range. The bearish outlook abounds despite the network's deflationary efforts to pump the price. Coupled with broader market gloom, INJ token’s doomed days may not be over yet.
Bitcoin: BTC post-halving rally could be partially priced in Premium

Bitcoin (BTC) price briefly slipped below the $60,000 level for the last three days, attracting buyers in this area as the fourth BTC halving is due in a few hours. Is the halving priced in for Bitcoin? Or will the pioneer crypto note more gains in the coming days?