- The Bitcoin Dominance chart hits key supports and bounces, impacting the crypto market.
- Price drops can be seen as buying opportunities, patience comes into play.
- Traders hyper react and confidence enters the negative zone.
The Bitcoin dominance chart reached the base of the current technical structure, producing the upward bounce that we see reflected in red in the market. The big question is whether investors will look for a new scenario out of this bullish structure or if it will open a new outlook of bearish continuity that would trigger the Altcoin segment towards new historical highs.
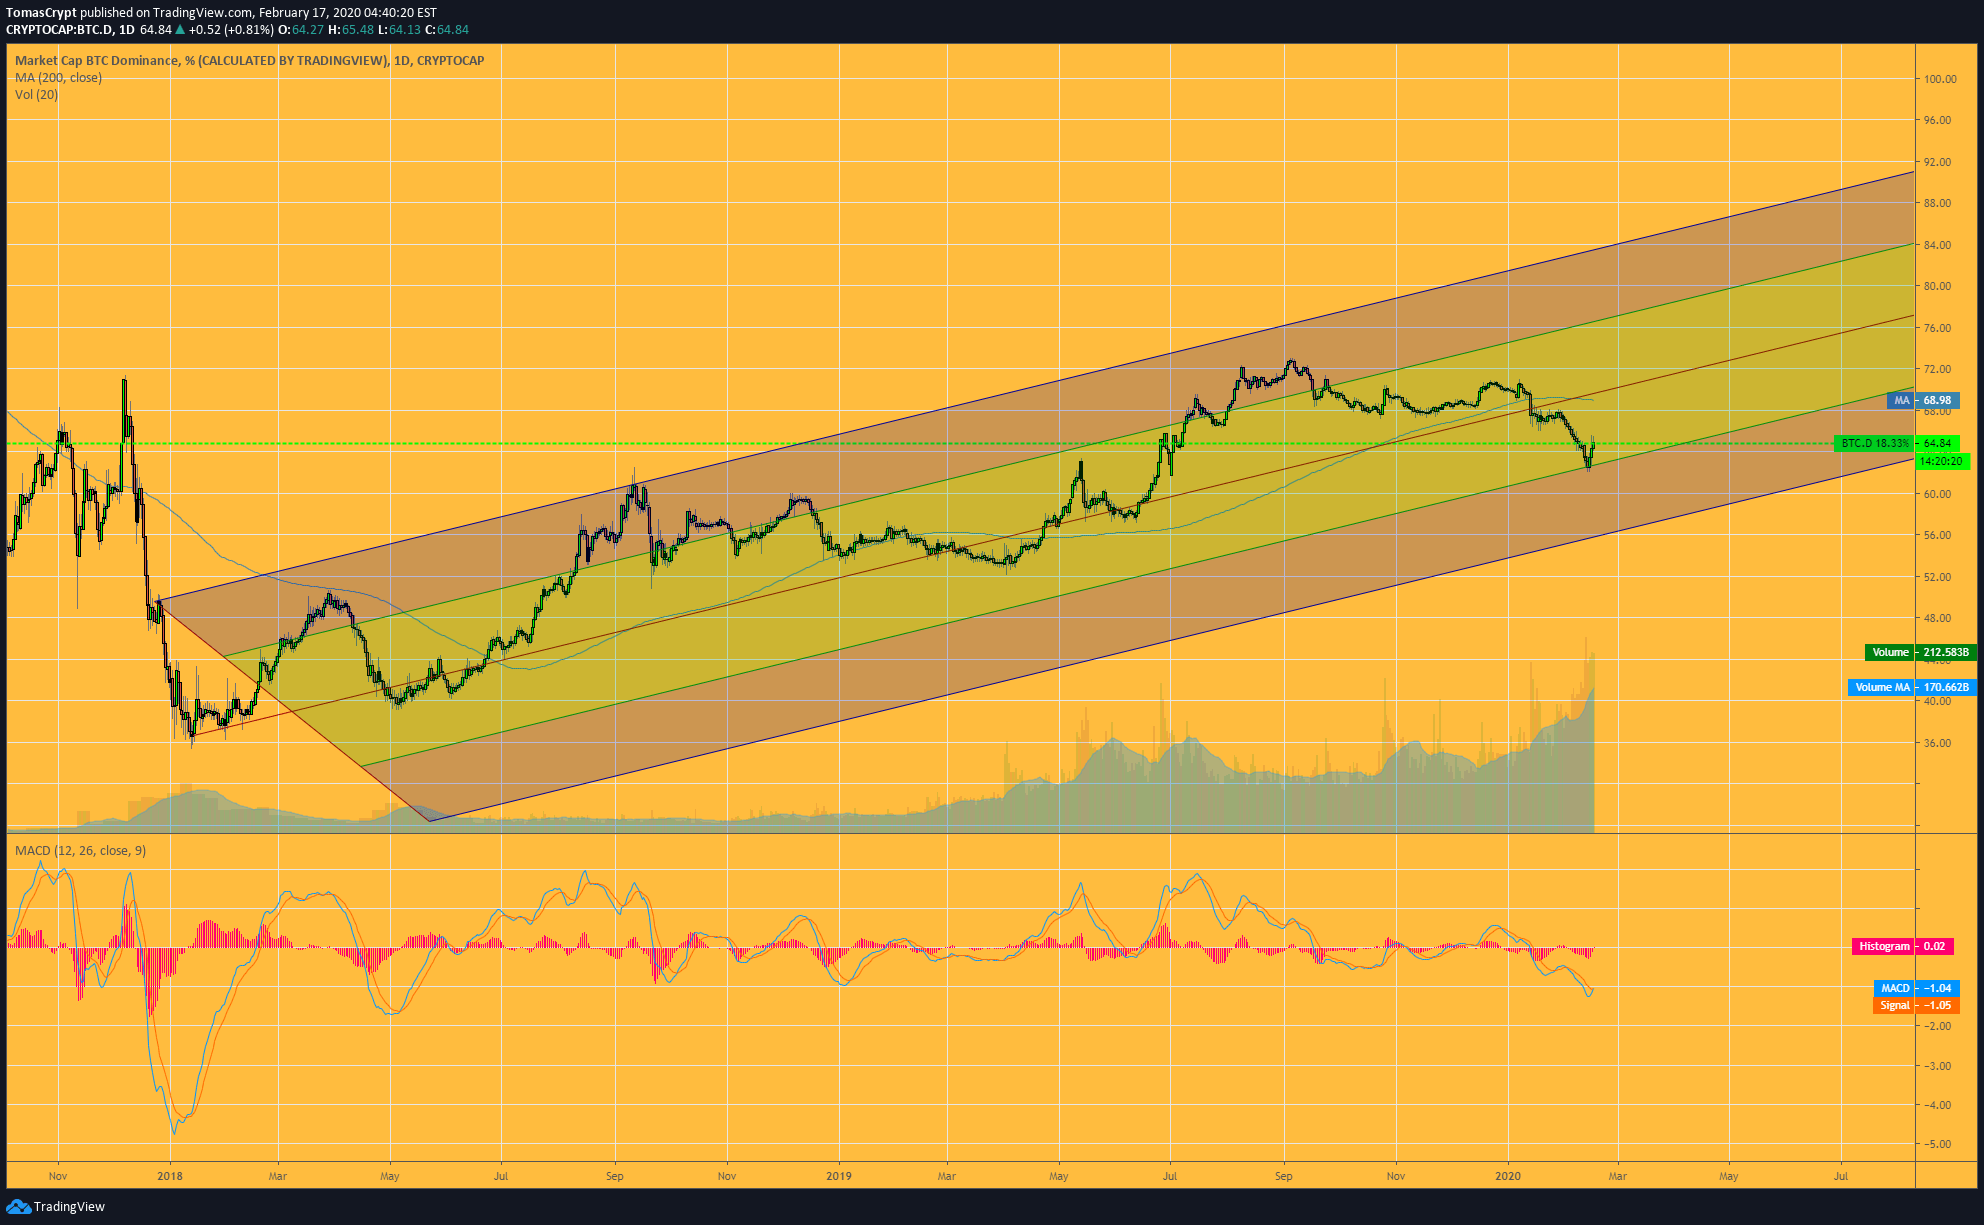 Market sentiment is overreacting and marks level 49, according to statistics of alternative.me site. The long months of crypto-winter have left their mark on traders, loosing 7 confidence points in 36 hours.
As long as the critical supports are intact, the falls will be buying opportunities for the market.
ETH/BTC Daily Chart
ETH/BTC is currently trading at the price level of 0.02559 and is down 10% from its relative high of 0.0275. Bitcoin proved to be resistant to fear sales of the past few hours and is barely moving away from the $10,000 level.
Looking ahead to the week ahead, we can expect the consolidation movement to drag on for a few days, as moving averages rise rapidly in search of the spot price.
The likely meeting level is around the 0.023 level.
Above the current price, the first resistance level is at 0.0268, then the second at 0.0275 and the third one at 0.029.
Below the current price, the first support level is at 0.025, then the second at 0.023 and the third one at 0.0213.
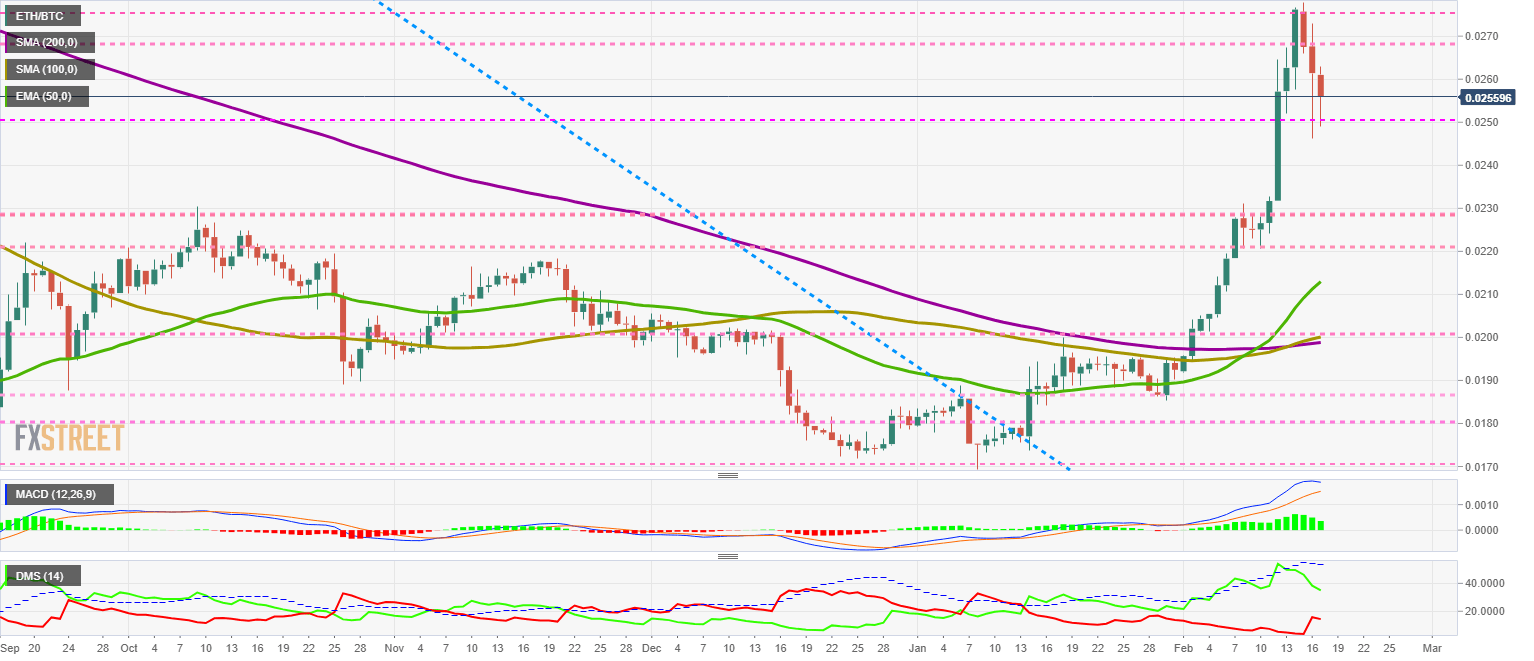
The MACD on the daily chart is slightly bearish but retains the openness between the lines. The current structure suggests a lateral downward movement with possible violent upward reactions.
The DMI on the daily chart shows that the bulls continue to lose strength from the extreme upward levels reached last week. The bears take this price drop as an opportunity and are climbing sharply.
BTC/USD Daily Chart
BTC/USD is currently trading at the $9803 price level after an attempt to break out of the $10,000 level early in the Asian session.
Above the current price, the first resistance level is at $10,500, then the second at $11,000 and the third one at $13,000.
Below the current price, the first support level is at $9,650, then the second at $9,150 and the third one at $8,900.
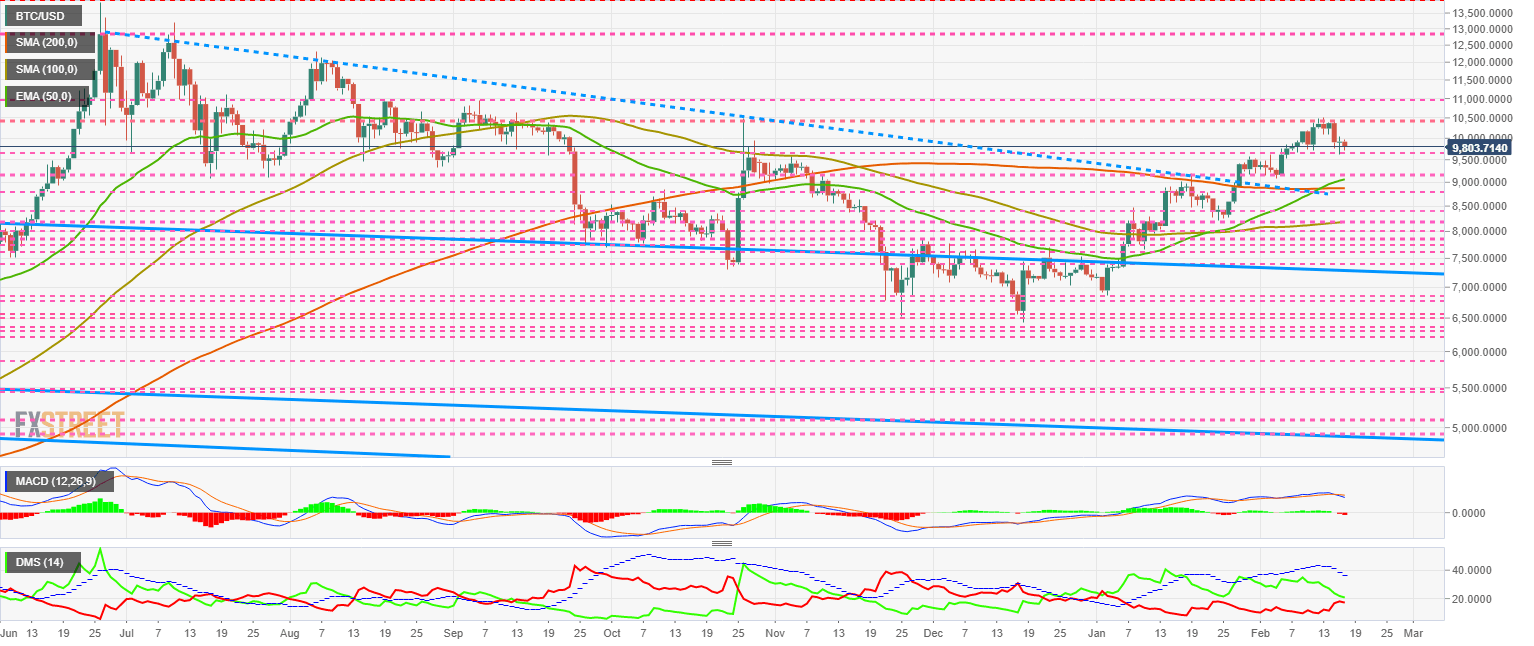 The MACD on the daily chart is crossing downward and loss the upward momentum that the Bitcoin has had.
The DMI on the daily chart shows the bulls right on top of the bears, with a high risk that the sell-side could take control of the BTC/USD pair and deepen the price declines.
ETH/USD Daily Chart
ETH/USD is down $40 from a high of $290. The failure to break that resistance level sent a message of weakness and active selling that seeks to capitalize on gains from December 2019 lows.
Above the current price, the first resistance level is at $260, then the second at $290 and the third one at $308.
Below the current price, the first support level is at $250, then the second at $237 and the third one at $230.
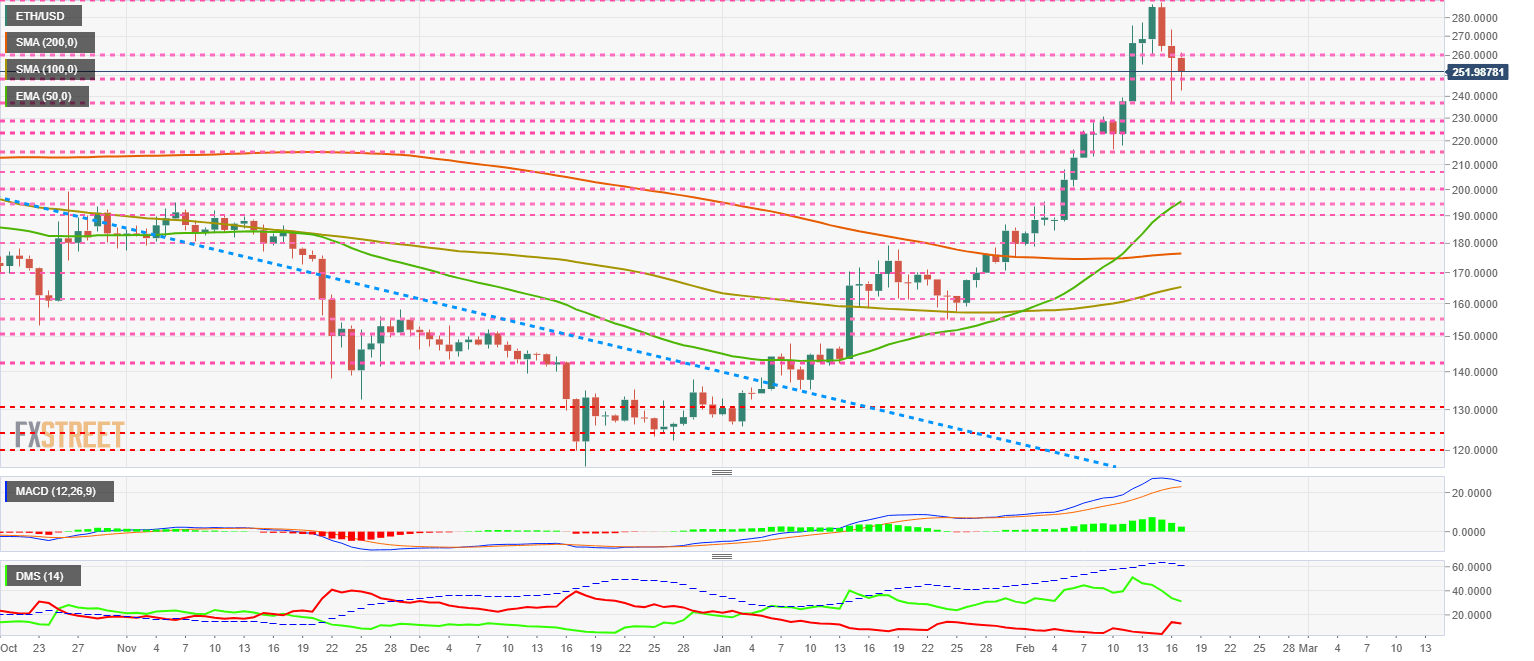
The MACD on the daily chart shows a bearish cross, but it has not completed the bearish cross. The small opening between the lines leaves little room for an upward rebound.
The DMI on the daily chart shows the bulls are losing strength, but still, hold the lead in the ETH/USD pair. Bears are reacting to the weekend's sales and increasing their trend force, though far from disputing the leadership of the buying side.
XRP/USD Daily Chart
XRP/USD is currently trading at $0.281 and is a member of the Top 3 that has lost the most support levels.
Above the current price, the first resistance level is at $0.29, then the second at $0.30 and the third one at $0.32.
Below the current price, the first support level is at $0.28, then the second at $0.27 and the third one at $0.255.
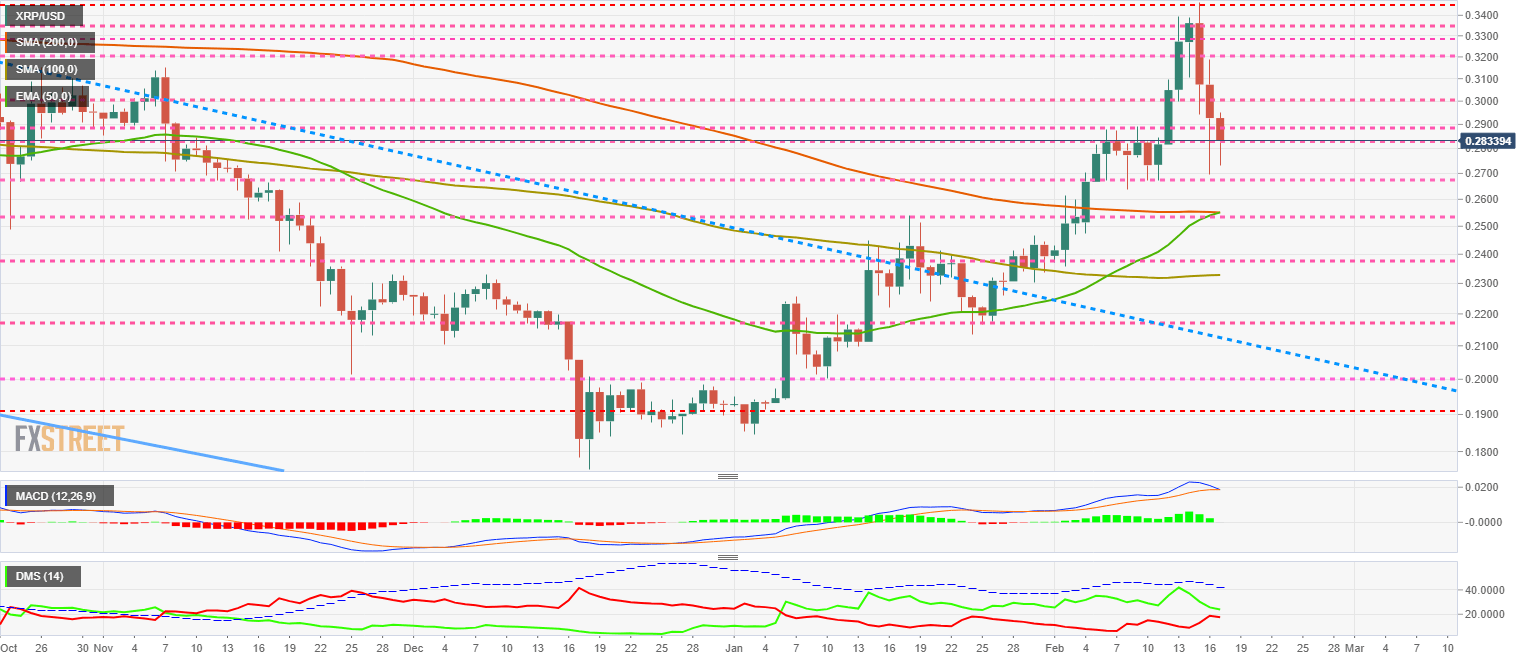
The MACD on the daily chart shows a bearish cross in progress so that we can expect at least a bearish lateral environment.
The DMI on the daily chart shows bulls with a minimal lead over the bears. At some point, they will have to discuss the leadership, which will possibly bring about an increase in volatility.
Get 24/7 Crypto updates in our social media channels: Give us a follow at @FXSCrypto and our FXStreet Crypto Trading Telegram channel
Information on these pages contains forward-looking statements that involve risks and uncertainties. Markets and instruments profiled on this page are for informational purposes only and should not in any way come across as a recommendation to buy or sell in these assets. You should do your own thorough research before making any investment decisions. FXStreet does not in any way guarantee that this information is free from mistakes, errors, or material misstatements. It also does not guarantee that this information is of a timely nature. Investing in Open Markets involves a great deal of risk, including the loss of all or a portion of your investment, as well as emotional distress. All risks, losses and costs associated with investing, including total loss of principal, are your responsibility. The views and opinions expressed in this article are those of the authors and do not necessarily reflect the official policy or position of FXStreet nor its advertisers. The author will not be held responsible for information that is found at the end of links posted on this page.
If not otherwise explicitly mentioned in the body of the article, at the time of writing, the author has no position in any stock mentioned in this article and no business relationship with any company mentioned. The author has not received compensation for writing this article, other than from FXStreet.
FXStreet and the author do not provide personalized recommendations. The author makes no representations as to the accuracy, completeness, or suitability of this information. FXStreet and the author will not be liable for any errors, omissions or any losses, injuries or damages arising from this information and its display or use. Errors and omissions excepted.
The author and FXStreet are not registered investment advisors and nothing in this article is intended to be investment advice.
Recommended Content
Editors’ Picks
Ethereum dips slightly amid Renzo depeg, BlackRock spot ETH ETF amendment

Ethereum (ETH) suffered a brief decline on Wednesday afternoon despite increased accumulation from whales. This follows Ethereum restaking protocol Renzo restaked ETH (ezETH) crashing from its 1:1 peg with ETH and increased activities surrounding spot Ethereum ETFs.
Injective price weakness persists despite over 5.9 million INJ tokens burned
Injective (INJ) price is trading with a bearish bias, stuck in the lower section of the market range. The bearish outlook abounds despite the network's deflationary efforts to pump the price. Coupled with broader market gloom, INJ token’s doomed days may not be over yet.
US intensifies battle against crypto privacy protocols following crackdown on Samourai Wallet

CEO Keonne Rodriguez and CTO William Lonergan of Samourai Wallet were arrested by the US Department of Justice (DoJ) on Wednesday and charged with $100 million in money laundering on a count and illegal money transmitting on another count. This move could see privacy-focused cryptocurrencies take a dip.
Near Protocol Price Prediction: NEAR fulfills targets but a 10% correction may be on the horizon
Near Protocol price has completed a 55% mean reversal from the bottom of the market range at $4.27. Amid growing bearish activity, NEAR could drop 10% to the $6.00 psychological level before a potential recovery. A break and close above $7.95 would invalidate the downleg thesis.
Bitcoin: BTC post-halving rally could be partially priced in Premium

Bitcoin (BTC) price briefly slipped below the $60,000 level for the last three days, attracting buyers in this area as the fourth BTC halving is due in a few hours. Is the halving priced in for Bitcoin? Or will the pioneer crypto note more gains in the coming days?