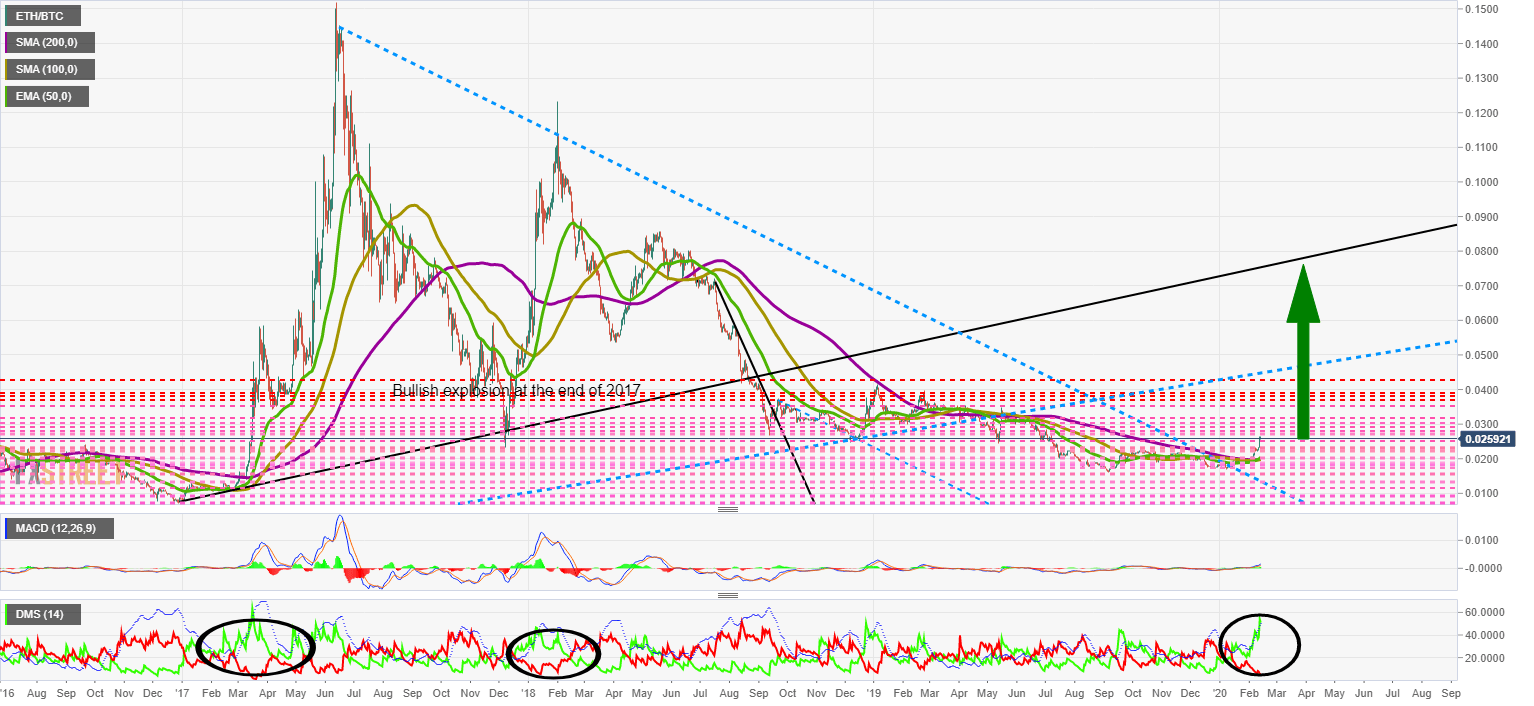
- The ETH/BTC pair shows a pattern already seen in 2017.
- US government puts the focus on the use of cryptocurrencies for illegal activities.
- XRP stands out today and rises in opening above 10%.
The crypto board continues to be green at this European opening. Ether dominates the performance panel supported by XRP, as Ripple Ltd finally seems to wake up from its lethargy.
The ETH/BTC chart leaves us with a hint that could indicate that the journey beyond the moon has begun. It is a pattern that has occurred on two occasions, March 2017 and January 2018. In the chart, you can see the extreme levels in the DMI (black circles) and the subsequent evolution of the pair. The green arrow shows a possible target of the movement.
 As the party continues, yesterday Treasury Secretary Steven Mnuchin testified at the US Congress. Regarding cryptocurrencies, he made a strong plea against their use for illegal activities.
He said that “cryptocurrencies, such as Bitcoin, have been exploited to support billions of dollars of illicit activity like cybercrime, tax evasion, extortion, ransomware, illicit drugs, human trafficking.”
He was also forceful in making it clear that the US administration would not allow cryptoverse to become a new haven for secret deposits like the one held by Switzerland until a few years ago.
He said “we want to make sure that technology moves forward; on the other hand, we want to make sure cryptocurrencies aren't used for the equivalent of old Swiss secret number banking.”
On the positive side, Mnuchin recognized that this technology is a breakthrough in transfers and micropayments. He also stated that the administration would welcome Bitcoin, Libra or any other if they meet the highest standards of transparency and accountability.
ETH/BTC Daily Chart
ETH/BTC is currently trading at the price level of 0.0254, losing some of its momentum after opening above 0.026. Yesterday's sharp rise pushes the technical situation of the ETH/BTC pair to the upside and increases the possibility of violent price reversals.
Above the current price, the first resistance level is at 0.027, then the second at 0.028 and the third one at 0.029.
Below the current price, the first support level is at 0.025, then the second at 0.023 and the third one at 0.022.
 The MACD on the daily chart shows a very bullish profile. The MACD on the daily chart shows a very bullish profile. The width of the opening between the lines and the slope indicates that the upside may continue, although the risk of reversals to correct the excess is high.
The DMI on the daily chart shows that yesterday's rally has pushed the bulls back above the ADX line, a pattern of continued upward movement. Bears are going to the lowest levels not seen since March 2017.
BTC/USD Daily Chart
BTC/USD trades at $10231 and, for another day, it seems that Bitcoin is abstracting from the strong bullish market sentiment.
Above the current price, the first resistance level is at $10650, then the second at $12850 and the third one at $14000.
Below the current price, the first support level is at $9660, then the second at $9165 and the third one at $8800.
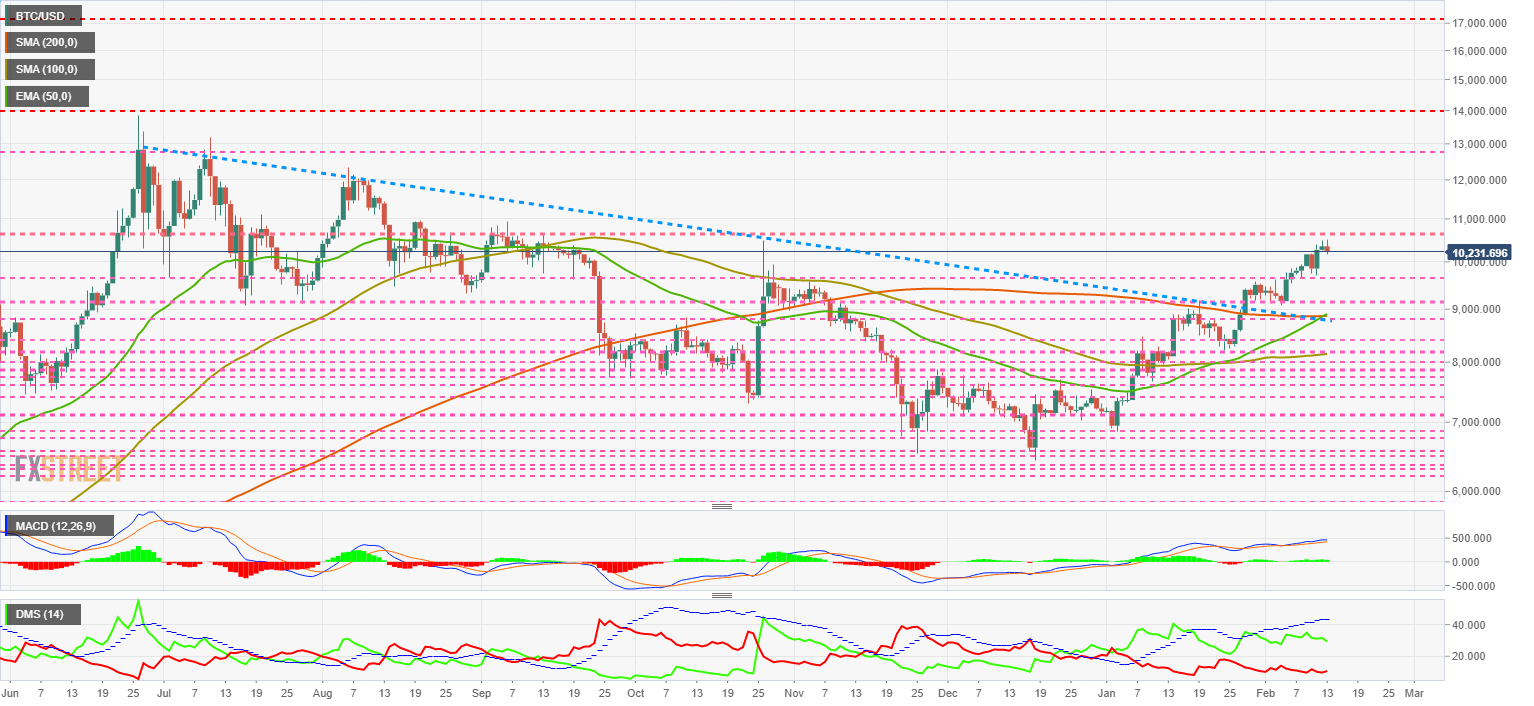 The MACD on the daily chart maintains the soft bullish gained earlier this week. The current bullish structure is fragile and if sales appear, Bitcoin could fall quickly.
The DMI on the daily chart shows that the bulls remain unchanged in terms of trend strength. Bears do fall and return to the lows of June 2019.
ETH/USD Daily Chart
ETH/USD is trading at the $259.5 price level and is down $10 from yesterday's high. The cumulative gain is 46.77% in February.
Above the current price, the first resistance level is at $270, then the second at $290 and the third one at $310.
Below the current price, the first support level is at $250, then the second at $238 and the third one at $228.
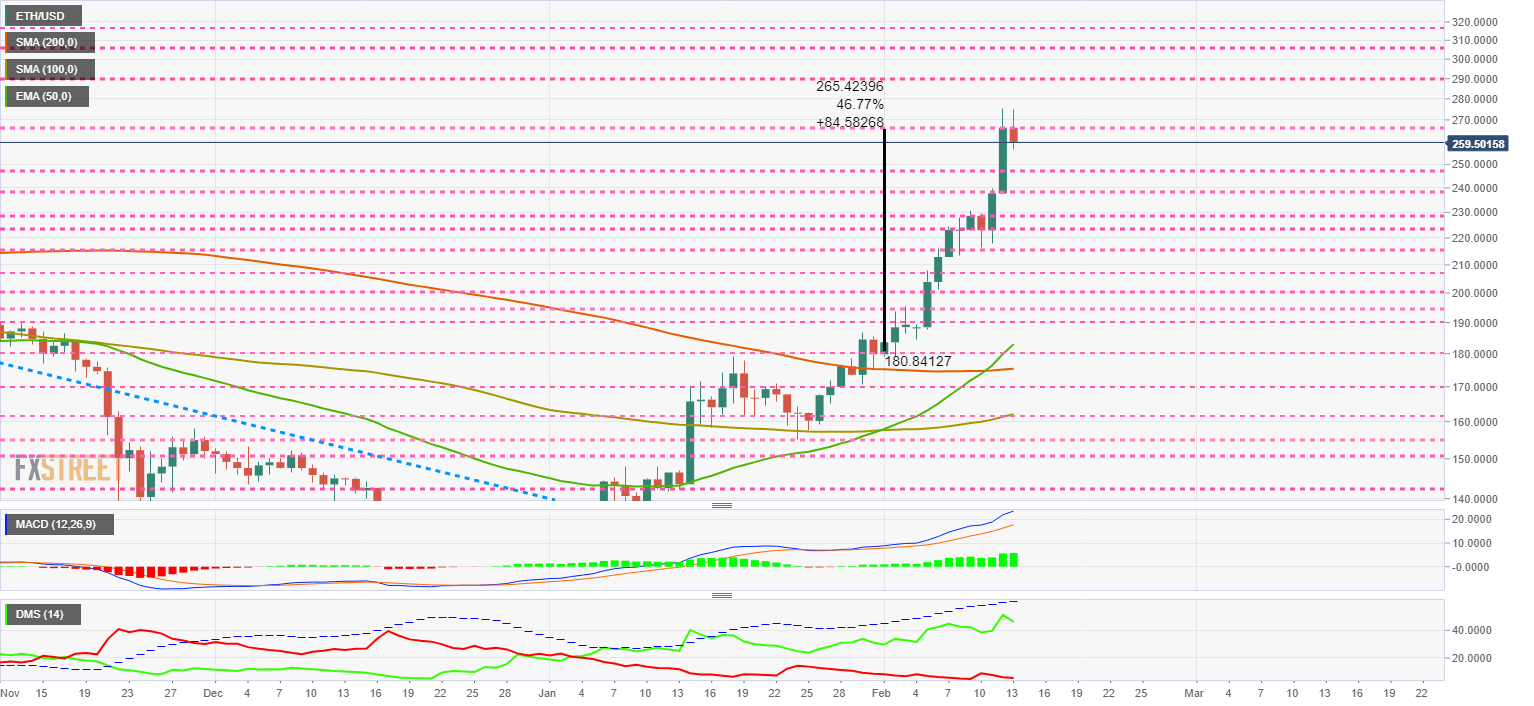 The MACD on the daily chart shows a very bullish profile. The opening between the lines and the slope indicate that the current trend may continue even though the risk of reversals to correct the excess is high.
The DMI on the daily chart shows that bulls are holding on to yesterday's high levels, while bears are retreating to the lows again.
XRP/USD Daily Chart
XRP/USD is currently trading at the price level of $0.3098 and leaves the day's high at $0.335.
Above the current price, the first resistance level is at $0.33, then the second at $0.335 and the third one at $0.345.
Below the current price, the first support level is at $0.30, then the second at $0.29 and the third one at $0.282.
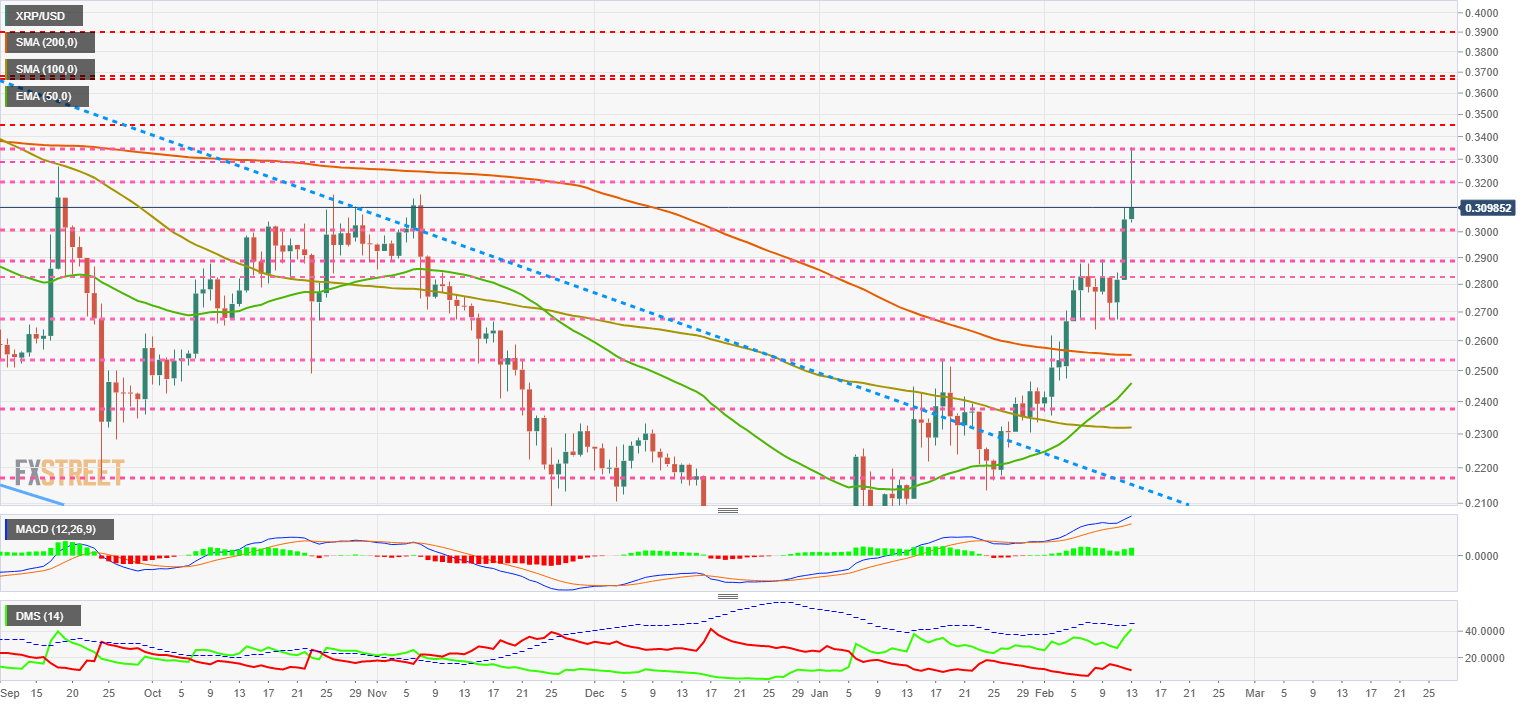 The MACD on the daily chart is once again increasing the bullish trend.
The DMI on the daily chart shows how the bulls are reacting strongly to the bullish move. The bears are retreating, but not to the lows seen on Bitcoin or Ether.
Get 24/7 Crypto updates in our social media channels: Give us a follow at @FXSCrypto and our FXStreet Crypto Trading Telegram channel
Information on these pages contains forward-looking statements that involve risks and uncertainties. Markets and instruments profiled on this page are for informational purposes only and should not in any way come across as a recommendation to buy or sell in these assets. You should do your own thorough research before making any investment decisions. FXStreet does not in any way guarantee that this information is free from mistakes, errors, or material misstatements. It also does not guarantee that this information is of a timely nature. Investing in Open Markets involves a great deal of risk, including the loss of all or a portion of your investment, as well as emotional distress. All risks, losses and costs associated with investing, including total loss of principal, are your responsibility. The views and opinions expressed in this article are those of the authors and do not necessarily reflect the official policy or position of FXStreet nor its advertisers. The author will not be held responsible for information that is found at the end of links posted on this page.
If not otherwise explicitly mentioned in the body of the article, at the time of writing, the author has no position in any stock mentioned in this article and no business relationship with any company mentioned. The author has not received compensation for writing this article, other than from FXStreet.
FXStreet and the author do not provide personalized recommendations. The author makes no representations as to the accuracy, completeness, or suitability of this information. FXStreet and the author will not be liable for any errors, omissions or any losses, injuries or damages arising from this information and its display or use. Errors and omissions excepted.
The author and FXStreet are not registered investment advisors and nothing in this article is intended to be investment advice.
Recommended Content
Editors’ Picks
PancakeSwap loses nearly 3% value intraday as the DEX crosses $1 billion in trade volume

Decentralized exchange (DEX) PancakeSwap (CAKE) announced in an official tweet that it has crossed $1 billion in trade volume on the Layer 2 chain, Base. CAKE on-chain metrics support the thesis of a recovery in the DEX token’s price.
Shiba Inu hits new milestone, over $9 billion worth of SHIB tokens burnt

Shiba Inu (SHIB), the second-largest meme coin in the crypto ecosystem, recently hit a milestone in the volume of tokens burned. Shiba Inu has burnt over 410.72 trillion SHIB tokens since the inception of the burn mechanism in the project, worth over $9 billion.
Dogwifhat crashes 60%, but here's why you should not buy WIF yet Premium

Dogwifhat (WIF) price shows a slowdown in the bearish momentum as it sets up a potential range. This development could lead to a good buying opportunity from a long-term perspective.
XRP struggles to overcome $0.50 resistance, SEC vs. Ripple could enter final pretrial conference

XRP is struggling with resistance at $0.50 as Ripple and the US Securities and Exchange Commission (SEC) are gearing up for the final pretrial conference on Tuesday at a New York court.
Bitcoin: BTC’s rangebound movement leaves traders confused

Bitcoin (BTC) price has been hovering around the $70,000 psychological level for a few weeks, resulting in a rangebound movement. This development could lead to a massive liquidation on either side before a directional move is established.