- XRP/USD crosses the long-term bearish channel ceiling and signals the launch of a new uptrend in the crypto market.
- Ether should be the positive player in the coming weeks.
- Market sentiment remains very pessimistic despite the significant improvement in recent hours.
Confinement due to the COVID-19 pandemic continues, but it seems that the cryptocurrency market will not wait much longer.
On Thursday, April 2nd, technical structures suggested that bears and bulls were preparing to fight for leadership and this has happened over the weekend.
Among the Top 3 of the crypto board, the XRP/USD pair is the only one that manages to escape from the bearish scenario in which all the crypto assets got into after the sell-off on March 13.
Bitcoin is on the verge of a long-term bearish channel breakout, although it shows some weakness, as we will see in the detailed analysis.
Ether is in a similar position to Bitcoin, although the technical structure for the ETH/USD pair is more favourable.
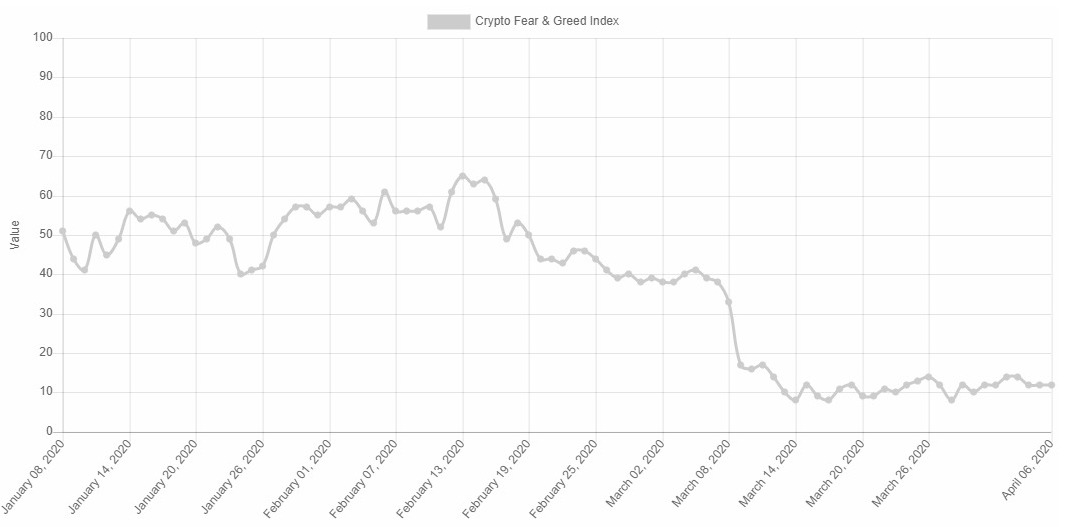
The market sentiment indicator published by alternative.me is at level 12 "extreme fear", a striking contrast to the significant price improvement.
The Ether Dominance chart shows strong upside potential, and only the SMA200 is an obstacle to seeing this market share indicator fly upwards.
ETH/BTC Daily Chart
The ETH/BTC pair is currently trading at the price level of 0.02128 and is trading above the SMA200 while the faster averages SMA100 and EMA50 are leaning upwards.
I want to remind you that ETH/BTC is a crucial indicator of market momentum and every time a bullish trend has started the market as a whole has followed that trend.
Above the current price, the first resistance level is at 0.022, then the second at 0.023 and the third one at 0.025.
Below the current price, the first support level is at 0.021, then the second at 0.020 and the third one at 0.0188.
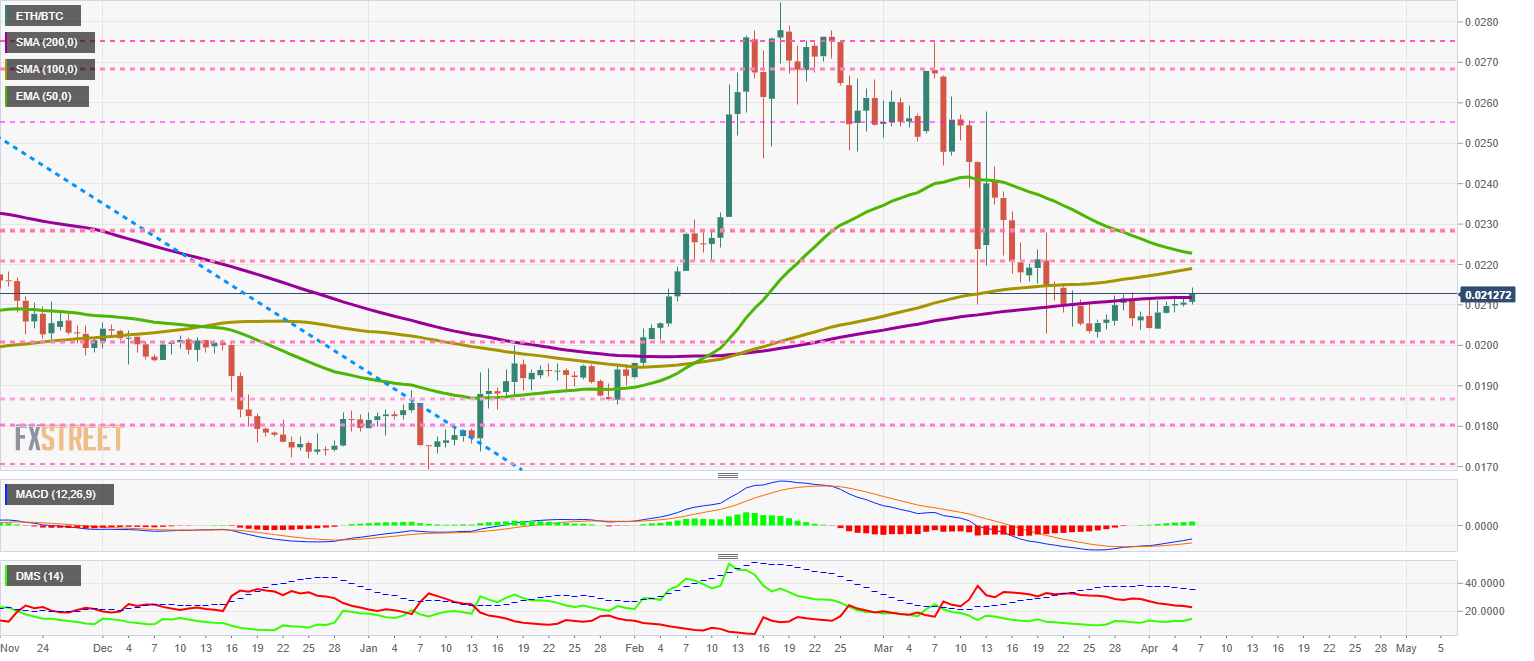
The MACD on the daily chart shows an improvement in the bullish profile of this indicator. The slope is increasing as the opening between the lines also improves.
The DMI on the daily chart shows the bulls still far from the bears, but they are improving their bullish profile and are heading towards the bearish level. The fact that the ETH/BTC pair is trading above the SMA200 while the bears are still in control is potentially a powerful bullish move.
BTC/USD Daily Chart
The BTC/USD pair is currently trading at the price level of $7077 and is battling twice over this round level and the long-term bearish channel ceiling. It's not an easy challenge for Bitcoin. The presence of the EMA50 in the $7250 price level adds an extra layer of difficulty to the current momentum.
Above the current price, the first resistance level is at $7150, then the second at $7250 and the third one at $7400.
Below the current price, the first support level is at $6800, then the second at $6600 and the third one at $6500.
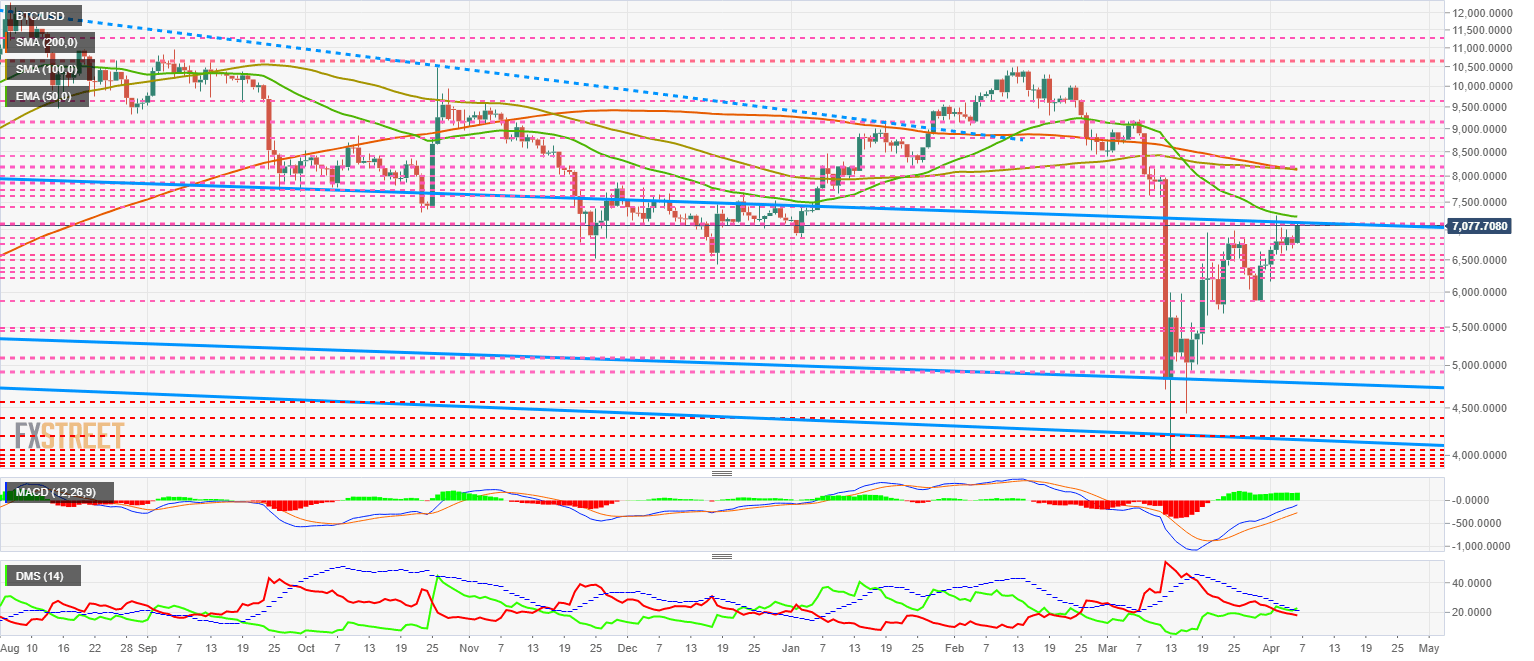
The MACD indicator on the daily chart shows a strong bullish profile. The proximity of the neutral level of the indicator could increase volatility and can expect some downward movement with no impact in the short term.
The DMI on the daily chart shows that the bulls have taken control of the BTC/USD pair. The buy-side of the market manages to cross the ADX line upwards, triggering a short to a medium-term bullish pattern.
ETH/USD Daily Chart
The ETH/USD pair is currently trading at the price level of $150, very close to the current high of $153.7.
Above the current price, the first resistance level is at $153.7, then the second at $162 and the third one at $170.
Below the current price, the first support level is at $143, then the second at $130 and the third one at $125.
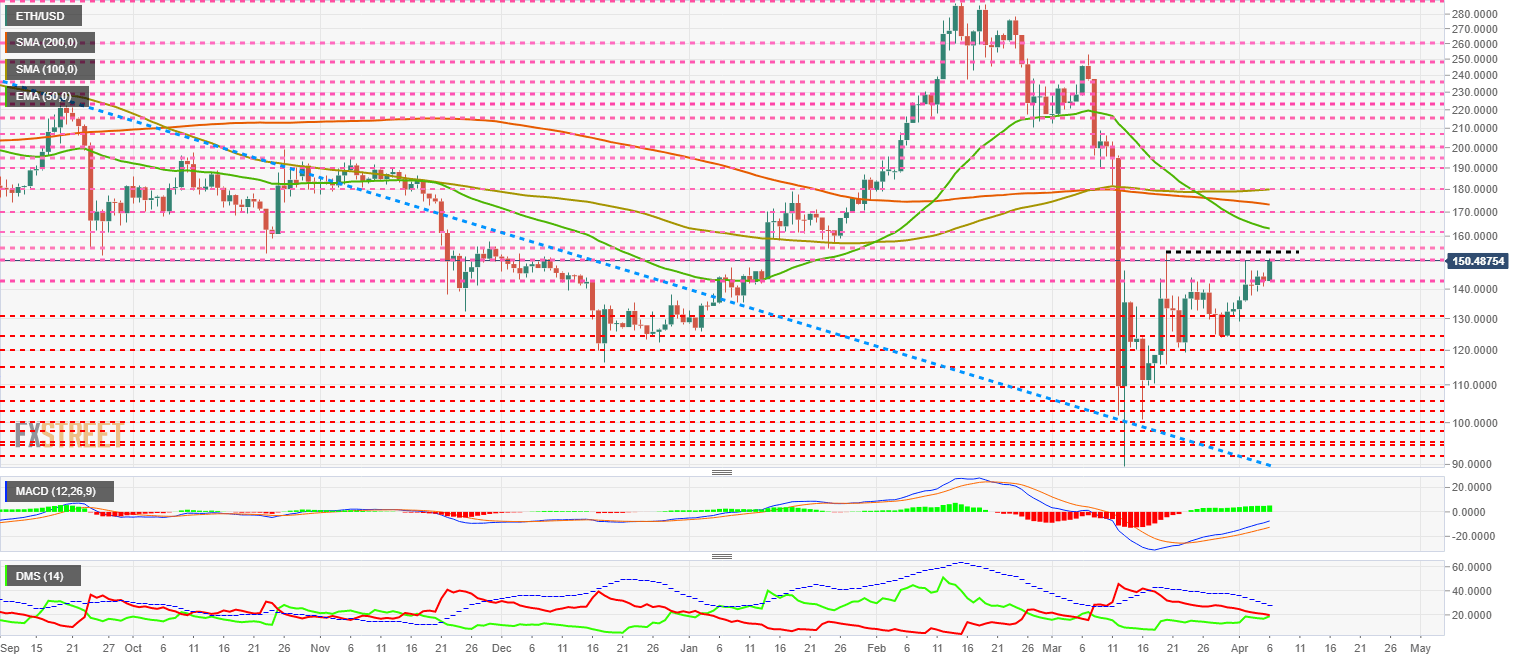
The MACD on the daily chart shows a less aggressive profile than BTC/USD, although it increases both the upward slope and the opening between the lines.
The DMI on the daily chart shows bulls and bears in a confrontation. The result of this struggle between buyers and sellers has implications for the market as a whole.
XRP/USD Daily Chart
The XRP/USD pair is the momentary winner of the day and the first to escape the long-term bearish structure. XRP/USD is currently trading at the price level of $0.186 and is rapidly moving towards the significant moving average positions between the $0.20 and $0.24 levels.
Above the current price, the first resistance level is at $0.19, then the second at $0.197 and the third one at $0.22.
Below the current price, the first support level is at $0.181, then the second at $0.172 and the third one at $0.15.
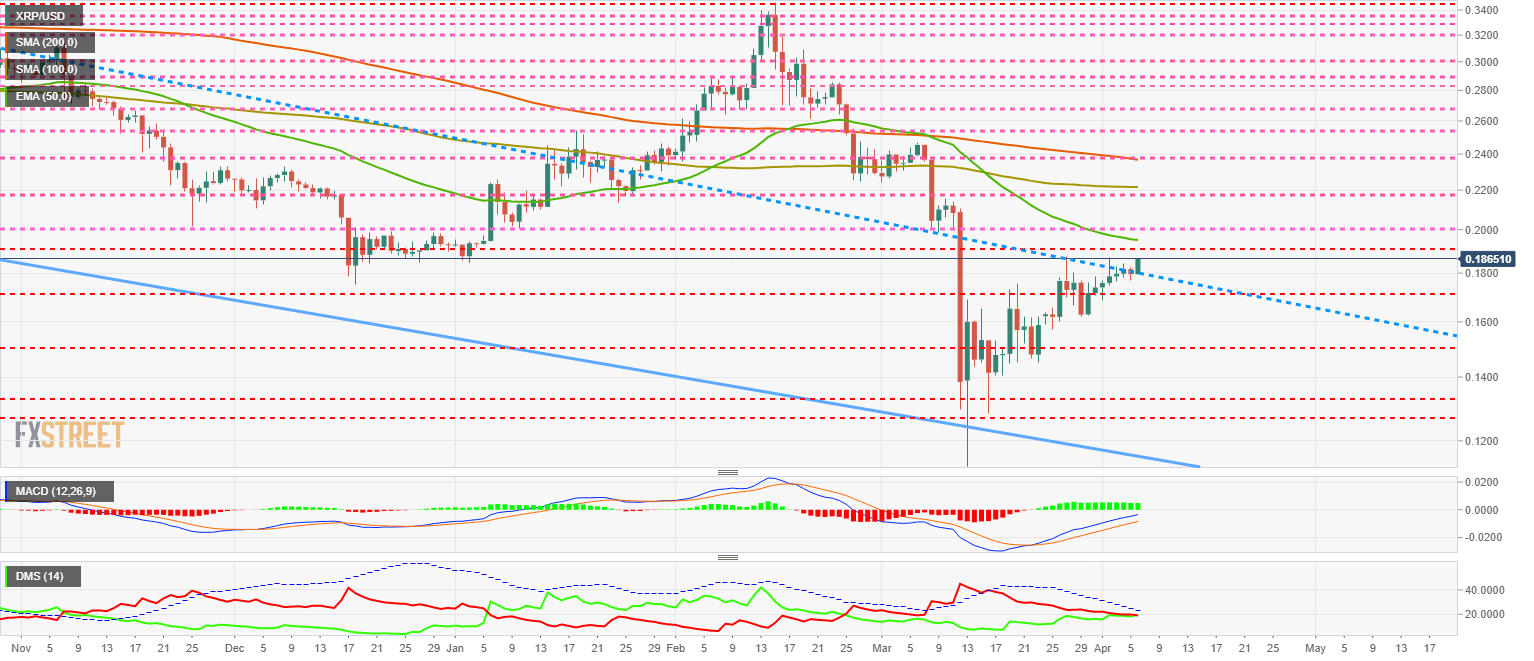
The MACD indicator on the daily chart shows a strong bullish profile. The slope and the opening between the lines, show of a possible loss of strength after the bullish breakout.
The DMI on the daily chart shows both sides of the market are in dispute over control of the pair. This data should cause us to cautiously consider the long-term downward breach.
Get 24/7 Crypto updates in our social media channels: Give us a follow at @FXSCrypto and our FXStreet Crypto Trading Telegram channel
Information on these pages contains forward-looking statements that involve risks and uncertainties. Markets and instruments profiled on this page are for informational purposes only and should not in any way come across as a recommendation to buy or sell in these assets. You should do your own thorough research before making any investment decisions. FXStreet does not in any way guarantee that this information is free from mistakes, errors, or material misstatements. It also does not guarantee that this information is of a timely nature. Investing in Open Markets involves a great deal of risk, including the loss of all or a portion of your investment, as well as emotional distress. All risks, losses and costs associated with investing, including total loss of principal, are your responsibility. The views and opinions expressed in this article are those of the authors and do not necessarily reflect the official policy or position of FXStreet nor its advertisers. The author will not be held responsible for information that is found at the end of links posted on this page.
If not otherwise explicitly mentioned in the body of the article, at the time of writing, the author has no position in any stock mentioned in this article and no business relationship with any company mentioned. The author has not received compensation for writing this article, other than from FXStreet.
FXStreet and the author do not provide personalized recommendations. The author makes no representations as to the accuracy, completeness, or suitability of this information. FXStreet and the author will not be liable for any errors, omissions or any losses, injuries or damages arising from this information and its display or use. Errors and omissions excepted.
The author and FXStreet are not registered investment advisors and nothing in this article is intended to be investment advice.
Recommended Content
Editors’ Picks
Dogwifhat price pumps 5% ahead of possible Coinbase effect

Dogwifhat (WIF) price recorded an uptick on Thursday, going as far as to outperform its peers in the meme coins space. Second only to Bonk Inu (BONK), WIF token’s show of strength was not just influenced by Bitcoin (BTC) price reclaiming above $63,000.
Runes likely to have massive support after BRC-20 and Ordinals frenzy

PUPS, WZRD, and PEPE are gaining liquidity through Bitcoin Ordinals. Creator of Bitcoin’s Ordinals protocol is debuting a new fungible token standard to rival BRC-20, Runes.
Ethereum shows firm support at key level as its correlation with US indices increase

Ethereum's price continued a sideways movement on Thursday as the market still awaits a trigger. Ethereum isn't alone in this horizontal trend; several major index funds have also traded sideways.
Mango Market attacker convicted of fraud and market manipulation

Mango Market attacker Avi Eisenberg was convicted by a federal jury on Thursday for "fraudulently obtaining" funds from the Solana-based decentralized exchange (DEX). He could face up to 20 years in prison for his role in the $110 million attack.
Bitcoin: BTC’s rangebound movement leaves traders confused

Bitcoin (BTC) price has been hovering around the $70,000 psychological level for a few weeks, resulting in a rangebound movement. This development could lead to a massive liquidation on either side before a directional move is established.