- The XRP/USD pair is best positioned to escape the bearish trap that has gripped the market in recent weeks.
- Ether needs to do better than Bitcoin, as it has happened over the weekend.
- Market sentiment is at a negative extreme, an invitation to a short-term upward shift.
The window of opportunity for a bullish attempt that appeared on Friday failed miserably, and the market penalized it severely.
The BTC/USD pair was very close to the long-term bearish channel ceiling, but the weekend selling pushed it back into the middle zone and delayed the event.
Ether has benefited from the weakness of King Bitcoin and has regained positions to it, a short recovery due to the ETH/BTC pair reaching the SMA200 level in the daily range.
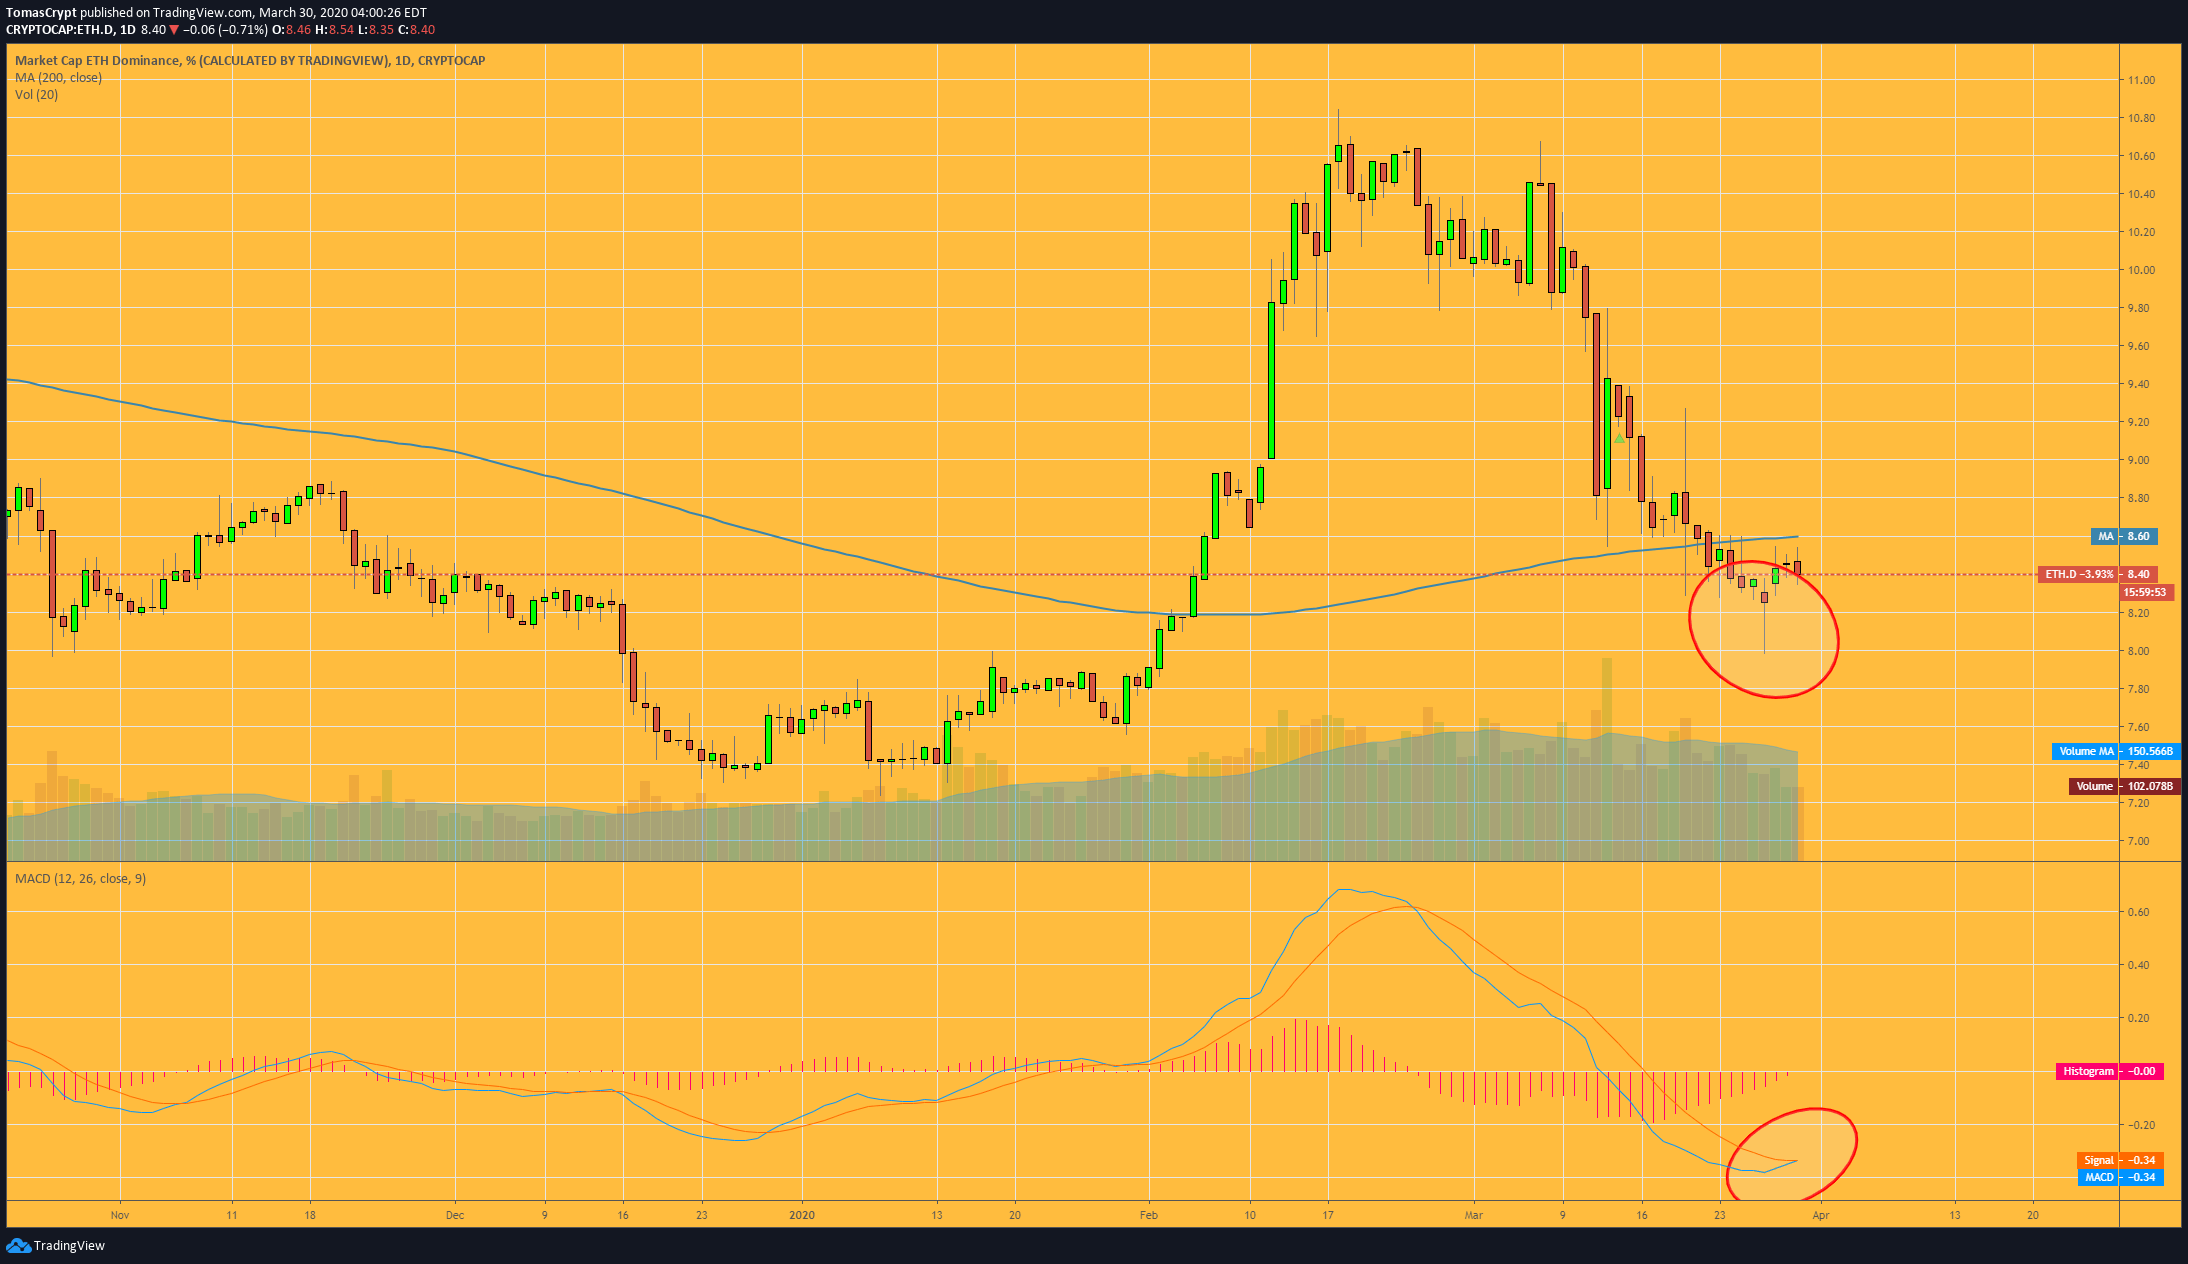 The daily chart's Ether dominance indicator shows a setup for a possible bullish move. We can see that an inaccurate "hanging man" structure was drawn on Friday and the MACD has a bullish cross profile. As an obstacle, there is never a lack of barriers, the presence of the SMA200 stopped a possible fast forward on Saturday.
Technically, the crypto market shows good setups for taking positions pending further gains, but caution is in order. Crypto assets had already taught us in 2018, and 2019 that they are very capable of going much further than logic dictates, both upwards and downwards.
The current market sentiment level in the crypto segment sinks back to the extreme fear level, reads 10, two points below the level it was at yesterday.
ETH/BTC Daily Chart
The ETH/BTC pair is currently trading at the 0.02084 price level after hitting the SMA200 after four days of bullish momentum. Today, Bitcoin retakes the lead, leaving a Doji on Sunday and announcing that the next upward leg of the ETH/BTC pair is not yet fully consolidated.
Above the current price, the first resistance level is at 0.0211, then the second at 0.0216 and the third one at 0.022.
Below the current price, the first support level is at 0.020, then the second at 0.0186 and the third one at 0.018.
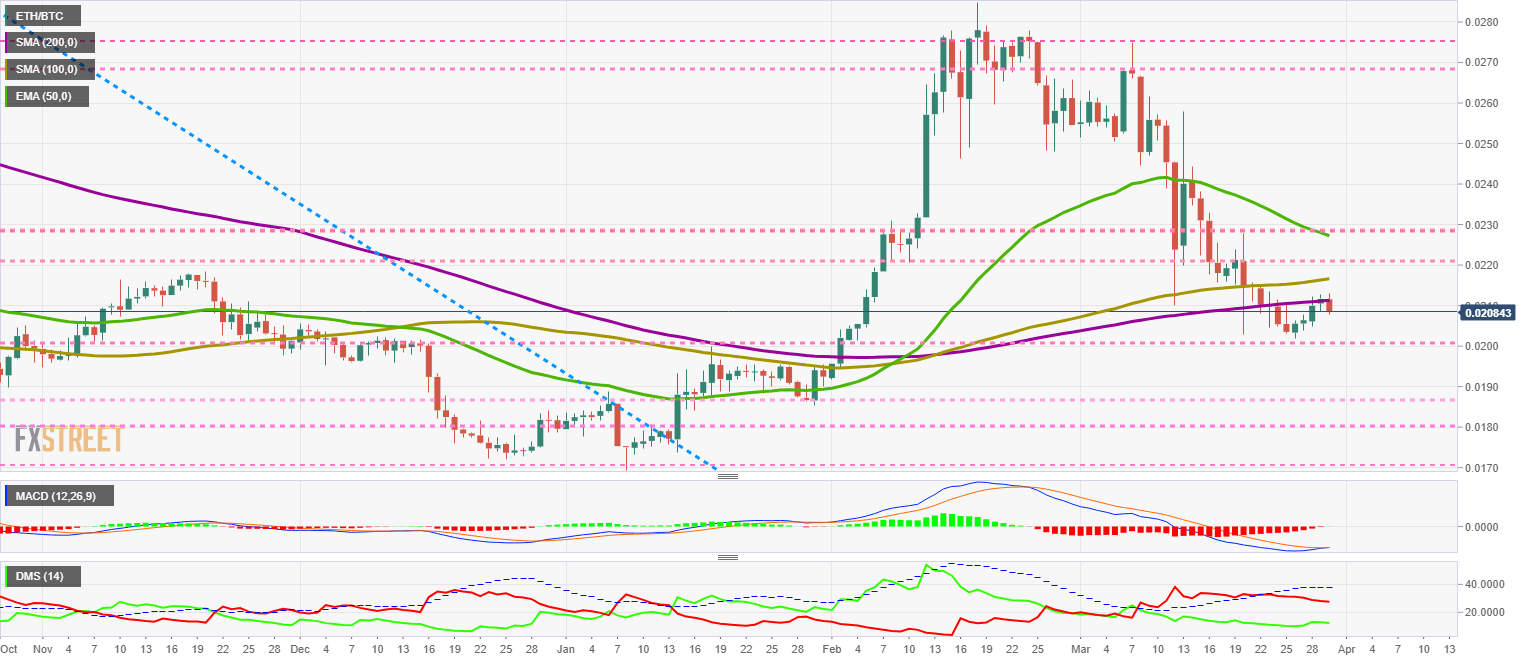 The MACD on the daily chart shows a bullish cross forming. The fast-moving average shows a less steep profile than would be appropriate, which could lead to a downward rebound in the next few hours. This structure confirms the potential of the Doji drawn by the price yesterday.
The DMI on the daily chart shows how bears are letting themselves go down, while bulls are not reacting and maintaining the level of the previous days.
BTC/USD Daily Chart
The BTC/USD pair is currently trading at $6258 and is making up for yesterday's loss. BTC/USD is once again facing a tangle of resistance due to price congestion. Below the support, density is lower, so bears could easily be hurt.
Above the current price, the first resistance level is at $6300, then the second at $6400 and the third one at $6500.
Below the current price, the first support level is at $5870, then the second at $5500 and the third one at $5000.
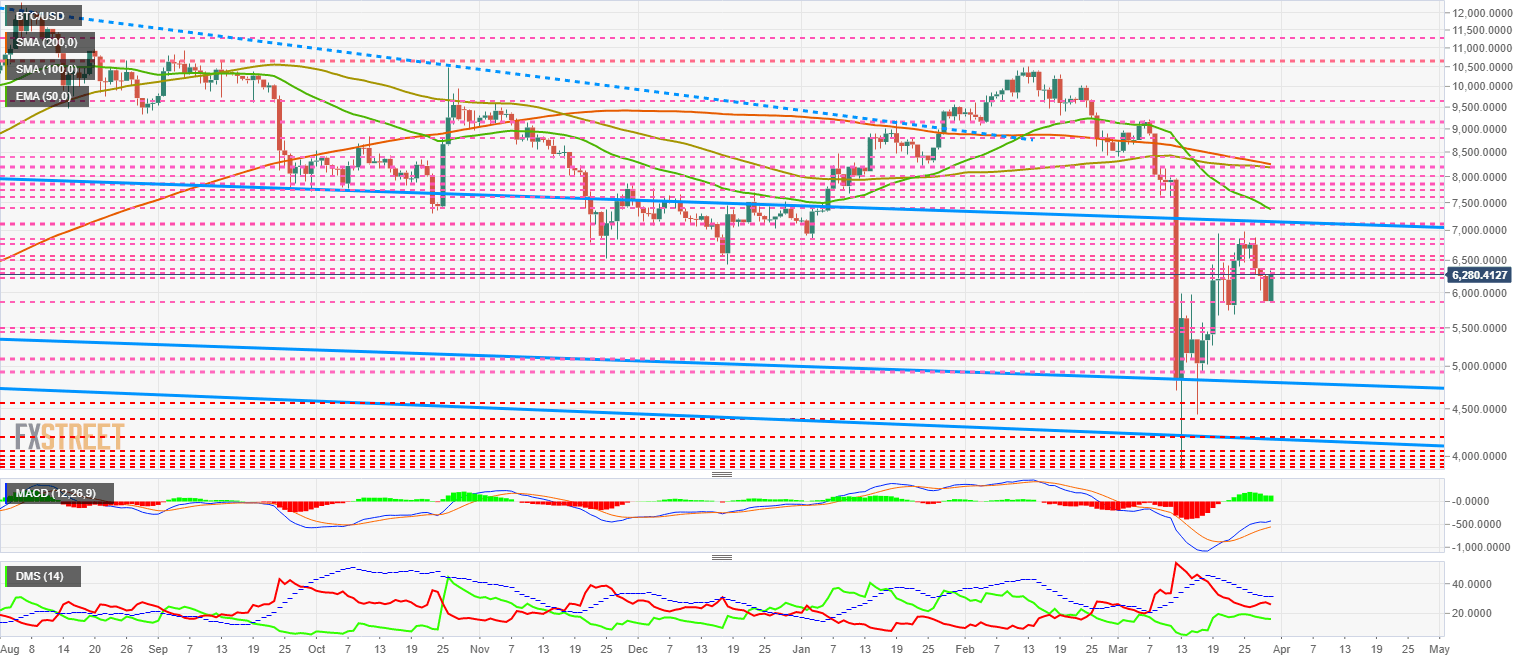
The MACD on the daily chart shows a loss of momentum in the fast-moving average. The new technical setup is healthier than the previous week's as too much tilt usually leads to violent moves against it.
The DMI on the daily chart shows the bears are giving way to the upside today, while the bulls are not confident and at the moment does not validate the price improvement on the day.
ETH/USD Daily Chart
The ETH/USD pair is currently trading at the $131 price level and is recovering after visiting the price congestion support at $125.
Above the current price, the first resistance level is at $132, then the second at $142 and the third one at $150.
Below the current price, the first support level is at $125, then the second at $120 and the third one at $115.
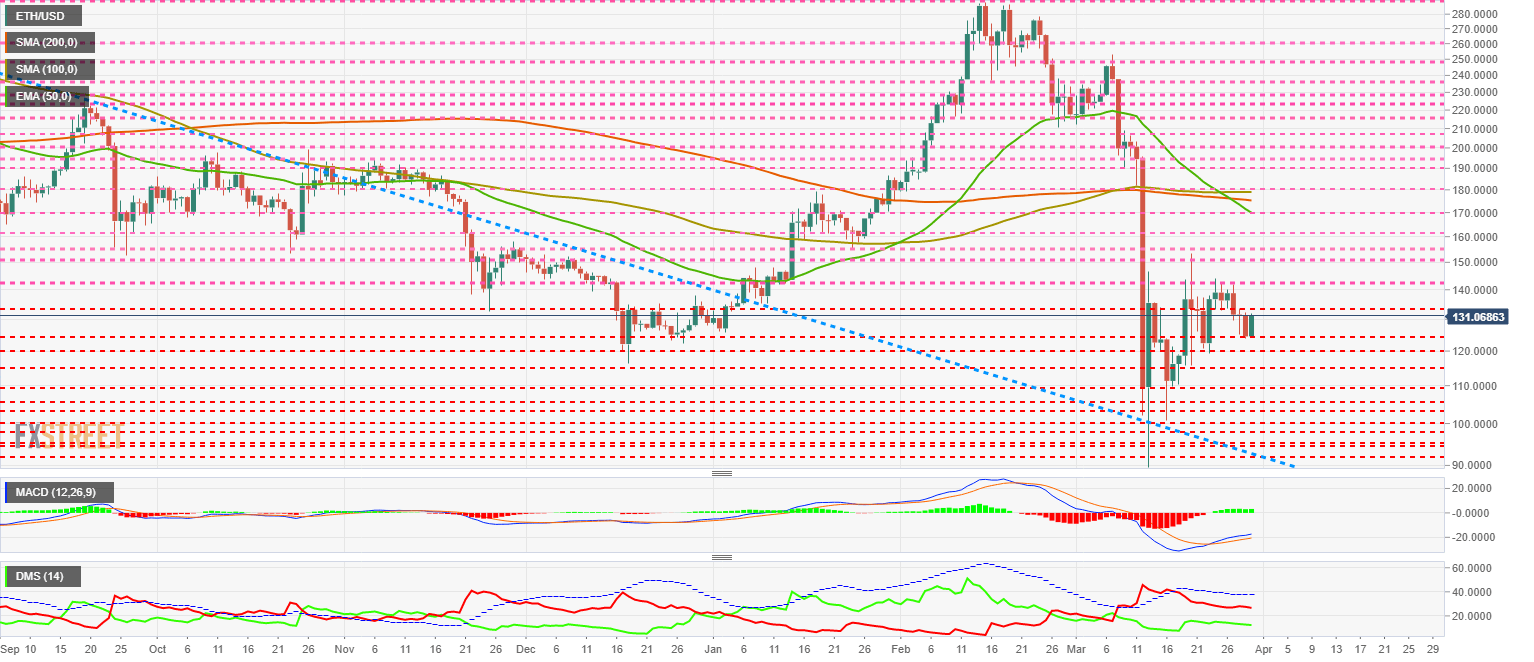 The MACD on the daily chart shows improvement despite the three days of declines. The moving average is slightly improving the bullish profile and could move up quickly.
The DMI on the daily chart shows bears moving gently lower, a trend that has been going on since the first week of the month. The bulls are not yet confident about the upward movement.
XRP/USD Daily Chart
The XRP/USD pair is currently trading at the price level of $0.172 and is approaching the long-term bearish channel ceiling. Above the $0.185 level, XRP would enter a favourable scenario although limited by the presence of the leading moving averages, which extend to the $0.24 level.
Above the current price, the first resistance level is at $0.183, then the second at $0.19 and the third one at $0.20.
Below the current price, the first support level is at $0.165, then the second at $0.15 and the third one at $0.14.
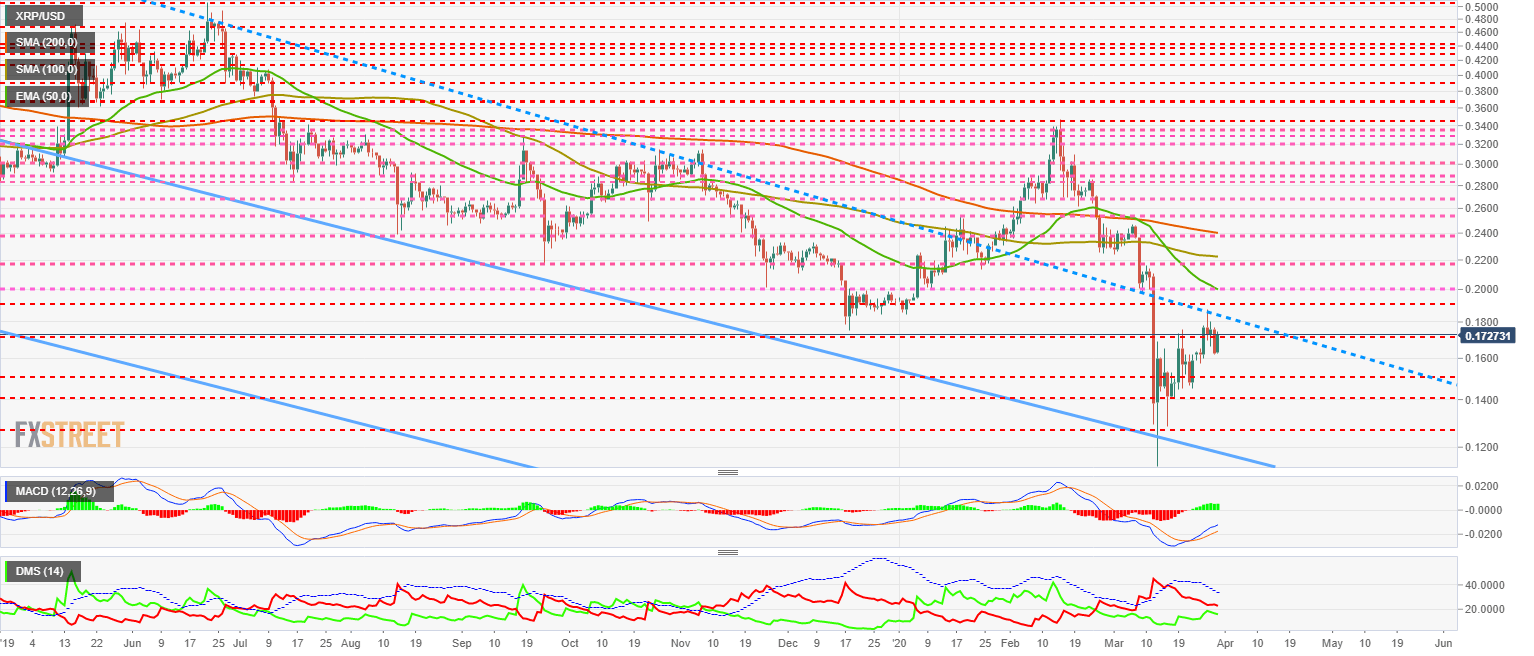
The MACD on the daily chart shows a bullish cross pattern that invites optimism for an upward movement and an escape from the current bearish channel.
The DMI on the daily chart shows a typical structure before a confrontation between the two sides of the market. Bears and bulls are very close, and a clash between the two is imminent.
Get 24/7 Crypto updates in our social media channels: Give us a follow at @FXSCrypto and our FXStreet Crypto Trading Telegram channel
Information on these pages contains forward-looking statements that involve risks and uncertainties. Markets and instruments profiled on this page are for informational purposes only and should not in any way come across as a recommendation to buy or sell in these assets. You should do your own thorough research before making any investment decisions. FXStreet does not in any way guarantee that this information is free from mistakes, errors, or material misstatements. It also does not guarantee that this information is of a timely nature. Investing in Open Markets involves a great deal of risk, including the loss of all or a portion of your investment, as well as emotional distress. All risks, losses and costs associated with investing, including total loss of principal, are your responsibility. The views and opinions expressed in this article are those of the authors and do not necessarily reflect the official policy or position of FXStreet nor its advertisers. The author will not be held responsible for information that is found at the end of links posted on this page.
If not otherwise explicitly mentioned in the body of the article, at the time of writing, the author has no position in any stock mentioned in this article and no business relationship with any company mentioned. The author has not received compensation for writing this article, other than from FXStreet.
FXStreet and the author do not provide personalized recommendations. The author makes no representations as to the accuracy, completeness, or suitability of this information. FXStreet and the author will not be liable for any errors, omissions or any losses, injuries or damages arising from this information and its display or use. Errors and omissions excepted.
The author and FXStreet are not registered investment advisors and nothing in this article is intended to be investment advice.
Recommended Content
Editors’ Picks
MANTA suffers 4% pullback after unlocking tokens worth $40 million

Manta Network (MANTA) unlocked over 8% of its circulating supply on Thursday. The unlocked tokens were airdropped and distributed in public sale, according to data from Tokenunlocks.
XRP struggles to recover as lingering Ripple lawsuit could reach Supreme Court, former SEC litigator says

The SEC vs. Ripple potential showdown at the Supreme Court is likely, says former SEC litigator Ladan Stewart. XRP Ledger calls developers, businesses and investors to build on the blockchain, extending Apex 2024 registration until April 30.
Bitcoin Layer 2 Merlin chain TVL climbs 20%, defying broad market correction

Merlin chain’s TVL added 20% this week, and crossed $800 million on Thursday. Bitcoin Layer 2 assets noted double-digit losses in the past week. Stacks, Elastos, SatoshiVM, BVM are hit by a correction as Bitcoin hovers around $61,000.
If Bitcoin restarts bull run, these altcoins are likely to explode Premium

If Bitcoin’s consolidation ends and the bull run resumes, altcoins are likely going to trigger a massive rally. Last cycle’s hot tokens like SOL, AVAX, WIF, ONDO, etc., could see renewed enthusiasm.
Bitcoin: BTC’s rangebound movement leaves traders confused

Bitcoin (BTC) price has been hovering around the $70,000 psychological level for a few weeks, resulting in a rangebound movement. This development could lead to a massive liquidation on either side before a directional move is established.