- Crypto buyers increase activity but still don't take control of a seller-dominated scenario
- An ambiguous technical setup in the short term, with upward divergences in the medium term that may generate anxiety on the buyer side
This week wakes up technically on a similar situation to the one we saw last Friday. Market leaders have not moved out of the current price range, but technical indicators do show that, in all cases, a development that could promote some buying hope by beginning to identify divergences everywhere.
The theory says that such unique structures warn of a new turn of the market, but there is one essential condition, the price must confirm the theory. Therefore, "If prices start to rise, the movement could be powerful" is a better reading.
BTC/USD 240 Min
The BTC/USD is trading at $6.433, just above the red line. This level is critical, as a break below would significantly complicate future upward price developments. If this level is lost, the first scenario would involve falls to $6,200, where support should be found on the bearish channel line that has guided the entire bearish leg since early May.
If the fall doesn't stop here, it would likely re-enter the channel with the last reference level at the February lows of $5,937.15. Down below, lots of nerves and Bitcoin price directly to the $5300 mark, as the base of the bearish channel is there.
On the upside, many obstacles will mutate into supports, starting with a price congestion resistance at $6,581, slightly below the EMA50 at $6,682. Conquering this level would be technically essential to subsequently face the assault to $6864 and, from there, up to the first complex zone in the range of $7,000-$7100, where the SMA100 meets a price resistance at the $7,000 round level.

The Bitcoin MACD at the 240-Min chart shows some exhaustion although Bitcoin's patterns are telling us that a bullish continuity is typical of this type of structure.
The Directional Movement Index at the 240-Min chart continues to give sellers a head start. The D- has just tried to cross the ADX but has not succeeded, a situation that increases the possibility of a takeover by some buyers who have been increasing their activity but without exceeding at any time the level of 20 that would give them all the prominence.
ETH/USD 240 Min
The ETH/USD is on a similar strategic situation but with its own tactical connotations. Ethereum enjoys more supports, starting from a zone between the trend line at $488.20, the price congestion support at $484.00 and another significant trend line at $470.00. If the latter level fails to support the price, the ETH/USD will enter a fully bearish scenario.
Above there, we can also find a high accumulation of resistance levels with an EMA50 at $514 as the first of all. Further above, significant strength at $520 as the upper trend line of the channel coincides at that level with a price congestion level that Ethereum has already visited on multiple occasions. If the ETH/USD surpasses that one, the scenario is somewhat more favorable in the short term with the challenge of exceeding the SMA100 by $553 first, and the SMA200 by $589 later.
-636649125031142253.png)
The MACD at Ethereum 240-Min chart shows a profile similar to the one seen in the Bitcoin. It is very close to a possible downward cross although a repeated pattern on several occasions gives the possibility of an upward movement.
The Directional Movement Index at 240-Min chart shows sellers in control of the situation as buyers increase their activity, without ever exceeding the 20 level that indicates the existence of a trend.
XRP/USD 240 Min
The XRP/USD moves in a less dense area than its analysis partners, causing its movements to be broader and generating a higher degree of restlessness. It is currently trading at $0.51 after bouncing slightly above the 13-day lows in the early trading hours today. If the bearish tone persists, the first support is located at the $0.50 level, followed by $0.45 as the last support for medium-term bullish hopes.
These rising hopes need the re-conquest of the $0.55 where the EMA50 would coincide with resistance due to price congestion. Above, there is a full resistance zone between $0.58 and $0.63 where three resistance levels converge per price at $0.582-$0.60 and $0.63. Between the lines, the SMA100 and the SMA200 would make an upward linear evolution very difficult.
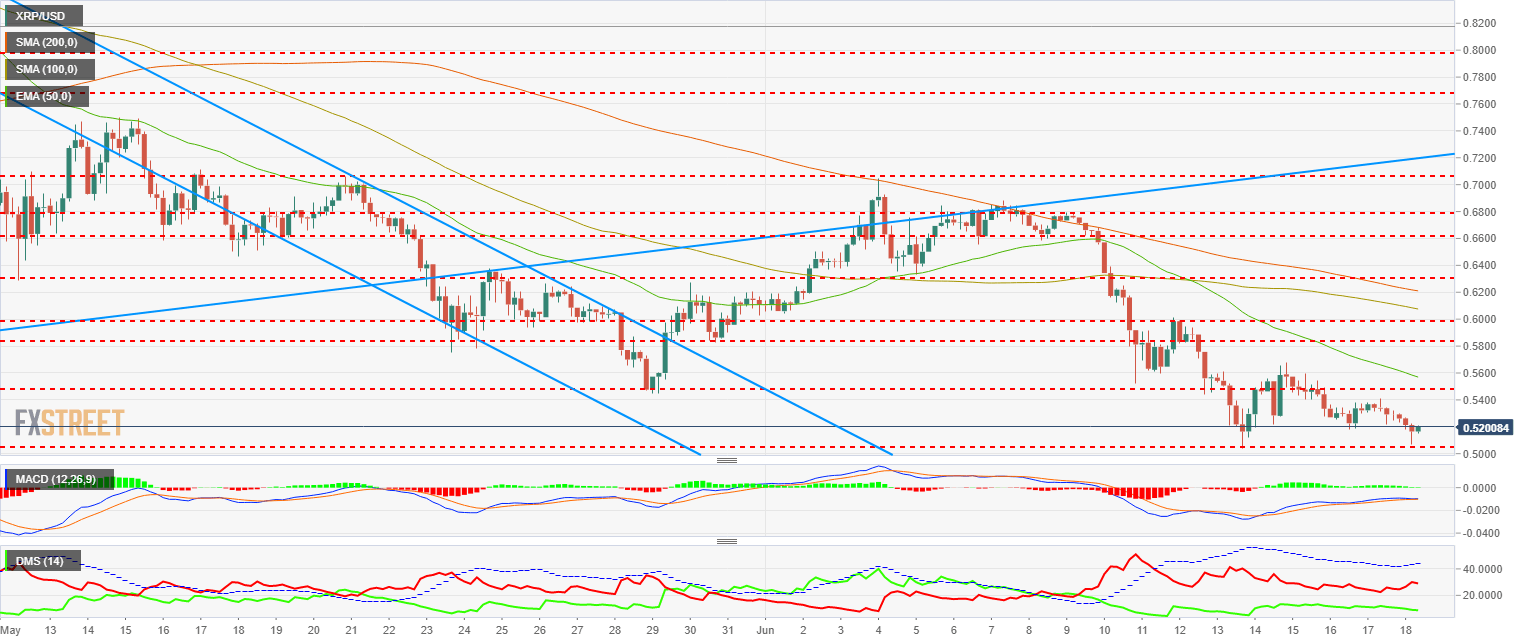
The MACD at the Ripple 240-Min chart looks very weak and practically crossed down. In the case of the Ripple, the skipper supports a bearish leg as a prelude to a possible upward turn in price.
The Directional Movement Index at 240-Min also gives control to sellers, who enjoy plenty of room for development. On the other hand, buyers have increased activity but not as strong as in the other assets analyzed. They are not able to surpass the 10 level of strength, so there is no convincing evidence of any bullish positions.
Information on these pages contains forward-looking statements that involve risks and uncertainties. Markets and instruments profiled on this page are for informational purposes only and should not in any way come across as a recommendation to buy or sell in these assets. You should do your own thorough research before making any investment decisions. FXStreet does not in any way guarantee that this information is free from mistakes, errors, or material misstatements. It also does not guarantee that this information is of a timely nature. Investing in Open Markets involves a great deal of risk, including the loss of all or a portion of your investment, as well as emotional distress. All risks, losses and costs associated with investing, including total loss of principal, are your responsibility. The views and opinions expressed in this article are those of the authors and do not necessarily reflect the official policy or position of FXStreet nor its advertisers. The author will not be held responsible for information that is found at the end of links posted on this page.
If not otherwise explicitly mentioned in the body of the article, at the time of writing, the author has no position in any stock mentioned in this article and no business relationship with any company mentioned. The author has not received compensation for writing this article, other than from FXStreet.
FXStreet and the author do not provide personalized recommendations. The author makes no representations as to the accuracy, completeness, or suitability of this information. FXStreet and the author will not be liable for any errors, omissions or any losses, injuries or damages arising from this information and its display or use. Errors and omissions excepted.
The author and FXStreet are not registered investment advisors and nothing in this article is intended to be investment advice.
Recommended Content
Editors’ Picks
Ethereum dips slightly amid Renzo depeg, BlackRock spot ETH ETF amendment

Ethereum (ETH) suffered a brief decline on Wednesday afternoon despite increased accumulation from whales. This follows Ethereum restaking protocol Renzo restaked ETH (ezETH) crashing from its 1:1 peg with ETH and increased activities surrounding spot Ethereum ETFs.
Injective price weakness persists despite over 5.9 million INJ tokens burned
Injective (INJ) price is trading with a bearish bias, stuck in the lower section of the market range. The bearish outlook abounds despite the network's deflationary efforts to pump the price. Coupled with broader market gloom, INJ token’s doomed days may not be over yet.
US intensifies battle against crypto privacy protocols following crackdown on Samourai Wallet

CEO Keonne Rodriguez and CTO William Lonergan of Samourai Wallet were arrested by the US Department of Justice (DoJ) on Wednesday and charged with $100 million in money laundering on a count and illegal money transmitting on another count. This move could see privacy-focused cryptocurrencies take a dip.
Near Protocol Price Prediction: NEAR fulfills targets but a 10% correction may be on the horizon
Near Protocol price has completed a 55% mean reversal from the bottom of the market range at $4.27. Amid growing bearish activity, NEAR could drop 10% to the $6.00 psychological level before a potential recovery. A break and close above $7.95 would invalidate the downleg thesis.
Bitcoin: BTC post-halving rally could be partially priced in Premium

Bitcoin (BTC) price briefly slipped below the $60,000 level for the last three days, attracting buyers in this area as the fourth BTC halving is due in a few hours. Is the halving priced in for Bitcoin? Or will the pioneer crypto note more gains in the coming days?