Quantitative analysis of the ICO market (2017-2018)
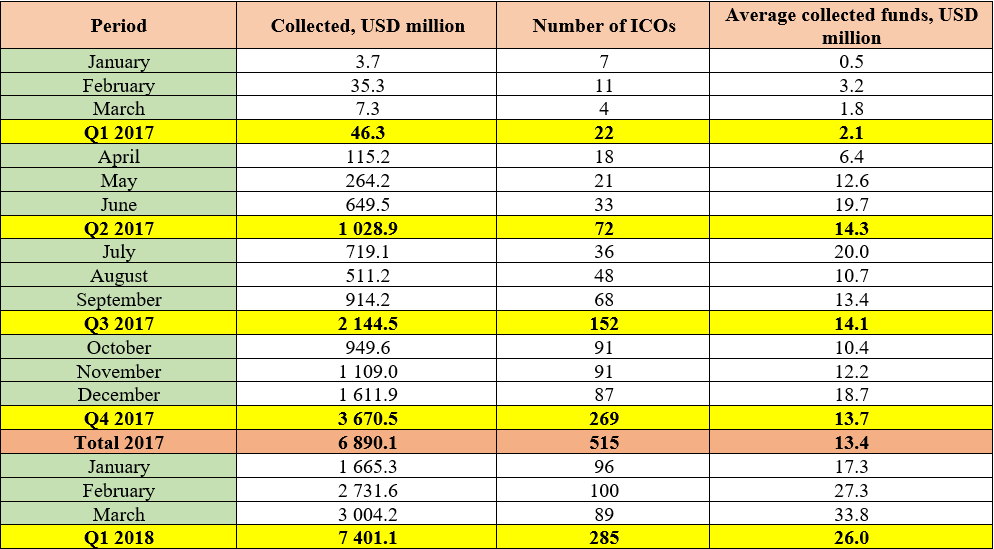
The amount of funds collected during the first quarter of 2018 is nearly identical to the amount collected over all previous years combined. The intensive growth in this market segment continues, despite the overall fall in cryptocurrency market capitalization and the process of state regulation that is gaining momentum. Table 1 and figure 1 show the results of an analysis of 800 ICOs completed since the beginning of 2017.
Table 1. Amount of collected funds and number of ICOs
Table 1 and figure 1 only show popular and/or successfully completed ICOs (i.e. ICOs which managed to collect the minimum declared amount of funds) and/or ICOs which tokens were listed on cryptoexchanges. However, information is not available for all ICOs, including on the amount of funds collected. So, if you take into account scams, unsuccessful projects and projects on which there is no information (based on the data from five analyzed trackers), the actual number of ICOs performed is double the aforementioned figure, i.e. there have been around 1,600 ICOs since the beginning of 2017.
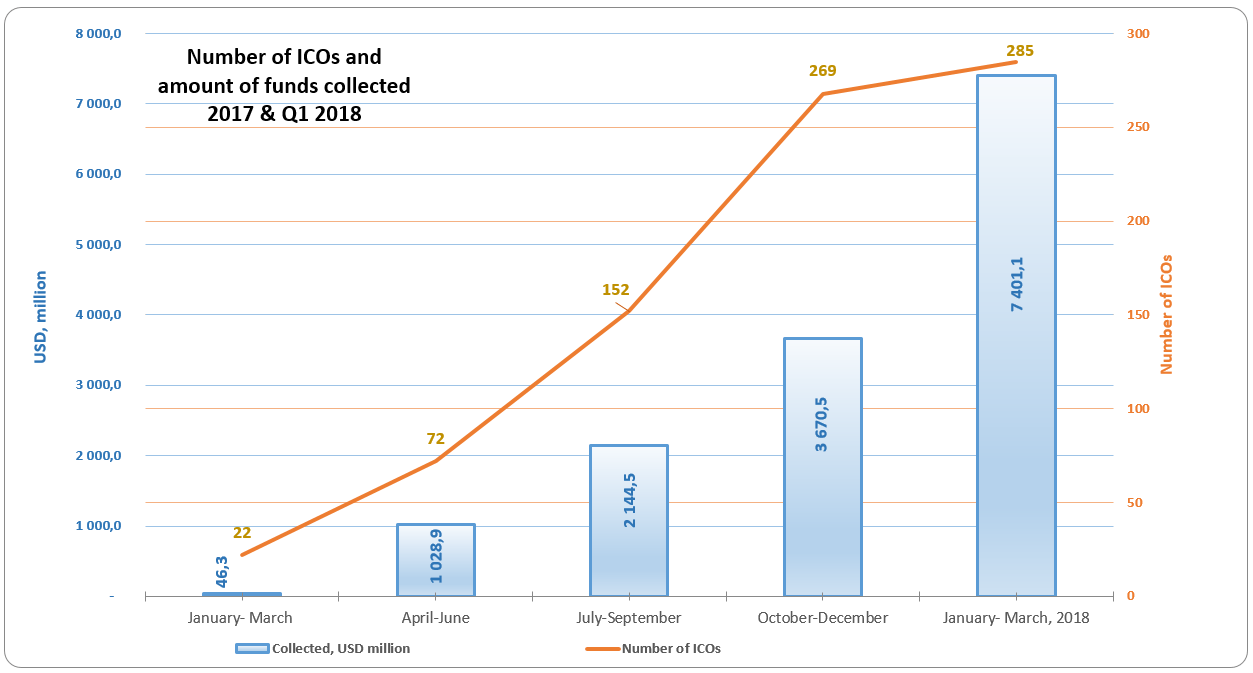
Figure 1. Quarterly breakdown of funds collected and number of ICOs since the start of 2017
The distinguishing feature of the first quarter of 2018 is the appearance of several major projects, such as the pre-ICOs of TON, Petro, Dragon Coin and others. The observed growth in collected funds took place due to the appearance of larger projects, not because of an increase in the number of ICOs.
2. Top ICOs
The largest projects by collected funds are shown in Table 2
Table 2. Top 10 ICOs by collected funds
* The category was established based on expert opinions.
** When compiling the lists of top ICOs, information from the websites tokendata.io, coinschedule.com and other specialized sources is used.
*** Token performance (token reward) was calculated as of April 6, 2018
Table 2 gives the top 10 largest ICOs by collected funds, most of which belong to the Infrastructure category. The projects from 2018 are the indisputable leaders.
One of the most interesting projects, The DAO, which collected a colossal amount of funds back in 2016 (more than 12 million ETH, i.e. more than $4.4 billion at today’s ETH exchange rate of $370), lost more than $60 million through a hacker attack on June 17, 2016, that exploited a vulnerability in the wallet smart contract code. Founder Stephan Tual called the identified vulnerability a recursive call, and it was the undoing of The DAO project.
The exchange listings of the EOS and Tezos projects in 2017 can be considered the most successful of the ten presented projects, as the token performance of these projects, i.e. the ratio of their current token price to their token sale price at the time of the ICO, is 5.87x and 5.29x (as of April 6, 2018). When considering this indicator, it is important to remember when the projects were completed, i.e. the more than 5x growth took place over approximately nine months. For example, the current market capitalization of EOS is around $4.5 billion, making it the sixth largest cryptoasset on the cryptocurrency market.
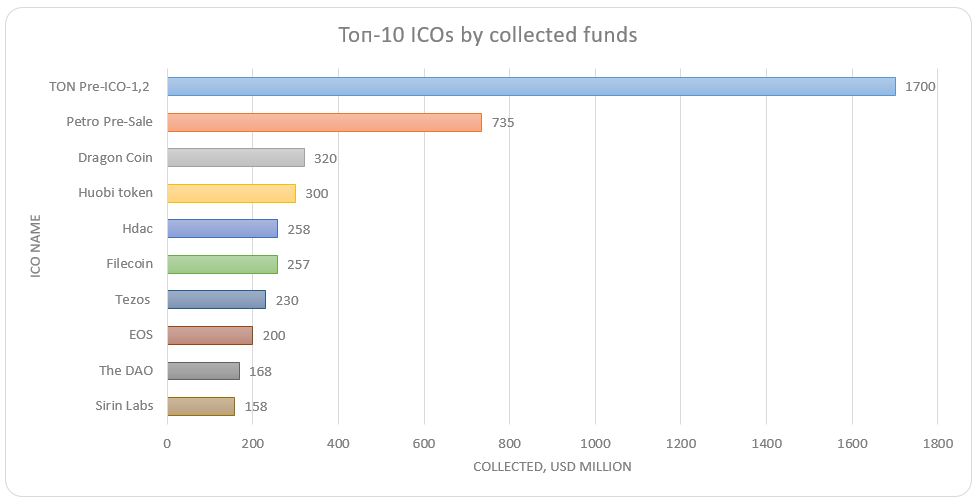
Figure 2. Top 10 ICOs by funds collected
The leader in the list is the TON project, which has already collected $1,700 million based on the results of its two private sales (Pre-ICO-1,2). The contributors to the project include major backers and venture funds. A third round is also planned. The TON blockchain has a scalable and flexible blockchain architecture capable of processing millions of transactions per second, making it a sort of alternative to VISA and Mastercard for the new decentralized economy. The TON platform is expected to include services such as data storage, simple wallets, integration with the Telegram Messenger and much more.
The Petro project, whose tokens will be secured by Venezuelan oil, comes in at number two in the list. The Petro token is the first attempt to sell a national cryptocurrency. The project website indicates that the pre-sale stage attained sales of more than $4,777 million yuan, or $735 million. According to the White Paper, if all the Petro tokens are sold during the pre-sale and ICO stages, the funds collected will equal around $4.3878 billion. The Petro ICO started on March 20.
The funds collected by the two leaders in the list (Table 2) might increase even further once the final figures are tallied on the completion of the ICOs.
3. Market performance indicators of past ICOs by year
The token performance (return, reward) and token/BTC reward indicators are used to assess the performance of ICO projects (see Table 3).
Table 3. Performance indicators on the ICO market
Tables 4, 5, and 6 and figures 3, 4, and 5 show the ten most effective projects based on the indicators token reward and token reward per month for various periods.
Table 4. Top 10 ICOs based on token reward (2014-2018)
* Data as of April 1, 2018. Summarized information from the websites: tokendata.io, icodrops.com, icodata.io
** Projects of the 2015, 2018 years did not enter in the list of Top-10
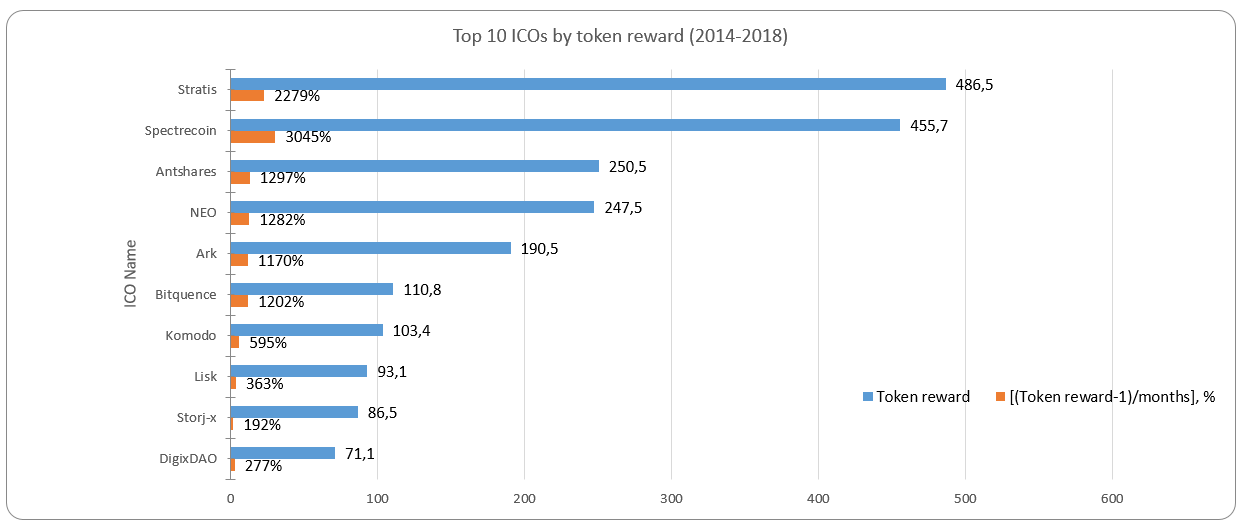
The token reward leader is the Stratis project, which completed its ICO in July 2016. This project’s tokens have increased in price by a factor of 486.5 over 21.3 months, from $0.007 to $3,480. Average monthly growth has equaled 2,279%. The table does not consider the performance of the Ethereum ICO (second largest capitalization among cryptocurrencies), the tokens of which cost $0.31 during the ICO in July 2014 and are now worth around $370 (i.e. a growth of almost 1,200x over less than four years). During its ICO, Ethereum collected around $18 million, and now has a capitalization of $37 billion.
Figure 3. Top 10 ICOs by token reward (2014-2018)
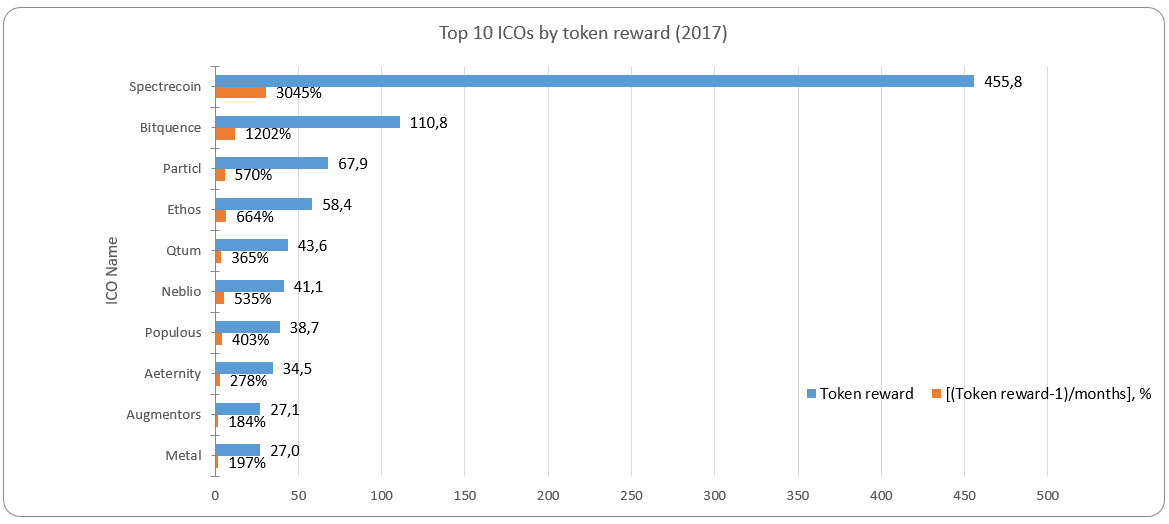
Table 5 and figure 4 show the ten projects of 2017 with the highest token reward. The token performance of these projects has equaled from 27x to 455x since the completion of the ICO, with the [(Token reward-1)/months] indicator reaching 3,045% per month.
Table 5. Top 10 ICOs by token reward (2017)
* Data as of April 1, 2018. Summarized information from the websites: tokendata.io, icodrops.com, icodata.io, coinschedule.com
The leader in 2017 was the Spectrecoin project, a privacy-focused cryptocurrency that ensures quick transaction confirmations and is integrated with Tor. Spectrecoin supports work with stealth addresses, and XSPEC is a working TOR coin with obfuscation.
Figure 4. Top 10 ICOs by token reward (2017)
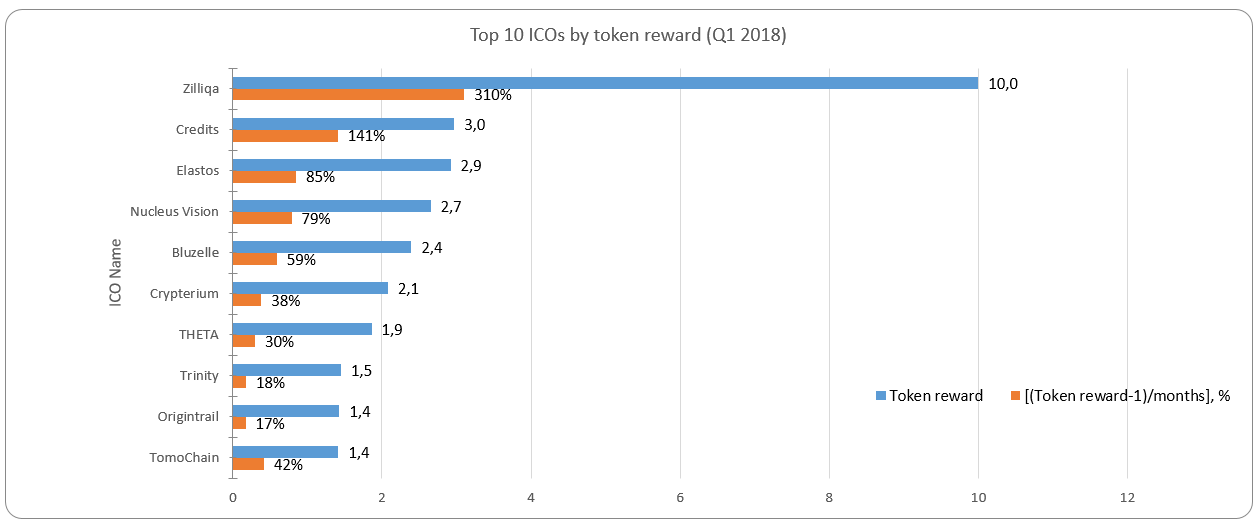
Table 6 and figure 5 show the ten projects of the first quarter of 2018 with the highest token reward. The token performance of these projects has equaled from 1.4x to 10x since the completion of the ICO, with the [(Token reward-1)/months] indicator reaching 310% per month.
Table 6. Top 10 ICOs by token reward (Q1 2018)
* Data as of April 1, 2018. Summarized information from the websites: tokendata.io, icodrops.com, icodata.io, coinschedule.com
The leader in the list for 2018 is the Zilliqa project. This is a high-capacity public blockchain platform designed to scale up to a thousand transactions per second. The ICO collected $22 million, and capitalization now equals $290 million with 7,143,552,186 ZIL tokens having been issued.
Figure 5. Top 10 ICOs by token reward (Q1 2018)
The most interesting of the projects in the top 10 by token reward and token reward per month [(token reward – 1)/ month] are the projects from 2016. The projects from the first quarter of 2018 look less attractive against the backdrop of the overall fall in the cryptocurrency market, but are nevertheless very appealing based on performance indicators specified above. For example, the Zilliqa project has achieved a token reward of around 310% per month (as of the start of April 2018).
More than 300 ICOs were performed during January-March 2018. If you only consider the data from the largest and most popular ICOs (see Table 1), which number around 285, the amount of collected funds equals at least $7.4 billion.
The amount of funds collected via ICOs has been growing annually since 2014. Even if one assumes that the funds collected over the next three quarters will remain the same, i.e. there will be no further growth, we are still looking at a sum of around $30 billion for 2018 (7.4*4 quarters = $29.6 billion).
If you factor in the exponential growth of the ICO market since early 2014, the amount of collected funds in 2019-2020 may equal $50 billion or more annually. It should be noted here, however, that the ICO market is also characterized by a fairly high level of volatility. The fluctuations in funds collected are not as drastic as those on the cryptocurrency market, but this segment of the crypto industry is also sensitive to the impact of regulatory processes. Therefore, the restrictions, and sometimes even bans, that are gradually being introduced in certain regions and on certain tokens and the ICO verification procedure (KYC) will naturally have an influence on the size and rates of development of this area. The possibility that new types of taxes and fees might be introduced, as is currently taking place on the cryptocurrency market and in certain countries (Japan, for instance), must also be taken into account.
At the end of 2017 the share of funds collected via ICOs for the year equaled less than 1% of cryptocurrency market capitalization, meaning that this segment has room to grow and is indeed growing rapidly!
The above information is a quantitative and qualitative market analysis developed based on certain efficiency indicators and proprietary methodologies. Such information is offered for information purposes only and may not be used as an investment, financial or any other professional advice or recommendation.
While the information in this document is believed to be accurate, ICOBox makes no representations or warranties, express or implied, with respect to the completeness or accuracy of the information contained herein. The information presented in this document may include certain statements, estimates, and projections. Such statements, estimates, and projections reflect various assumptions by ICOBox concerning anticipated trends, which assumptions may or may not materialize. No representations are made as to the accuracy of such statements, estimates or projections, and actual performance may be materially different from that set forth in such statements, estimates or projections. Prospective financial results may be affected by fluctuating economic and political conditions and are dependent upon the occurrence of future events that cannot be assured. ICOBox makes no warranty or assurance regarding the achievability of projections or the data, information, and assumptions relied upon herein. Opinions and estimates constitute our judgment as of the date of this material and are subject to change without notice. This document is for information purposes only and is not intended as an offer to sell securities, cryptocurrency or tokens, nor does it contain any recommendations or advice on any investments in any particular company or named assets. ICOBox expressly disclaims any and all liability for any representations, expressed or implied, contained in, or omitted from, this material. ICOBox is a provider of SaaS solutions for companies seeking to sell their products via distribution of tokens (ICO). ICOBox does and seeks to do business with companies covered in its research reports and buy any named assets.
Recommended Content
Editors’ Picks
Ripple wipes out weekly gains, experts comment on role of Ripple stablecoin

Ripple declined to $0.52 on Thursday, erasing all gains registered earlier this week. Ripple SVP Eric van Miltenburg’s comments on the firm’s stablecoin, and how it is expected to benefit the XRP Ledger and native token XRP have raised concerns among crypto experts.
Hedera HBAR slips nearly 10% after air is cleared on mistaken link with giant BlackRock

HBAR price is down nearly 10% on Thursday, partly erasing gains inspired by the misinterpreted link with BlackRock. Despite the recent correction, Hedera’s price is up 44% in the past seven days.
The reason behind Bonk’s 105% rise and if you should buy now Premium

Bonk price has shot up 105% in the past five weeks. A retracement into $0.0000216 or the $0.0000152 to $0.0000186 imbalance would be a good buying opportunity. Patient investors can expect double-digit gains from BONK that could extend up to 70%.
Injective price weakness persists despite over 5.9 million INJ tokens burned

Injective price is trading with a bearish bias, stuck in the lower section of the market range. The bearish outlook abounds despite the network's deflationary efforts to pump the price. Coupled with broader market gloom, INJ token’s doomed days may not be over yet.
Bitcoin: BTC post-halving rally could be partially priced in Premium

Bitcoin (BTC) price briefly slipped below the $60,000 level for the last three days, attracting buyers in this area as the fourth BTC halving is due in a few hours. Is the halving priced in for Bitcoin? Or will the pioneer crypto note more gains in the coming days?
