![]() Lorenzo Stroe
Lorenzo Stroe
Independent Analyst
- LTC/USD has been trading sideways for the past week.
- The resistance level at $50 remains as the most critical level to beat.
- A clear break of $50 could take LTC up to $60.
Litecoin is having a hard time deciding which direction to take. The digital asset couldn’t break $48 on June 4 and was rejected on June 5 as well. More importantly, bulls need to climb above $50 convincingly.
LTC/USD trading volume has been declining over the past week indicating that a significant move is on the way. LTC has dipped below the 12-EMA and the 26-EMA on the daily chart but has never closed below any of them. This indicates that bulls have more strength than bears and are willing to buy the dips.
Let’s look at some of the most important levels to beat and defend for LTC traders.
In the short-term, bulls are facing a mighty resistance level at $47.46 where the SMA50 (15-minutes), Fibonacci 38.2% (Daily), SMA10 (1-hour), middle Bollinger Band (1-hour) and the Pivot Point R2 (Weekly) are all converging.
There is also some resistance at $47.70 where the Upper Bollinger Band (15-minutes) and the Fibonacci 23.6% (Daily) are standing.
For support, bulls can look for the $47, psychological support level where the Fibonacci 61.8% (Daily) and the Lower Bollinger Band (1-hour) are uniting.
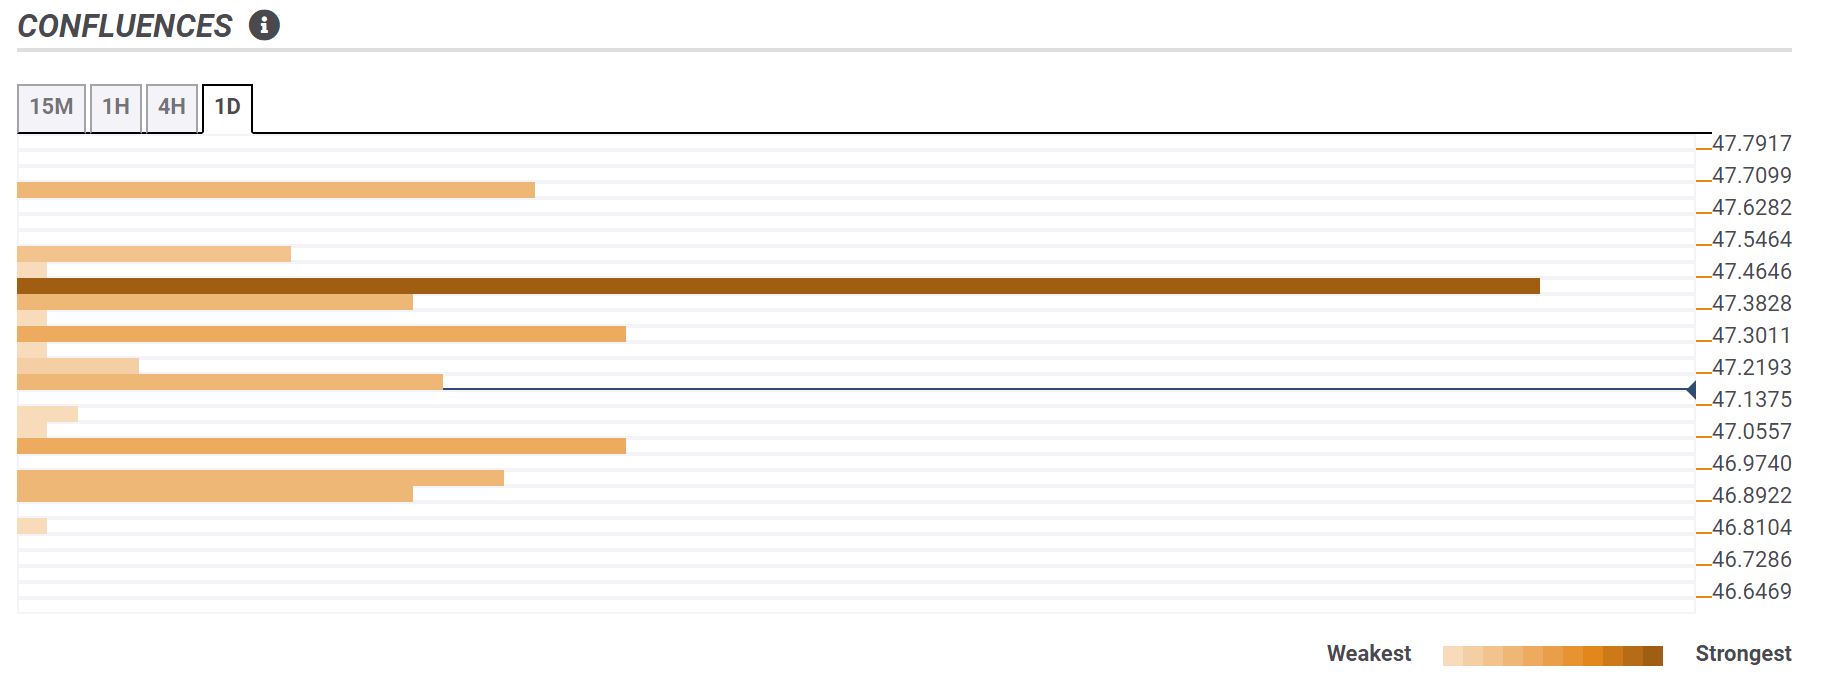
Confluence Detector
The Confluence Detector finds exciting opportunities using Technical Confluences. The TC is a tool to locate and point out those price levels where there is a congestion of indicators, moving averages, Fibonacci levels, Pivot Points, etc. Knowing where these congestion points are located is very useful for the trader, and can be used as a basis for different strategies.
This tool assigns a certain amount of “weight” to each indicator, and this “weight” can influence adjacents price levels. These weightings mean that one price level without any indicator or moving average but under the influence of two “strongly weighted” levels accumulate more resistance than their neighbors. In these cases, the tool signals resistance in apparently empty areas.
Learn more about Technical Confluence
LTC/USD technical levels
Note: All information on this page is subject to change. The use of this website constitutes acceptance of our user agreement. Please read our privacy policy and legal disclaimer. Opinions expressed at FXstreet.com are those of the individual authors and do not necessarily represent the opinion of FXstreet.com or its management. Risk Disclosure: Trading foreign exchange on margin carries a high level of risk, and may not be suitable for all investors. The high degree of leverage can work against you as well as for you. Before deciding to invest in foreign exchange you should carefully consider your investment objectives, level of experience, and risk appetite. The possibility exists that you could sustain a loss of some or all of your initial investment and therefore you should not invest money that you cannot afford to lose. You should be aware of all the risks associated with foreign exchange trading, and seek advice from an independent financial advisor if you have any doubts.
Recommended Content
Editors’ Picks
Why crypto may see a recovery right before or shortly after Bitcoin halving

Cryptocurrency market is bleeding, with Bitcoin price leading altcoins south in a broader market crash. The elevated risk levels have bulls sitting on their hands, but analysts from Santiment say this bleed may only be cauterized right before or shortly after the halving.
Manta Network price braces for volatility as $44 million worth of MANTA is due to flood markets

Manta Network (MANTA) price was not spared from the broader market crash instigated by a weakness in the Bitcoin (BTC) market. While analysts call a bottoming out in the BTC price, the Web3 modular ecosystem token could suffer further impact.
Bitcoin price uptrend to continue post-halving, Bernstein report says as traders remain in disarray

Bitcoin is dropping amid elevated risk levels in the market. It comes as traders count hours to the much-anticipated halving event. Amid the market lull, experts say we may not see a rally until after the halving.
OMNI post nearly 50% loss after airdrop and exchange listing

Omni network (OMNI) lost nearly 50% of its value on Wednesday after investors dumped the token following its listing on top crypto exchanges. A potential reason for the crash may be due to the wider crypto market slump.
Bitcoin: BTC’s rangebound movement leaves traders confused

Bitcoin (BTC) price has been hovering around the $70,000 psychological level for a few weeks, resulting in a rangebound movement. This development could lead to a massive liquidation on either side before a directional move is established.