The first day of August has begun positively for the cryptocurrency market as all of the top 10 coins are in the green zone.
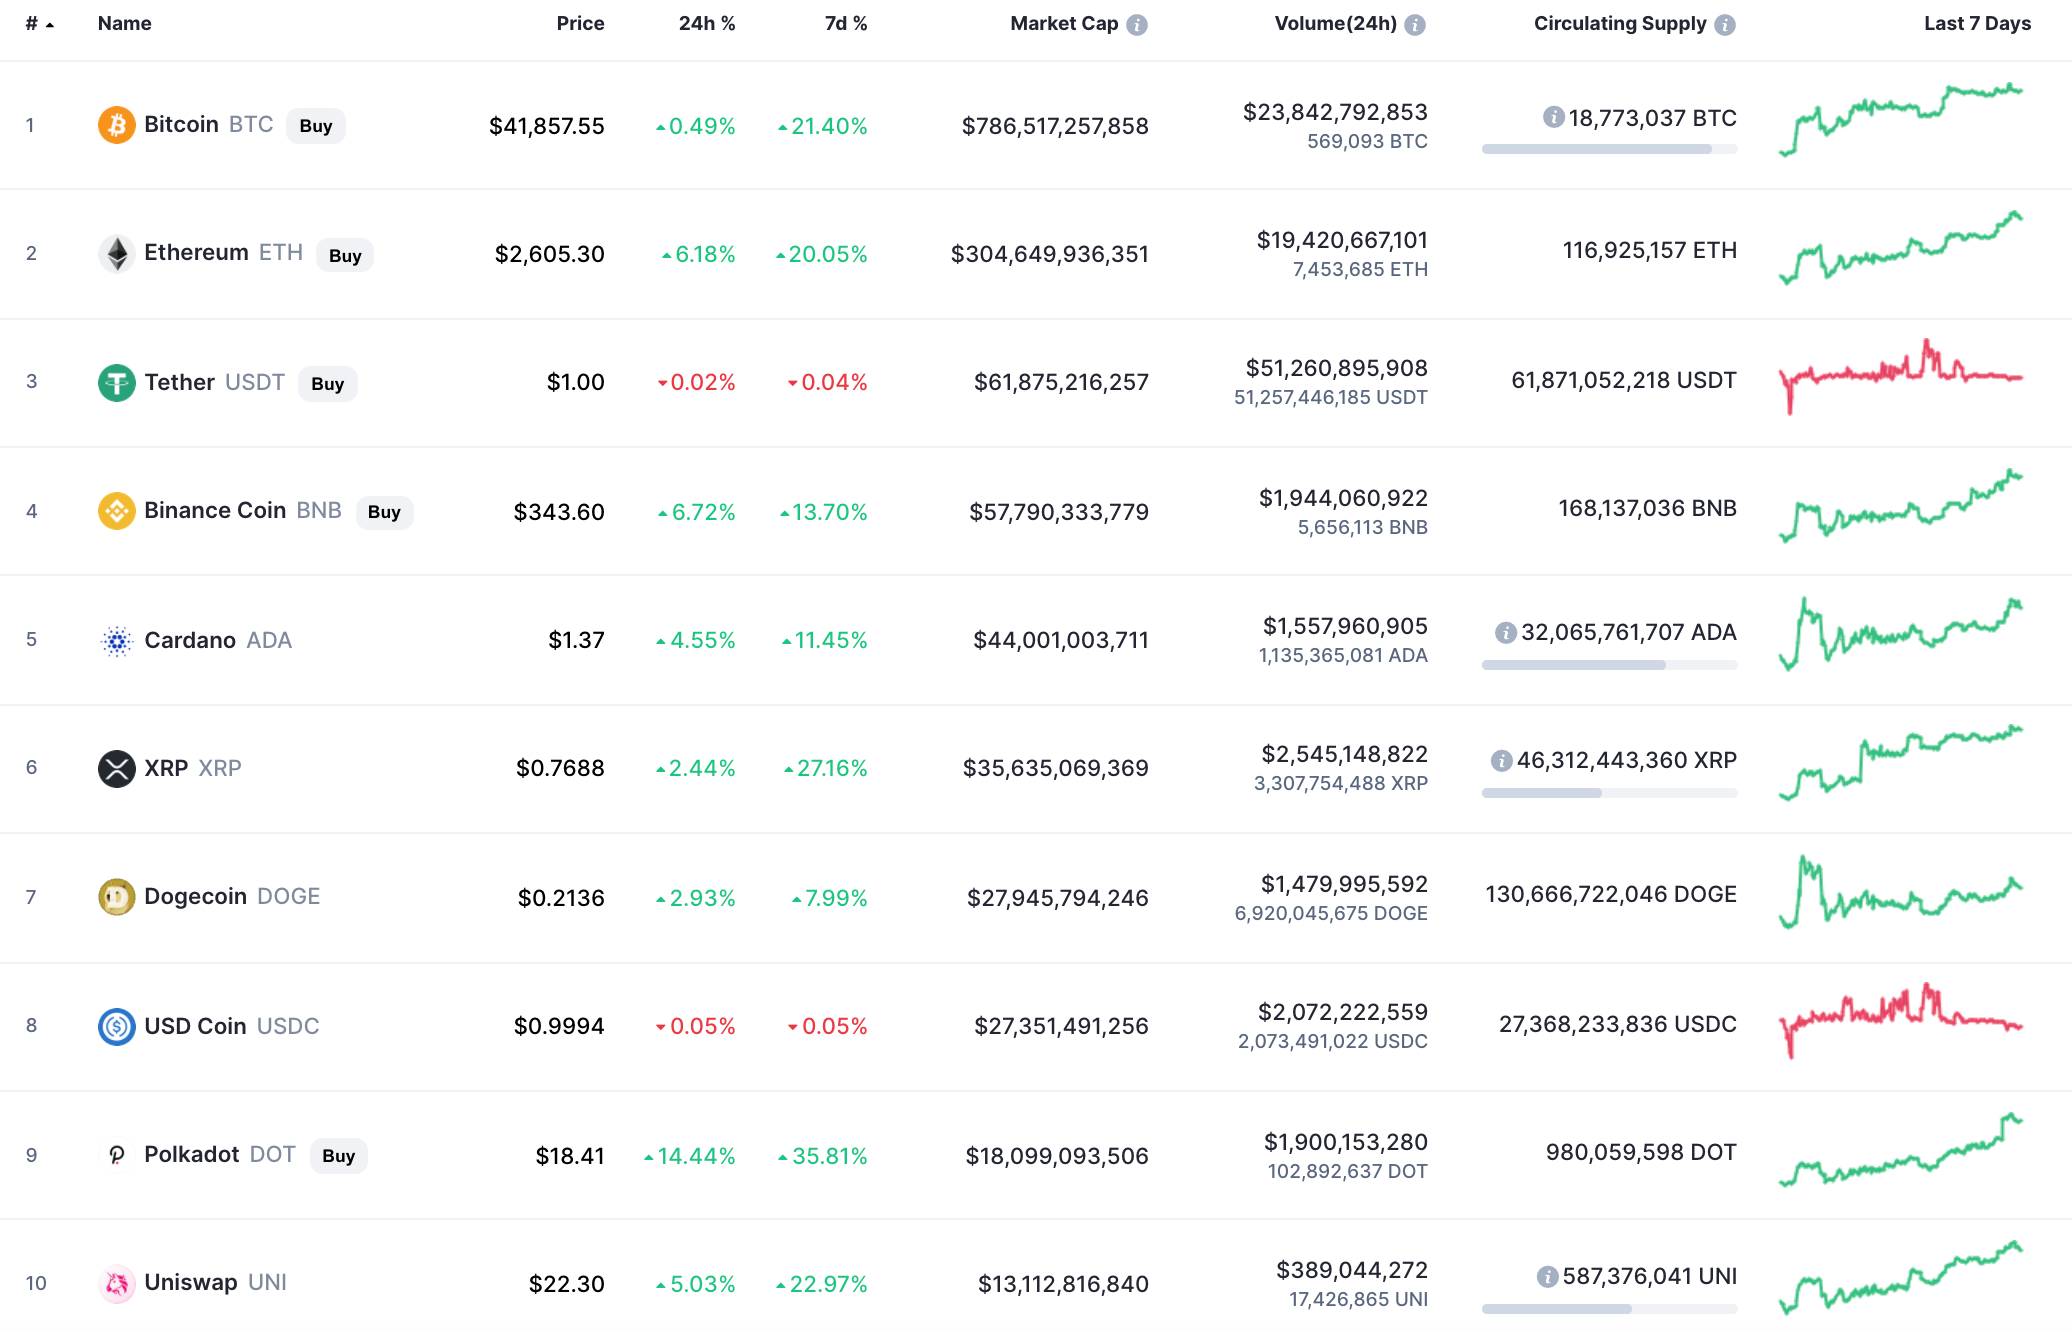
Top coins by CoinMarketCap
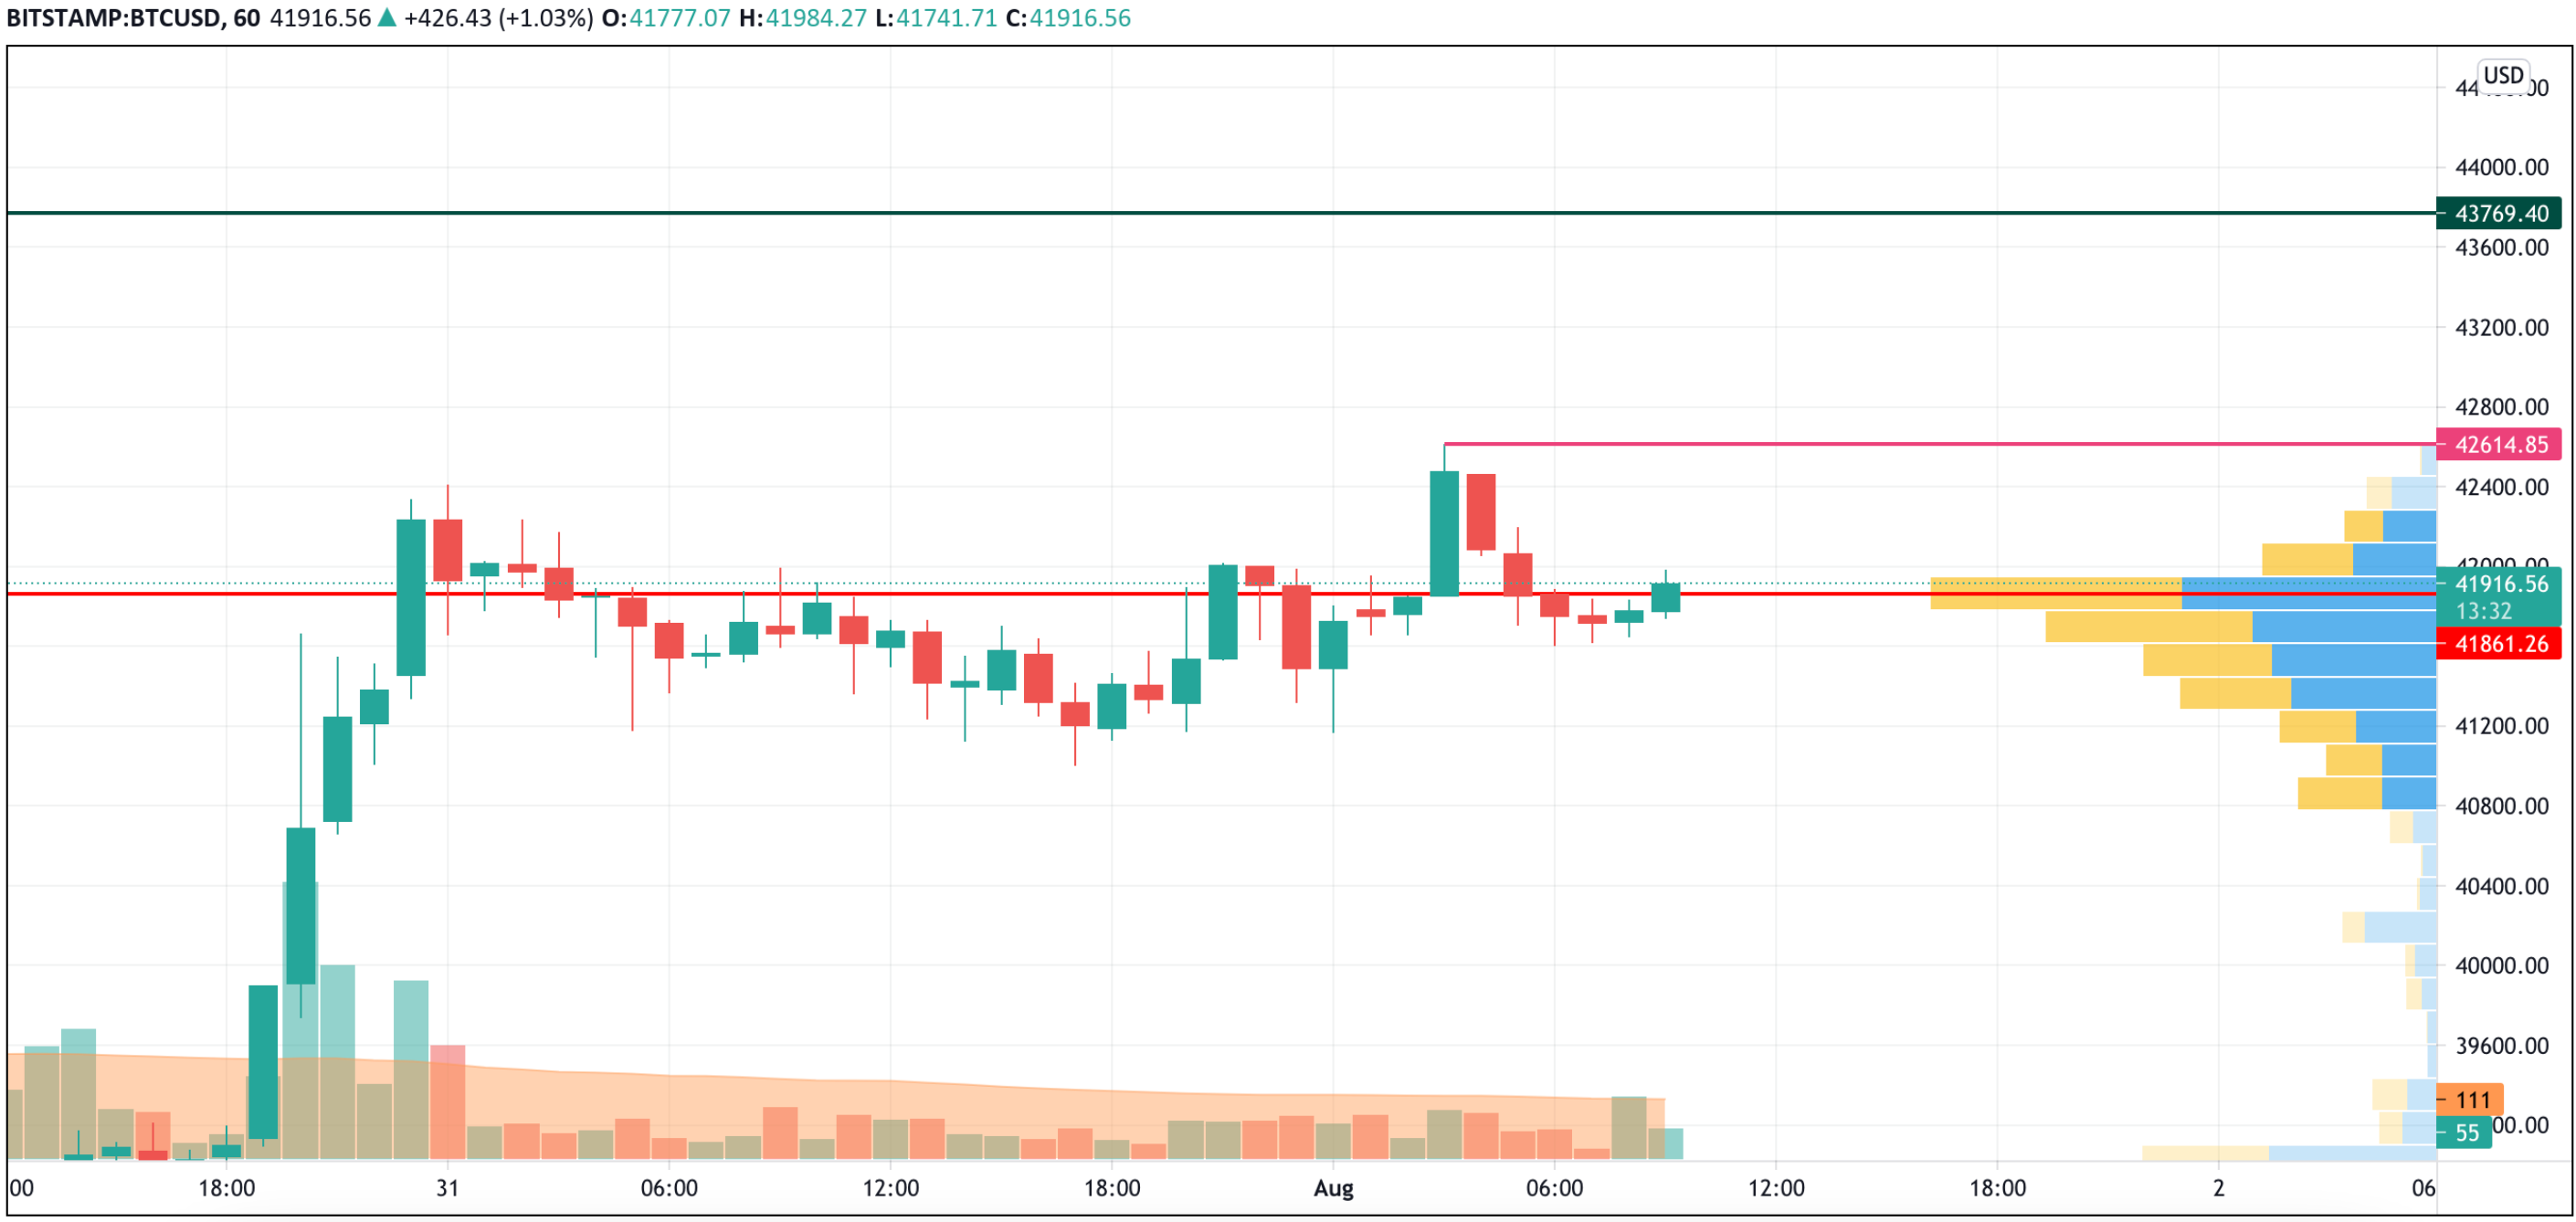
BTC/USD
The passing week has been positive for Bitcoin (BTC) as its rate has risen by 21%.
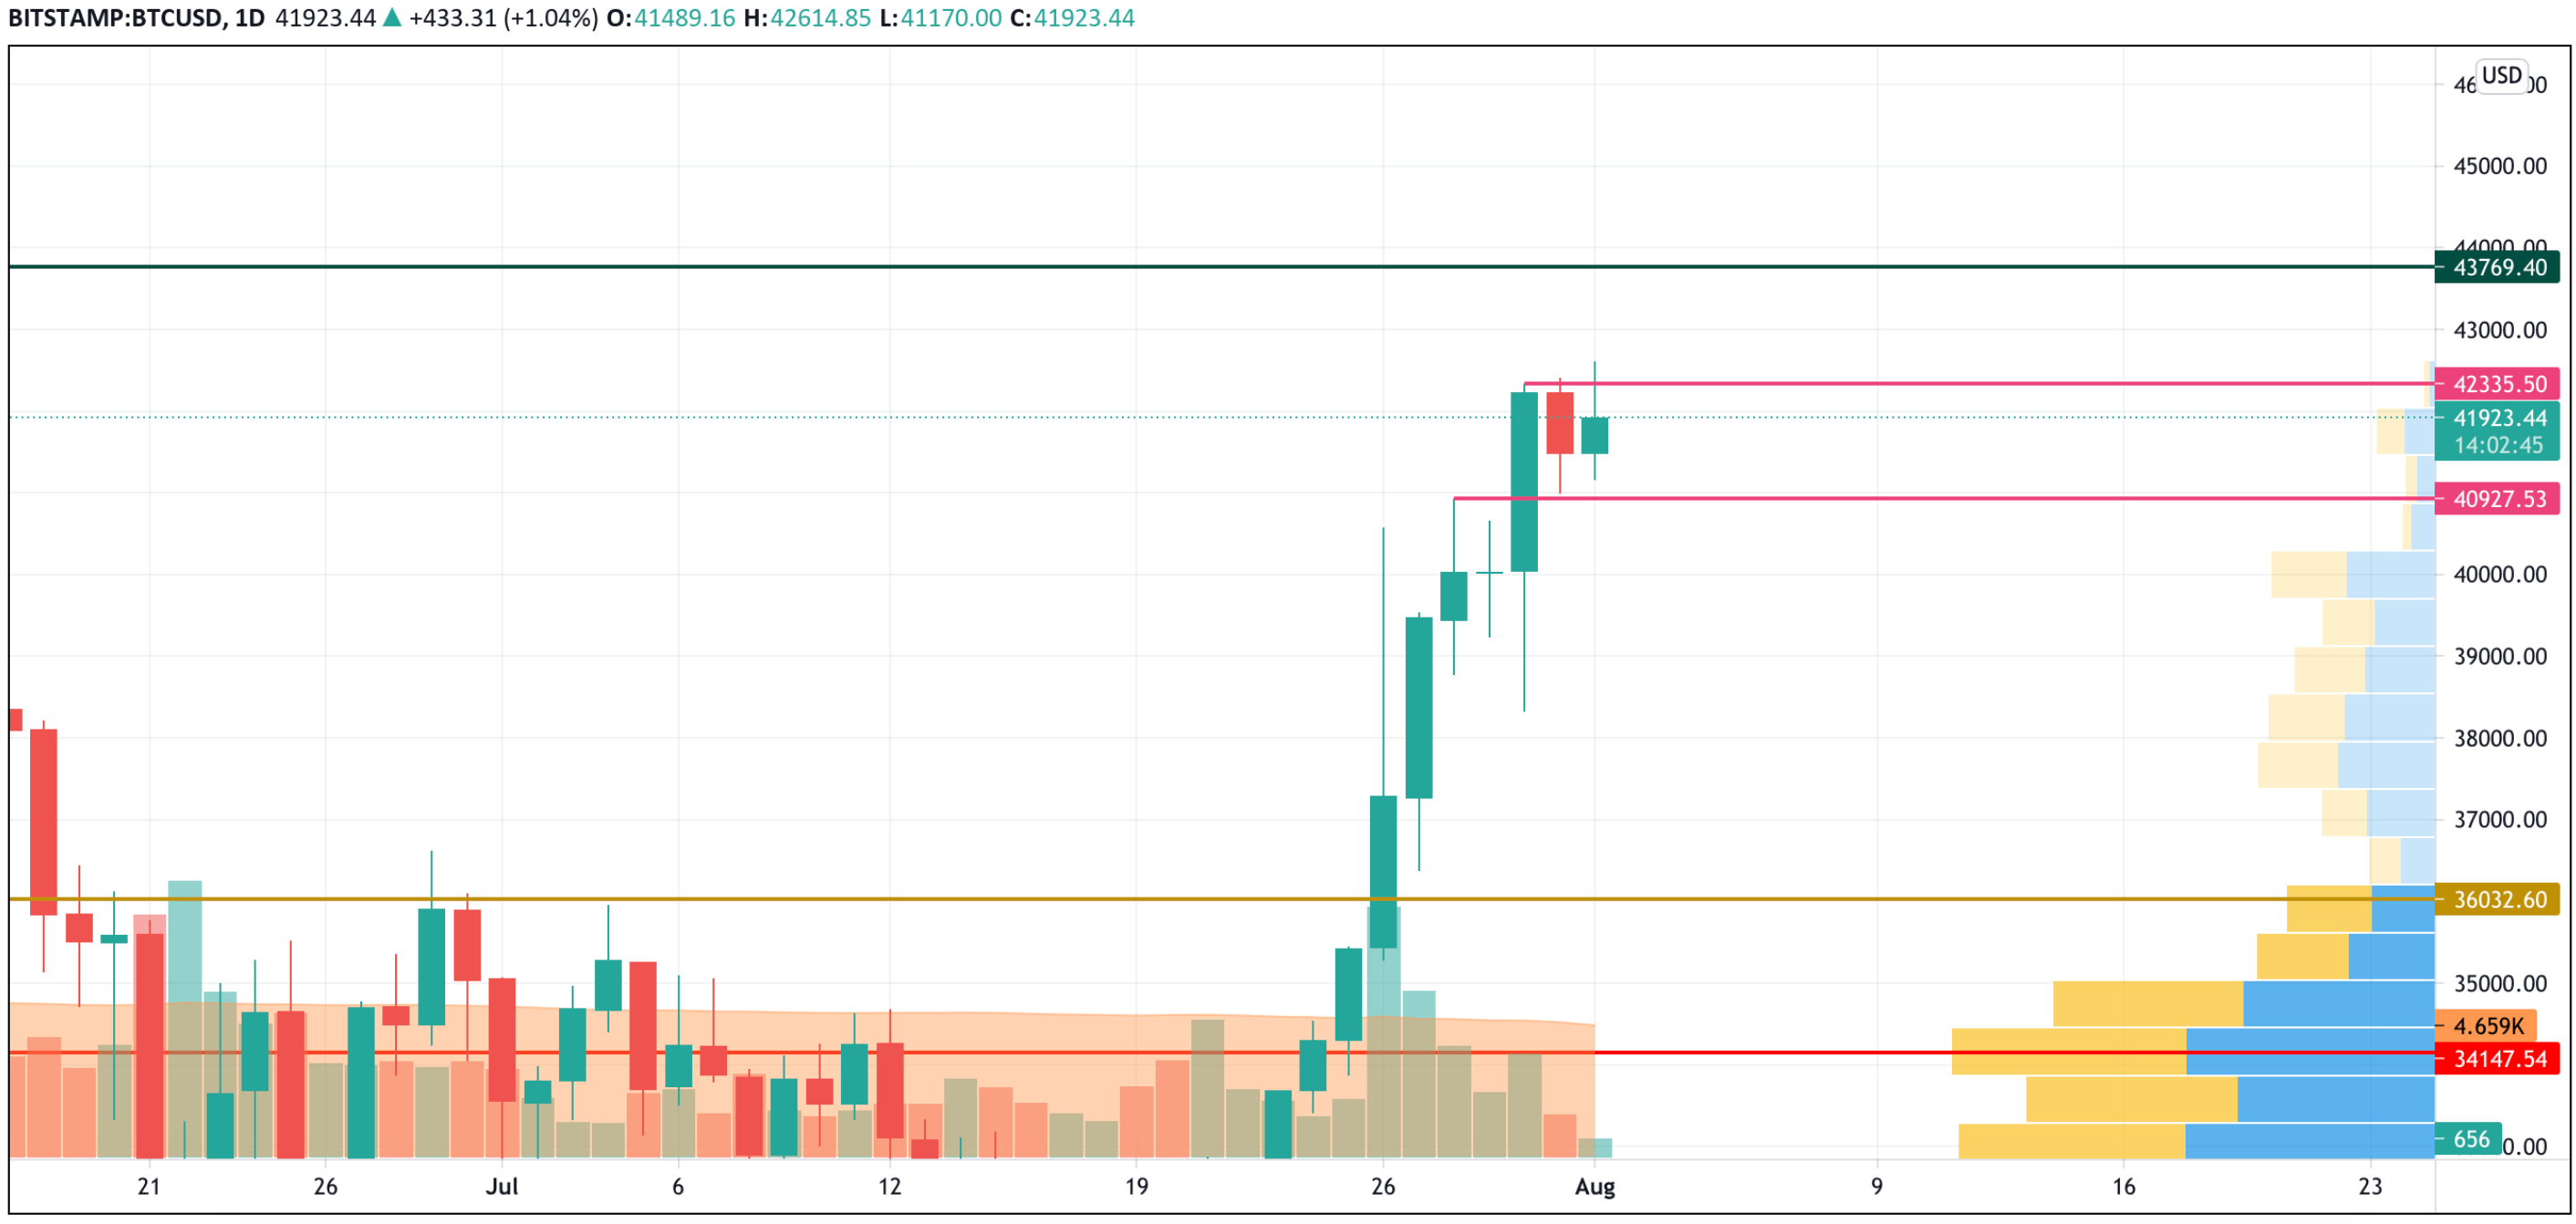
BTC/USD chart by TradingView
On the hourly chart, Bitcoin (BTC) set the local peak at around $42,614, followed by a short-term decline. After testing the liquidity zone at $41,800, bulls are trying to come back, accompanied by increasing trading volume.
If they can manage to break the local resistance, there are chances to get to $43,000 by the end of the day.
BTC/USD chart by TradingView
On the bigger time frame, the chief crypto is stuck between the support at $41,000 and resistance at $42,335. The trading volume has declined, which means that traders are still accumulating power for a price blast. If they break the resistance, the next level of $43,700 may be attained by the end of the next week.
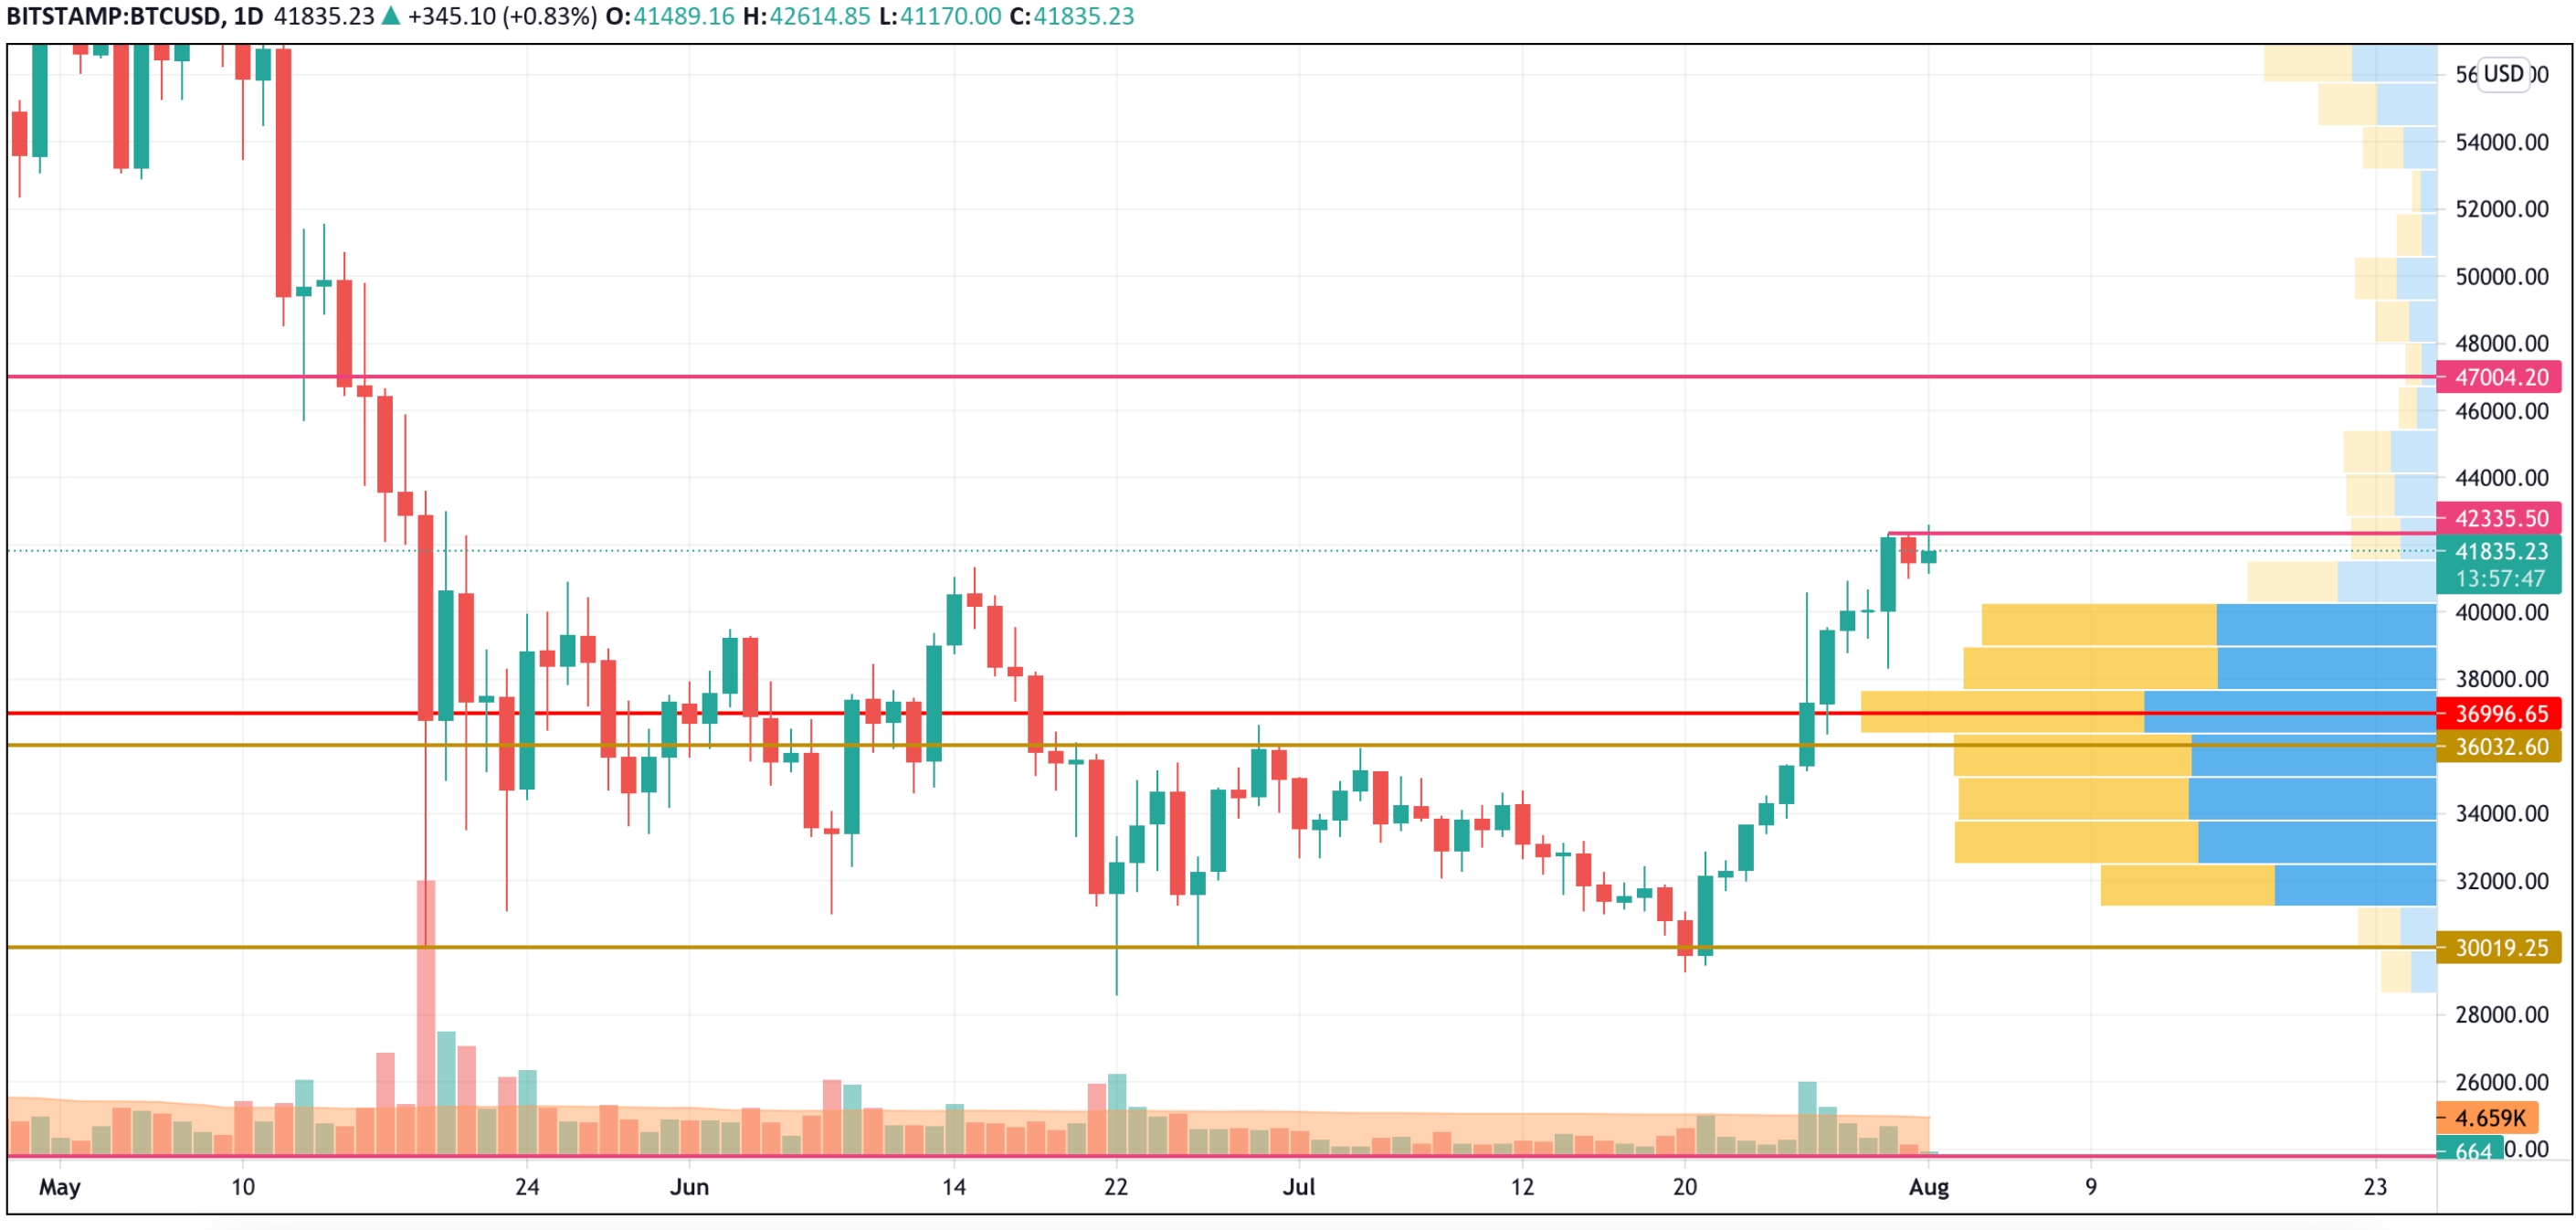
BTC/USD chart by TradingView
According to the weekly chart, Bitcoin (BTC) is about to break the resistance at $42,300 as bears are not showing any efforts to push the rate down. If the breakout occurs, the next area at which sellers can get back in the game is $47,000.
Bitcoin is trading at $41,821 at press time.
Any financial and market information given on U.Today is written for informational purposes only. Conduct your own research by contacting financial experts before making any investment decisions.
Recommended Content
Editors’ Picks
Ethereum dips slightly amid Renzo depeg, BlackRock spot ETH ETF amendment

Ethereum (ETH) suffered a brief decline on Wednesday afternoon despite increased accumulation from whales. This follows Ethereum restaking protocol Renzo restaked ETH (ezETH) crashing from its 1:1 peg with ETH and increased activities surrounding spot Ethereum ETFs.
Injective price weakness persists despite over 5.9 million INJ tokens burned
Injective (INJ) price is trading with a bearish bias, stuck in the lower section of the market range. The bearish outlook abounds despite the network's deflationary efforts to pump the price. Coupled with broader market gloom, INJ token’s doomed days may not be over yet.
US intensifies battle against crypto privacy protocols following crackdown on Samourai Wallet

CEO Keonne Rodriguez and CTO William Lonergan of Samourai Wallet were arrested by the US Department of Justice (DoJ) on Wednesday and charged with $100 million in money laundering on a count and illegal money transmitting on another count. This move could see privacy-focused cryptocurrencies take a dip.
Near Protocol Price Prediction: NEAR fulfills targets but a 10% correction may be on the horizon
Near Protocol price has completed a 55% mean reversal from the bottom of the market range at $4.27. Amid growing bearish activity, NEAR could drop 10% to the $6.00 psychological level before a potential recovery. A break and close above $7.95 would invalidate the downleg thesis.
Bitcoin: BTC post-halving rally could be partially priced in Premium

Bitcoin (BTC) price briefly slipped below the $60,000 level for the last three days, attracting buyers in this area as the fourth BTC halving is due in a few hours. Is the halving priced in for Bitcoin? Or will the pioneer crypto note more gains in the coming days?