For almost three months now, the price of the crude oil future has been moving in a tight sideways range of a little over three dollars. The price is oscillating aimlessly back and forth between 52 and 55 dollars. Two breakouts towards the top in mid-December and the beginning of January both failed miserably. Why is that?
From a chart-related and a “fundamental” point of view, we are in a stalemate. While in the mid-term, the advantage in the chart can still be quite clearly seen on the long side, the situation with the COT data looks completely different. As we can see in image 1, the commercial hedgers have accumulated a historically large short positioning (red line in the COT report); on the other hand, the funds and hedge funds have amassed historically long positions in their securities accounts (blue line in the COT report).
The current positions are even outperforming the previous maximum values from June 2014. And if we remember, at the time, the fact that the upward trend line was undercut, combined with the COT positions, was the starting signal for a gigantic sell-off.
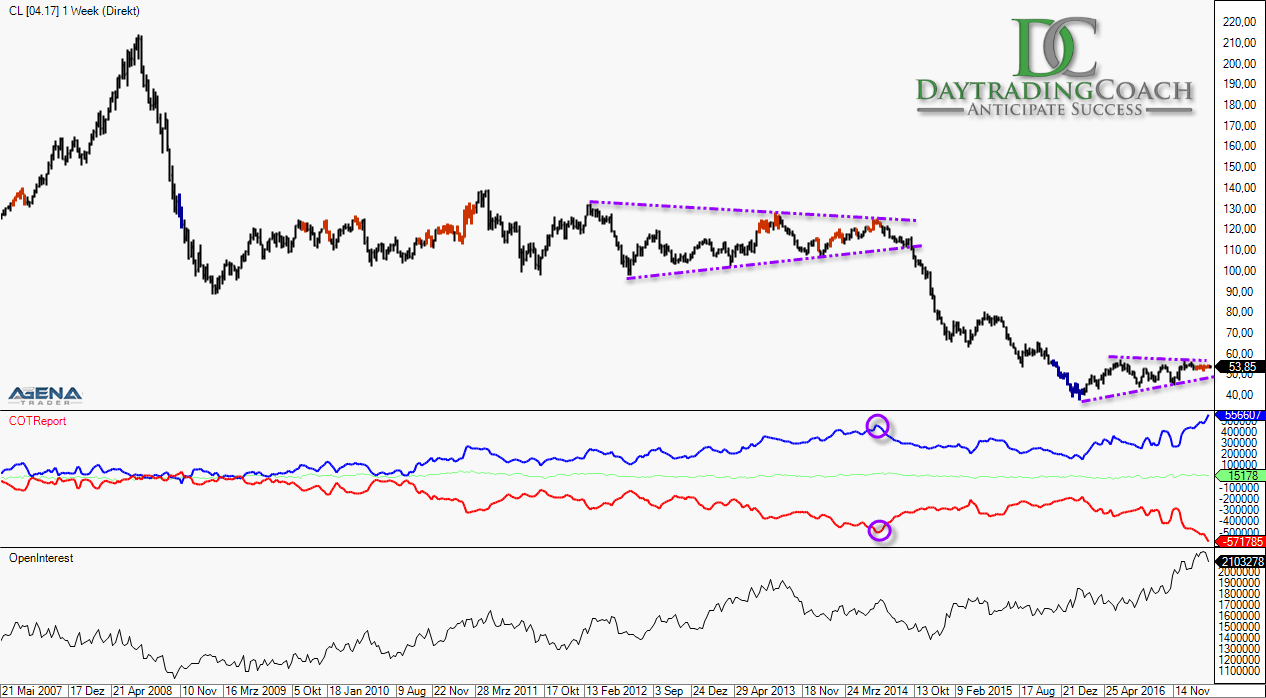
The open interest, which specifies how many futures contracts are currently being held overall, has reached a historically high magnitude. Normally, these extreme values indicate an imminent trend change, which is then followed by a slightly larger movement. In this case, the movement should go in a southerly direction, analogously to the very similar situation in the year 2014. This is also my preferred scenario, the chart-related upward trend notwithstanding.
In the daily chart, one can clearly see the sideways range. The question now is: in which direction should one enter – and above all, when?
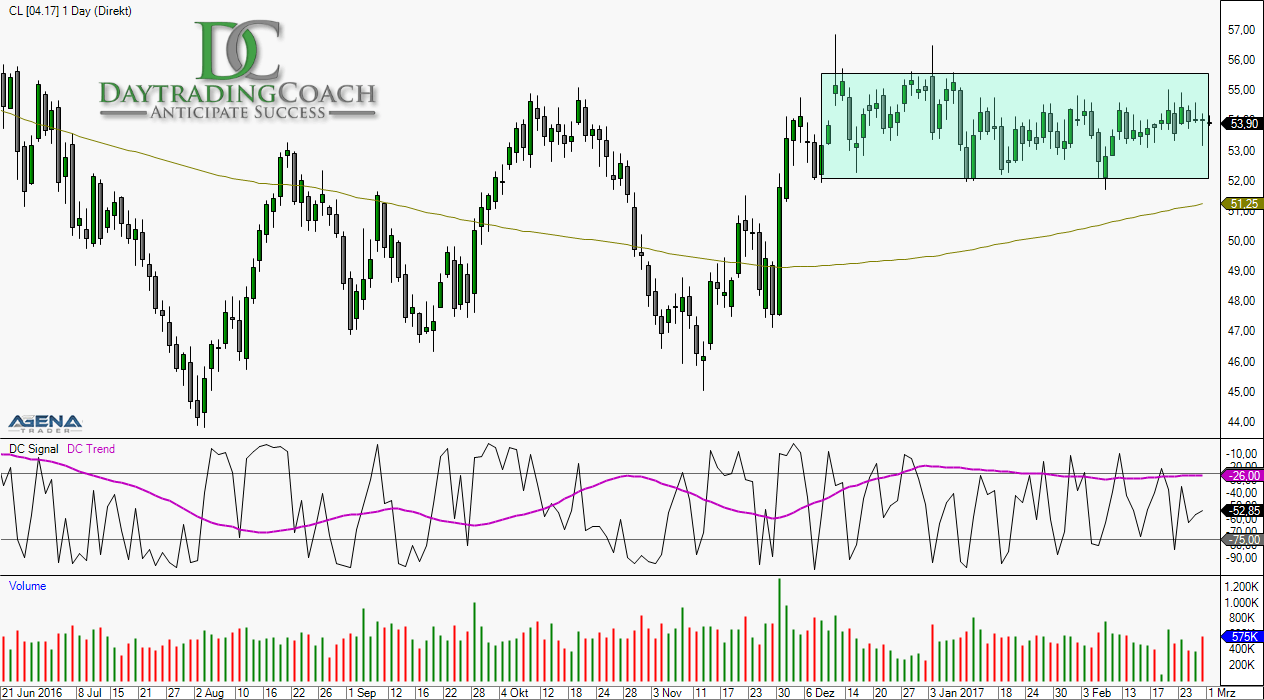
Since the breakouts (two towards the top, one in a downwards direction) have, until now, consistently been failed breakouts from out of the range, another course of action lends itself. In situations such as this, I prefer to take action at the extreme points of the sideways range. Therefore, in this case, I look for short entries at the upper end of the range. I only want to be stopped out once a renewed breakout is completed at the upper side.
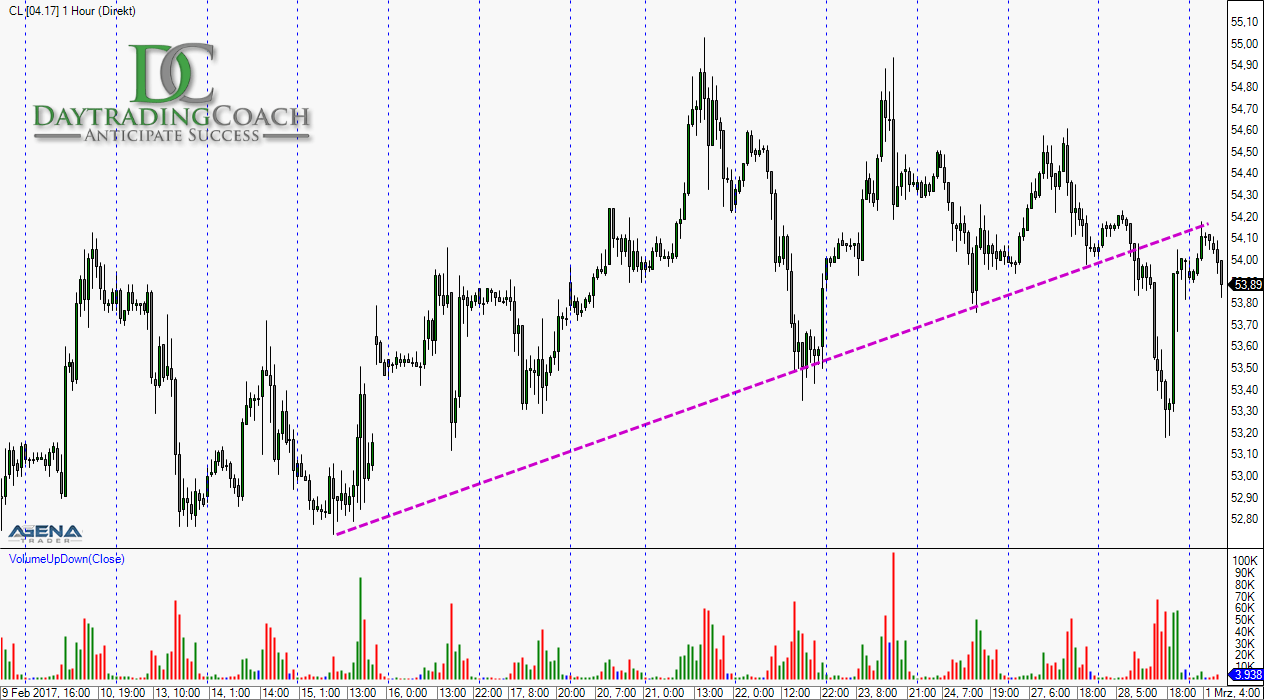
In the third screenshot, one can see a simple possibility to go short in the hourly chart in oil. If there is a breakout below the trend line, one could open a position. However, we can also see that downwards momentum has been retrieved right back again, and that oil has marked another 100 ticks upwards in a typical “V” movement. Precisely this is the problem in sideways phases: the markets change direction very quickly.
At the moment, it all looks as though crude oil is starting another attempt to exit the range in an upwards direction once again. I would no longer trade this whole thing, since I am wondering where the money for any further long positions of the funds and hedge funds is supposed to come from – seeing as they are already in a historical long alignment. I will wait until a chart-related short situation becomes available, and will then strike once more.
Until then, I wish you continued successful trading!
Disclaimer:
Exchange transactions are associated with significant risks. Those who trade on the financial and commodity markets must familiarize themselves with these risks. Possible analyses, techniques and methods presented here are not an invitation to trade on the financial and commodity markets. They serve only for illustration, further education, and information purposes, and do not constitute investment advice or personal recommendations in any way. They are intended only to facilitate the customer’s investment decision, and do not replace the advice of an investor or specific investment advice. The customer trades completely at his or her own risk.
Recommended Content
Editors’ Picks
EUR/USD climbs to 10-day highs above 1.0700

EUR/USD gained traction and rose to its highest level in over a week above 1.0700 in the American session on Tuesday. The renewed US Dollar weakness following the disappointing PMI data helps the pair stretch higher.
GBP/USD extends recovery beyond 1.2400 on broad USD weakness

GBP/USD gathered bullish momentum and extended its daily rebound toward 1.2450 in the second half of the day. The US Dollar came under heavy selling pressure after weaker-than-forecast PMI data and fueled the pair's rally.
Gold rebounds to $2,320 as US yields turn south

Gold reversed its direction and rose to the $2,320 area, erasing a large portion of its daily losses in the process. The benchmark 10-year US Treasury bond yield stays in the red below 4.6% following the weak US PMI data and supports XAU/USD.
Here’s why Ondo price hit new ATH amid bearish market outlook Premium

Ondo price shows no signs of slowing down after setting up an all-time high (ATH) at $1.05 on March 31. This development is likely to be followed by a correction and ATH but not necessarily in that order.
Germany’s economic come back

Germany is the sick man of Europe no more. Thanks to its service sector, it now appears that it will exit recession, and the economic future could be bright. The PMI data for April surprised on the upside for Germany, led by the service sector.