(Italics: Previous Analysis Due to Limited Price Change)
US Dollar Index (Daily Timeframe):
Against a basket of six international currencies, the US dollar index settled the week in positive territory, up 0.5 percent. Following a bullish outside reversal from support at 94.65 (complemented by a 61.8% Fibonacci retracement at 94.68) earlier in the month, a spirited recovery emerged Tuesday and engulfed resistance at 95.53. Having seen 95.53 serve as support at the tail end of the week, the index is tipped to shake hands with local trendline resistance this week, drawn from the high 96.91. Should bullish forces overthrow the aforementioned trendline resistance, Quasimodo resistance calls for attention at 96.40.
Out of the relative strength index (RSI), the indicator’s value touched the lower side of the 50.00 centreline heading into the close. Voyaging north of the latter—movement indicating positive momentum—helps reaffirm price support at 95.53. Rejecting 50.00, on the other hand, signals fading upside momentum and could pressure current price support.
In terms of trend, the weekly timeframe shows an indecisive market since 2015, ranging between 103.82 and 88.25. The daily timeframe, however, has displayed an upside bias since price made contact with support from 89.69 in May (2021), established through a series of higher highs and higher lows.

EUR/USD:
Weekly timeframe:
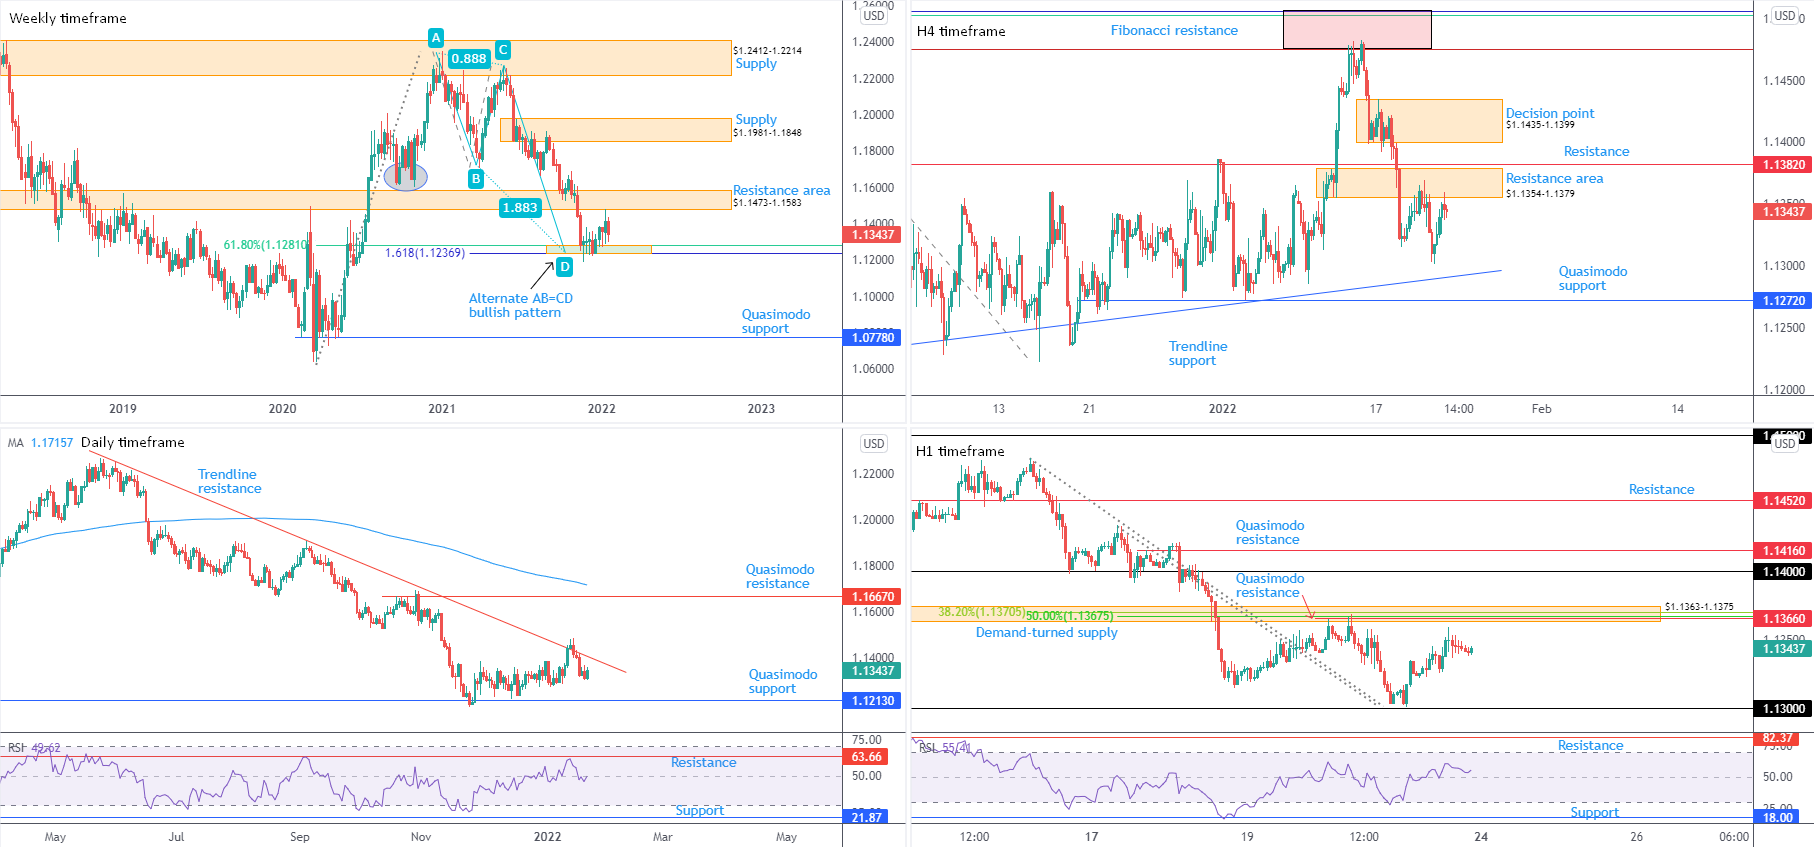
Down 0.6 percent on the week, buyers and sellers have ‘boxed’ themselves in between long-standing resistance from $1.1473-1.1583 (active S/R since late 2017) and Fibonacci support at $1.1237-1.1281. Made up of a 61.8% Fibonacci retracement at $1.1281 and a 1.618% Fibonacci projection from $1.1237, this area delivered a floor heading into the close of 2021. ‘Harmonic’ traders will also acknowledge $1.1237 represents what’s known as an ‘alternate’ AB=CD formation (extended D leg).
Strengthening the aforementioned resistance area’s presence, however, is the currency pair taking out 2nd November low (2020) at $1.1603 in late September (2021), suggesting a downtrend on the weekly timeframe. This is reinforced by the monthly timeframe’s long-term (some would say ‘primary’) downtrend since mid-2008.
Daily timeframe:
Aiding the test of the lower edge of weekly resistance at $1.1473-1.1583 was a 7-month trendline resistance on the daily timeframe, extended from the high $1.2254. Albeit tipped to slip further south of trendline resistance, price stalled heading into mid-week trade. Should bearish follow-through emerge this week, Quasimodo support offers an obvious target at $1.1213.
According to the relative strength index (RSI), the indicator remains hugging the 50.00 centreline. Voyaging under the latter underpins the bearish narrative on this scale, informing traders that average losses exceed average gains: negative momentum.
H4 timeframe:
A closer reading of price action on the H4 scale shows resistance at $1.1354-1.1379—a prior decision point positioned a handful of pips beneath resistance at $1.1382—remains in force. Some technicians will claim the area is vulnerable, as price failed to reach trendline support, drawn from the low $1.1186, and neighbouring Quasimodo support tucked just beneath at $1.1272. Traders, therefore, are urged to pencil in the possibility of price pursuing higher levels and taking aim at the decision point from $1.1435-1.1399 this week.
H1 timeframe:
Friday finished levelling off ahead of demand-turned supply from $1.1363-1.1375, an area housing Quasimodo resistance at $1.1366, a 38.2% Fibonacci retracement at $1.1371 and a 50.0% retracement from $1.1368. This followed an earlier near-test of $1.13. Having $1.1363-1.1375 sharing chart space with H4 resistance at $1.1354-1.1379, a drop from the H1 zone may emerge, once again.
Territory above H1 supply points to $1.14 and a Quasimodo resistance from $1.1416, with subsequent outperformance exposing resistance at $1.1452.
The relative strength index (RSI), after retesting the 50.00 centreline as support, cemented a position above the midline into the close, highlighting positive momentum (average gains exceeding average losses).
Observed Technical Levels:
Long term:
The combination of weekly price recently touching gloves with resistance at $1.1473-1.1583 and the daily timeframe holding beneath trendline resistance, along with the monthly, weekly and daily timeframes exhibiting a downside bias, sellers have the upper hand, technically speaking.
Short term:
On account of the image out of the higher timeframes, two potential bearish scenarios could unfold this week:
- H4 holds resistance at $1.1354-1.1379 and price pursues deeper water, targeting H4 trendline support and Quasimodo support at $1.1272. This may also see H1 tag supply-turned demand from $1.1363-1.1375, and associated technical confluence.
- Alternatively, the $1.14 level calls price. Placed within a H4 decision point at $1.1435-1.1399, bears could make an attempt to show from here.
AUD/USD:
Weekly timeframe:
Prime support at $0.6968-0.7242 continues to play a crucial role on the weekly timeframe. Bulls, as you can see, embraced a modestly bullish stance into the close of 2021. 2022, on the other hand, has been relatively undecided so far. Should buyers press higher, resistance is at $0.7501. Manoeuvring beneath $0.6968-0.7242 reveals support at $0.6673 and a 50.0% retracement at $0.6764.
Since mid-Feb tops at $0.8007 (2021), sellers have taken the wheel. This followed a bullish period since pandemic lows of $0.5506 (March 2020), therefore some technical analysts may view this correction as a dip-buying opportunity. However, it is important to note that the monthly timeframe has been entrenched within a large-scale downtrend from mid-2011.
Daily timeframe:
Thursday left behind a shooting star candle formation (typically considered a bearish arrangement) a touch under resistance between $0.7410 (the 200-day simple moving average) and $0.7315 (a 100% Fibonacci projection).
Aside from the $0.7130 low (7th January) and the $0.7082 low (20th December [2021]), obvious support at $0.7021 calls for attention in the event sellers regain control.
The relative strength index (RSI) ended the week offering an uncommitted tone, enclosing the 50.00 centreline since late December.
H4 timeframe:
Following Thursday’s rejection of the $0.7294-0.7267 decision point—arranged just south of prime resistance at $0.7323-0.7308—Friday bonded with demand at $0.7169-0.7187. Subdued buying interest from the latter brings light to Quasimodo support at $0.7146.
Another key level to be mindful of on the H4 scale is support from $0.7097, accompanied by a 1.618% Fibonacci extension at $0.7102 and a 1.272% Fibonacci projection at $0.7094.
H1 timeframe:
$0.72 served short-term flow an intraday ceiling on Friday, withstanding several forceful upside attempts. Aided by ‘local’ trendline support-turned resistance, drawn from the low $0.7170, and resistance at $0.7207, price settled the week on the doorstep of Quasimodo support at $0.7168 (set a pip under H4 demand highlighted above at $0.7169-0.7187). Further selling in this market places demand plotted at $0.7126-0.7141 in view.
From the relative strength index (RSI), following a 50.00 centreline test as resistance, the indicator’s value is poised to approach oversold space.
Observed Technical Levels:
Long term:
Although weekly price resides within prime support at $0.6968-0.7242, the lack of buying seen recently and the daily timeframe coming from $0.7410-0.7315 may hand the baton to sellers this week.
Short term:
In line with higher timeframes, taking out H4 demand at $0.7169-0.7187 is likely in the offing early week to test H4 Quasimodo support at $0.7146, which aligns closely with H1 demand at $0.7126-0.7141. As a result, a short-term bearish scenario could unfold beneath H1 Quasimodo support at $0.7168.

USD/JPY:
Weekly timeframe:
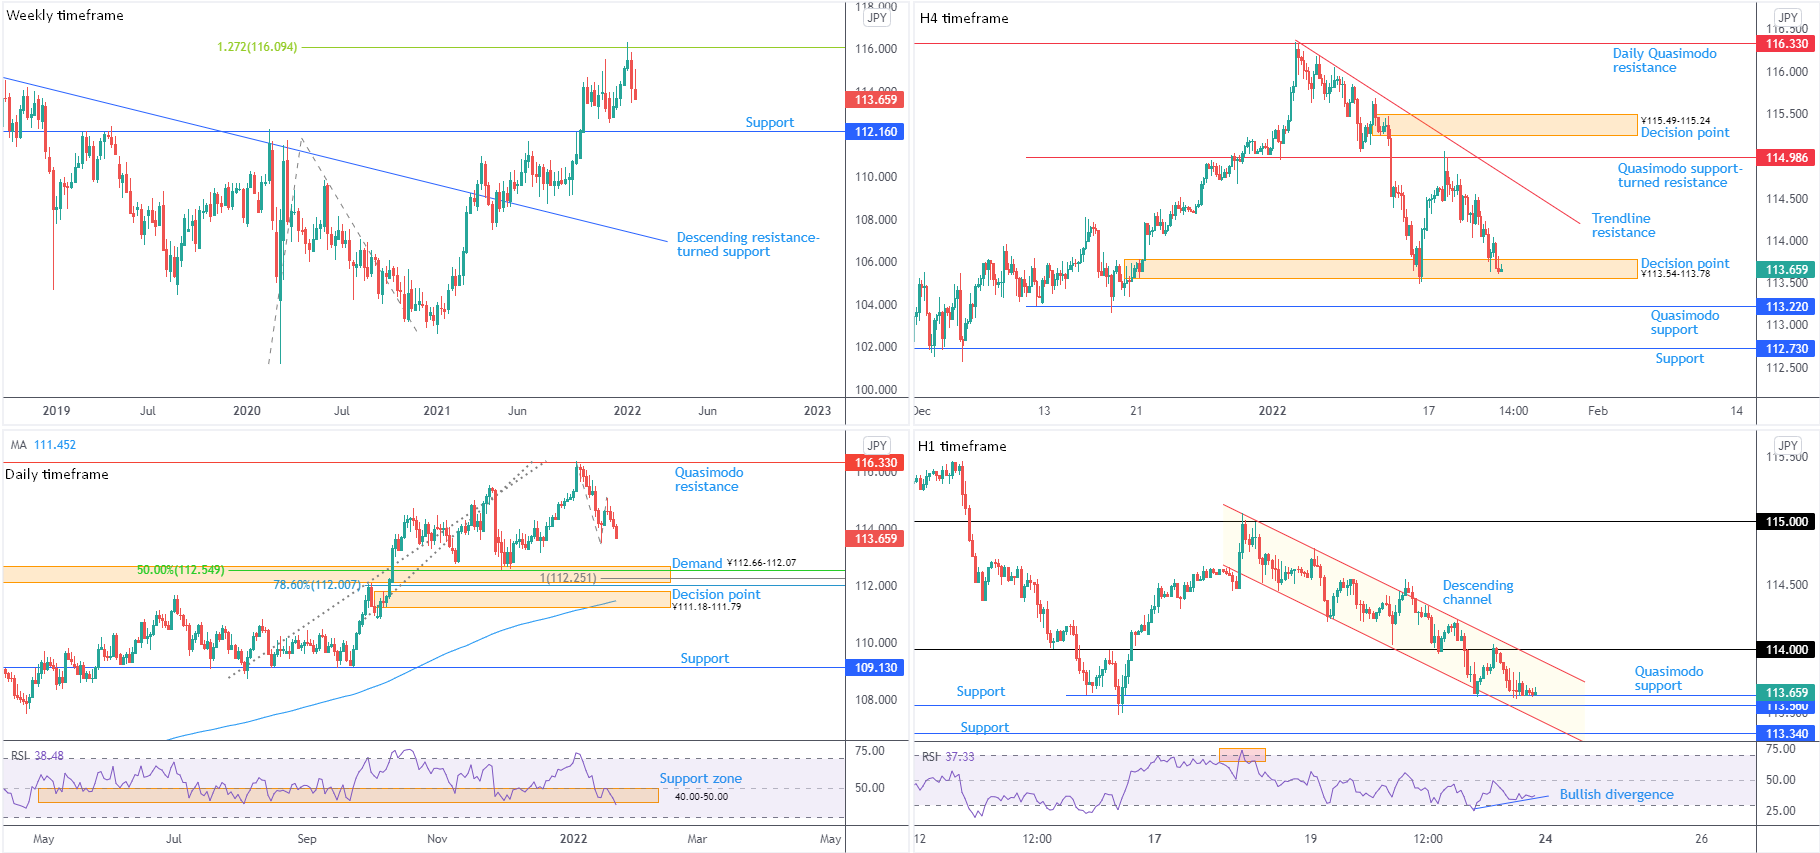
After touching gloves with a 1.272% Fibonacci projection from ¥116.09 in the shape of a shooting star and refreshing multi-year pinnacles, USD/JPY has pencilled in two back-to-back bearish closes. Support at ¥112.16, therefore, represents a downside goal this week.
In terms of trend, the unit has been advancing since the beginning of 2021, welcoming a descending resistance breach, drawn from the high ¥118.61. In consideration of the trend, a dip-buying theme from ¥112.16 remains a reasonable assumption.
Daily timeframe:
Since testing Quasimodo resistance at ¥116.33 at the beginning of 2022, price has been shaking out buyers and handing things to sellers. Downstream shines light on demand at ¥112.66-112.07, which happens to accommodate a 100% Fibonacci projection at ¥112.25 (harmonic traders will acknowledge this as an AB=CD pattern), a 78.6% Fibonacci retracement at ¥112.00 and a 50.0% retracement from ¥112.55.
South of the said structure, a decision point from ¥111.18-111.79 is in view, alongside a 200-day simple moving average at ¥111.45.
The trend on this timeframe, like the weekly timeframe, faces northbound. Against this background, though, the relative strength index (RSI) shows support between 40.00 and 50.00 (a ‘temporary’ oversold range since 10th May) ended the week under pressure.
H4 timeframe:
Quasimodo support-turned resistance at ¥114.99 performed on Tuesday, laying the foundation for a bearish phase in subsequent sessions. A familiar decision point at ¥113.54-113.78, set a few pips above Quasimodo support at ¥113.22, made an entrance on Friday, yet was unsuccessful in sparking curiosity from buyers. Clearance of ¥113.22, fuels the expectation of a run to support at ¥112.73, stationed just ahead of daily demand featured above at ¥112.66-112.07.
H1 timeframe:
¥114 accepted a retest as London opened its doors; price subsequently folded over and worked its way back to Quasimodo support at ¥113.64 at the close of trade Friday. Additional technical features nearby are supports from ¥113.56 and ¥113.34, together with a descending channel, attained from a high of ¥115.06 and low of ¥114.51.
From the relative strength index (RSI), early bullish divergence is forming in the neighbourhood of oversold. Journeying above the 50.00 centreline will help confirm bullish intent (positive momentum).
Observed Technical Levels:
Long term:
Longer-term charts deliver a bearish impression. Consequent to weekly price reacting to the 1.272% Fibonacci projection from ¥116.09 at the beginning of the year, and the daily timeframe observing ¥112.66-112.07 demand as a possible stopping place, sellers appear to have the advantage.
Short term:
The absence of buyers seen from the H4 decision point at ¥113.54-113.78 and H1 Quasimodo support at ¥113.64, this could have H1 absorb the latter and take on support from ¥113.56, targeting support at ¥113.34, followed by H4 Quasimodo support at ¥113.22.
GBP/USD:
Weekly timeframe:
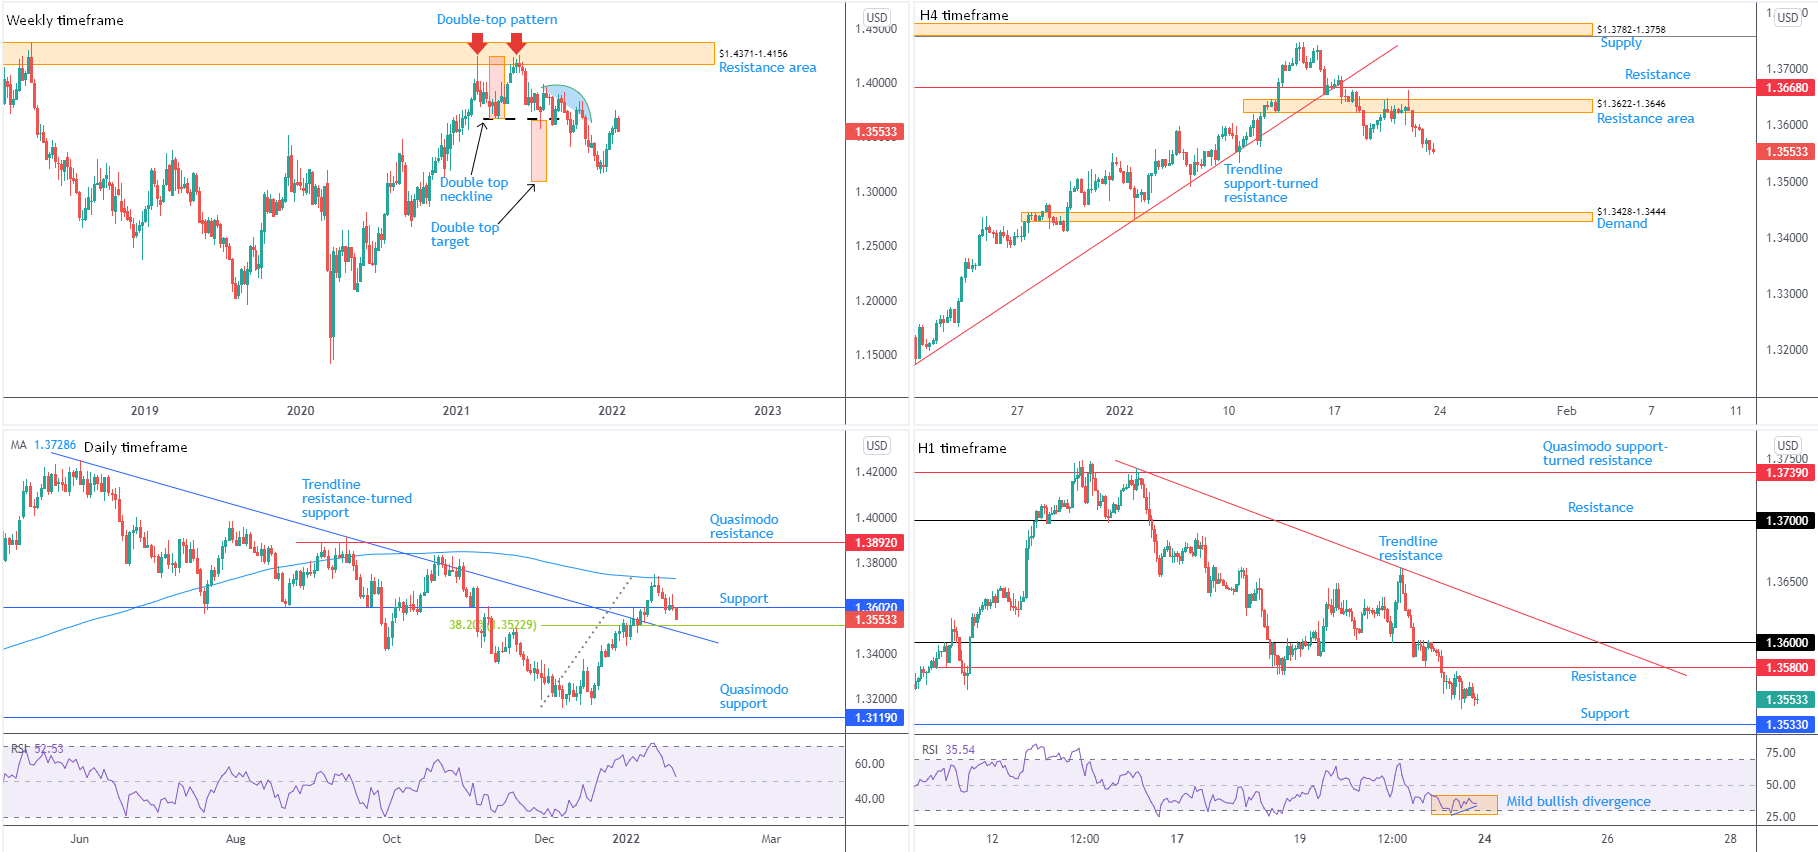
Snapping a 4-week bullish phase, GBP/USD recorded a 0.9 percent decline last week. This reopens the door to the double-top pattern’s ($1.4241) profit objective around $1.3093 (red boxes) in the coming weeks. Against this background, of course, is the possibility of continued upside. ‘Consumed supply’ (blue area) remains nearby between $1.4001 and $1.3830. Considering this, candle action may still be guided as far north as resistance from $1.4371-1.4156.
Trend studies show the weekly timeframe has been higher since early 2020. However, it’s important to recognise that while the trend on the weekly timeframe demonstrates an upside bias, the monthly timeframe’s long-term trend has been lower since late 2007.
Daily timeframe:
Eventually mustering enough strength to topple bids at support from $1.3602, Friday finished at session lows. Below $1.3602 clears space for a return to neighbouring trendline resistance-turned support this week, taken from the high $1.4250, accompanied by a 38.2% Fibonacci retracement at $1.3523.
Corresponding to a possible floor developing from said trendline support, the relative strength index (RSI) is bound for the 50.00 centreline. Support forming from this midline adds confluence to price structure.
H4 timeframe:
For those who read Friday’s technical report you might recall the following (italics):
A picture-perfect shooting star graced the H4 chart Thursday, spiking the upper boundary of a resistance area at $1.3622-1.3646 and missing resistance at $1.3668 by a whisker. If sellers take control, aside from a number of ‘local’ lows, demand is visible at $1.3428-1.3444.
As evident from the chart, sellers did indeed tunnel lower Friday. Despite the H4 timeframe exhibiting scope to approach $1.3428-1.3444, the daily timeframe’s trendline support must be confronted before.
H1 timeframe:
$1.36 serving up resistance at the tail end of the week witnessed price soak up bids from support at $1.3580 and come within a stone’s throw of another layer of support at $1.3533. As you can see, downside momentum levelled off heading into European hours on Friday, shown by way of bullish divergence out of the relative strength index (RSI). While this could lead to a price rise early week, dropping in on support at $1.3533 is not out of the question.
$1.3533 giving way, on the other hand, clears space to attack $1.33, according to current chart studies.
Observed Technical Levels:
Long term:
Clearance of the daily timeframe’s support at $1.3602 unlocks the technical door for a test of trendline resistance-turned support, taken from the high $1.4250, accompanied by a 38.2% Fibonacci retracement at $1.3523.
Short term:
Having noted the prospect of further underperformance this week, short-term players might zero in on $1.35 based on the H1 scale. The aforesaid psychological boundary aligns with the daily trendline support.
A retest of H1 resistance at $1.3580, therefore, is an option, a move sellers could be drawn to. H1 support from $1.3533 may offer buyers something to work with, but it’s unlikely to be anything to write home about as prime targets rest below: $1.35 and daily structure.
This material on this website is intended for illustrative purposes and general information only. It does not constitute financial advice nor does it take into account your investment objectives, financial situation or particular needs. Commission, interest, platform fees, dividends, variation margin and other fees and charges may apply to financial products or services available from FP Markets. The information in this website has been prepared without taking into account your personal objectives, financial situation or needs. You should consider the information in light of your objectives, financial situation and needs before making any decision about whether to acquire or dispose of any financial product. Contracts for Difference (CFDs) are derivatives and can be risky; losses can exceed your initial payment and you must be able to meet all margin calls as soon as they are made. When trading CFDs you do not own or have any rights to the CFDs underlying assets.
FP Markets recommends that you seek independent advice from an appropriately qualified person before deciding to invest in or dispose of a derivative. A Product Disclosure Statement for each of the financial products is available from FP Markets can be obtained either from this website or on request from our offices and should be considered before entering into transactions with us. First Prudential Markets Pty Ltd (ABN 16 112 600 281, AFS Licence No. 286354).
Recommended Content
Editors’ Picks
GBP/USD stays weak near 1.2400 after UK Retail Sales data

GBP/USD stays vulnerable near 1.2400 early Friday, sitting at five-month troughs. The UK Retail Sales data came in mixed and added to the weakness in the pair. Risk-aversion on the Middle East escalation keeps the pair on the back foot.
EUR/USD extends its downside below 1.0650 on hawkish Fed remarks

The EUR/USD extends its downside around 1.0640 after retreating from weekly peaks of 1.0690 on Friday. The hawkish comments from Federal Reserve officials provide some support to the US Dollar.
Gold: Middle East war fears spark fresh XAU/USD rally, will it sustain?

Gold price is trading close to $2,400 early Friday, reversing from a fresh five-day high reached at $2,418 earlier in the Asian session. Despite the pullback, Gold price remains on track to book the fifth weekly gain in a row.
Bitcoin Price Outlook: All eyes on BTC as CNN calls halving the ‘World Cup for Bitcoin’

Bitcoin price remains the focus of traders and investors ahead of the halving, which is an important event expected to kick off the next bull market. Amid conflicting forecasts from analysts, an international media site has lauded the halving and what it means for the industry.
Israel vs. Iran: Fear of escalation grips risk markets

Recent reports of an Israeli aerial bombardment targeting a key nuclear facility in central Isfahan have sparked a significant shift out of risk assets and into safe-haven investments.