The Dollar-Yen pair fell to a one-month low below 112.00 today as expected. The tax reform uncertainty, Mueller subpoena, and weak long-term inflation expectations saw the yield curve turn flattest in a decade.
The spread between the US 10-year treasury yield and the 2-year treasury yield referred to as a curve, fell to 62.33 basis points; its lowest level since Oct. 2007.
Treasury yield curve
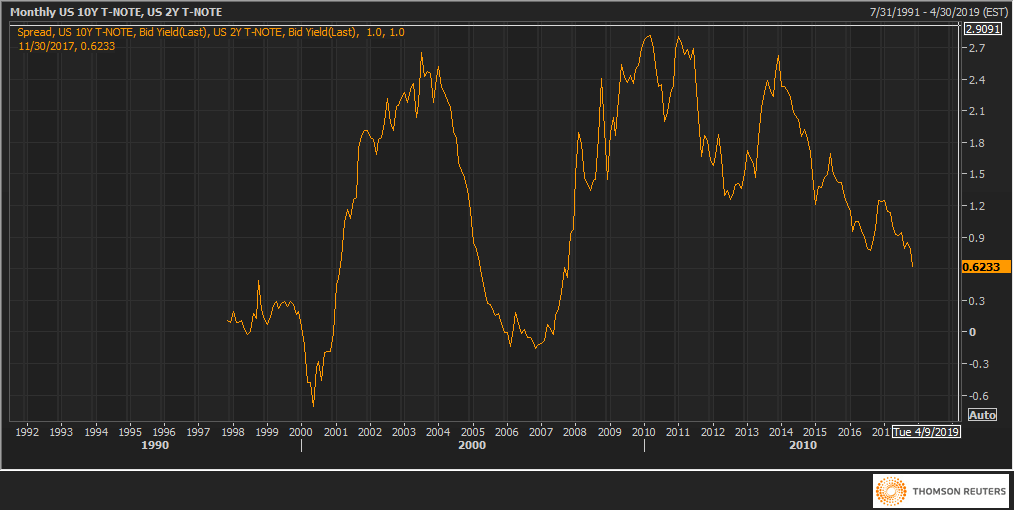
- The flattening of the Treasury yield curve is bad news for the US dollar.
- The curve may continue to flatten next week unless the Fed minutes (due on Wednesday) sound more hawkish than expected. Also scheduled for release on Wednesday is the durable goods orders report.
- A big breakthrough on the tax reform front could lead to yield curve steepening and USD recovery, although technical studies indicate there is little scope for bulls to make a comeback.
Weekly chart
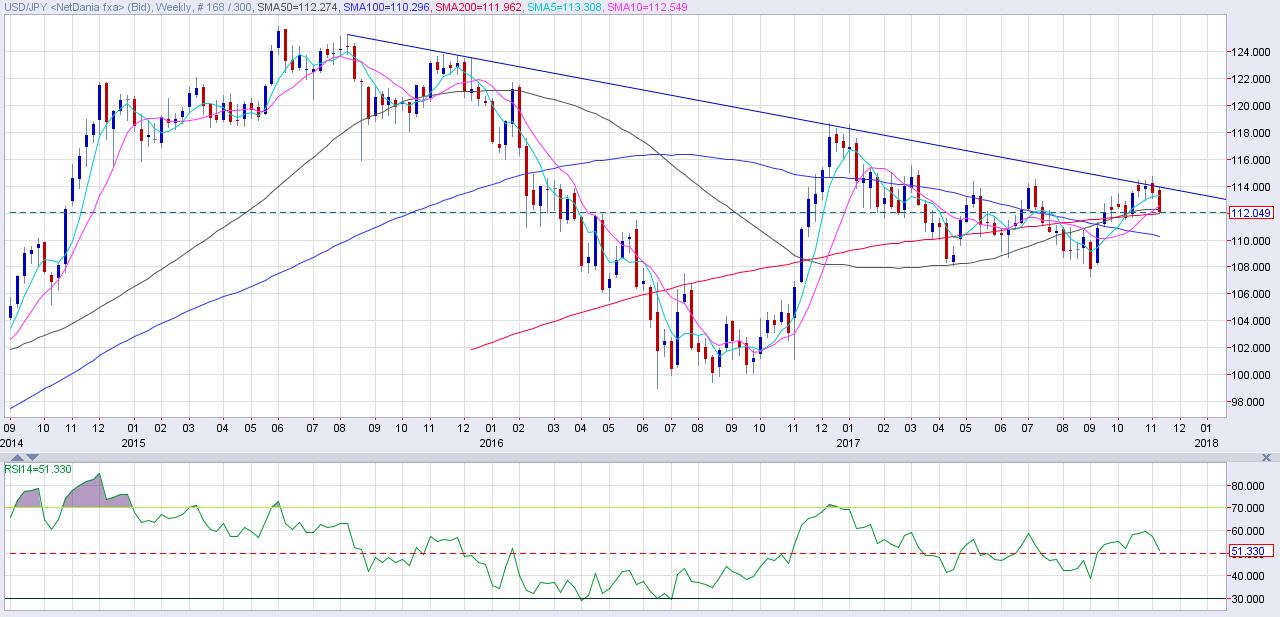
Source: Netdania
The above chart shows-
- Trend-line failure - The trendline sloping downwards from Aug. 2015 high and Dec. 2015 high remains intact. Having failed to cut through the trendline hurdle for three consecutive weeks, the USD/JPY pair finally succumbed to the bearish pressure this week and fell to a one-month low of 111.94.
- The RSI has turned lower as well and is expected to dip below 50.00 (bearish territory) in the coming week.
- The pair looks set to test the descending weekly 50-MA located at 110.30.
Daily chart
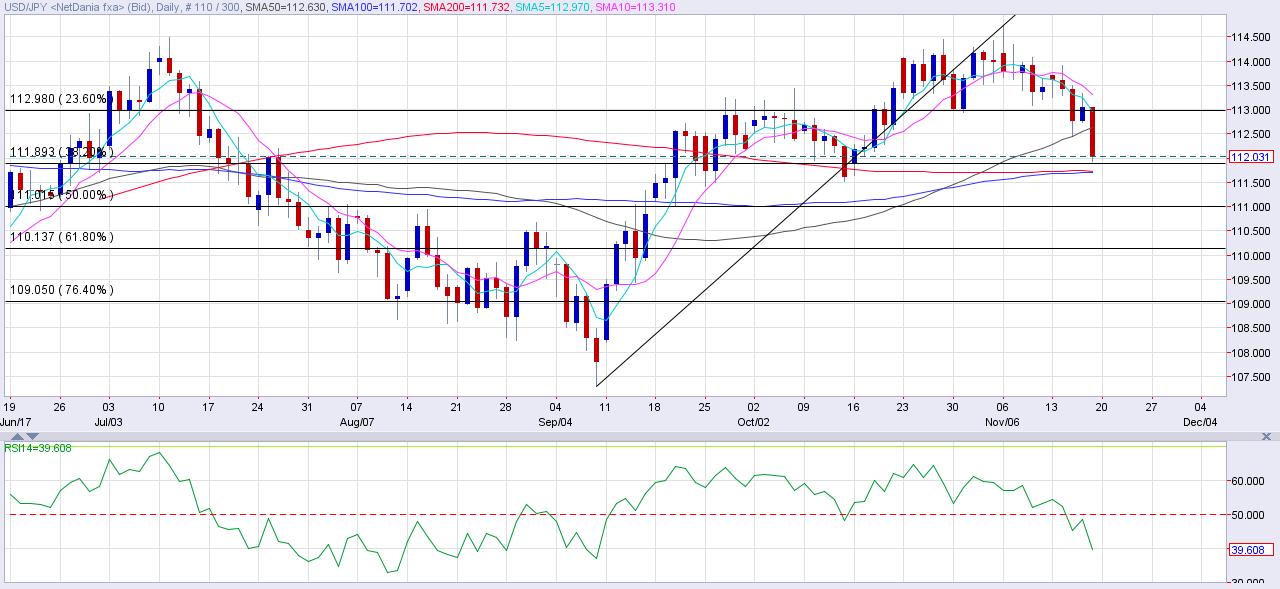
Source: Netdania
The above chart shows-
- A nice rounding top/double top breakdown and a drop to 38.2% Fib retracement level.
- A double top breakdown on the RSI.
- The spot looks set to take out the support at 111.70 (100-day MA + 200-day MA).
- The 5-day MA and 10-day MA carry a strong bearish bias.
- The only factor that favors the bulls is the ascending 50-day MA.
View
- The pair looks set to test 110.50-100.00 levels over the next week or two.
- Only two consecutive day-end closes above the upward sloping 50-day MA would abort the bearish view and may yield a rally to the recent high of 114.73-115.00 levels.
Information on these pages contains forward-looking statements that involve risks and uncertainties. Markets and instruments profiled on this page are for informational purposes only and should not in any way come across as a recommendation to buy or sell in these assets. You should do your own thorough research before making any investment decisions. FXStreet does not in any way guarantee that this information is free from mistakes, errors, or material misstatements. It also does not guarantee that this information is of a timely nature. Investing in Open Markets involves a great deal of risk, including the loss of all or a portion of your investment, as well as emotional distress. All risks, losses and costs associated with investing, including total loss of principal, are your responsibility. The views and opinions expressed in this article are those of the authors and do not necessarily reflect the official policy or position of FXStreet nor its advertisers. The author will not be held responsible for information that is found at the end of links posted on this page.
If not otherwise explicitly mentioned in the body of the article, at the time of writing, the author has no position in any stock mentioned in this article and no business relationship with any company mentioned. The author has not received compensation for writing this article, other than from FXStreet.
FXStreet and the author do not provide personalized recommendations. The author makes no representations as to the accuracy, completeness, or suitability of this information. FXStreet and the author will not be liable for any errors, omissions or any losses, injuries or damages arising from this information and its display or use. Errors and omissions excepted.
The author and FXStreet are not registered investment advisors and nothing in this article is intended to be investment advice.
Recommended Content
Editors’ Picks
EUR/USD retreats toward 1.0650 after PMI-inspired rebound

EUR/USD loses traction and retreats to the 1.0650 area after rising toward 1.0700 with the immediate reaction to the upbeat PMI reports from the Eurozone and Germany. The cautious market stance helps the USD hold its ground ahead of US PMI data.
GBP/USD fluctuates near 1.2350 after UK PMIs

GBP/USD clings to small daily gains near 1.2350 in the European session on Tuesday. The data from the UK showed that the private sector continued to grow at an accelerating pace in April, helping Pound Sterling stay resilient against its rivals.
Gold flirts with $2,300 amid receding safe-haven demand

Gold (XAU/USD) remains under heavy selling pressure for the second straight day on Tuesday and languishes near its lowest level in over two weeks, around the $2,300 mark in the European session. Eyes on US PMI data.
Here’s why Ondo price hit new ATH amid bearish market outlook Premium

Ondo price shows no signs of slowing down after setting up an all-time high (ATH) at $1.05 on March 31. This development is likely to be followed by a correction and ATH but not necessarily in that order.
US S&P Global PMIs Preview: Economic expansion set to keep momentum in April

S&P Global Manufacturing PMI and Services PMI are both expected to come in at 52 in April’s flash estimate, highlighting an ongoing expansion in the private sector’s economic activity.