USD/JPY has been bullish on the daily chart for the last two trading days. The price upon finding its support produced a bullish engulfing candle followed by another Marubozu bullish candle. Today’s intraday charts’ price action has been bullish as well. The last swing low still has some space for the price for traveling. Thus, the pair may remain positive for a day or two. Let us have a look at these three charts.
Chart 1 USD/JPY Daily Chart
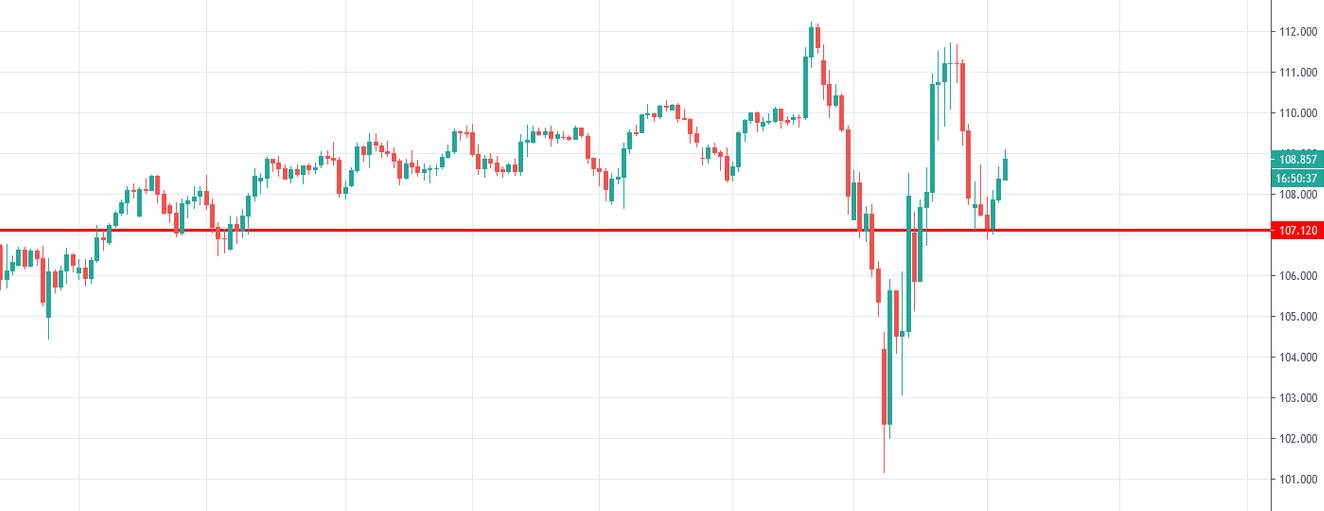
Chart 1 shows that the price has found support at the level of 107.120 and produced a bullish engulfing candle. The price created another bullish candle on Friday. The price breached Friday’s candle. Thus, intraday traders may look for opportunities on the long side in the pair. The daily chart buyers are to wait for the price to consolidate and produce a bullish reversal candle to go long. The pair may find its next resistance around the level of 111.700.
Chart 2 USD/JPY H4 Chart
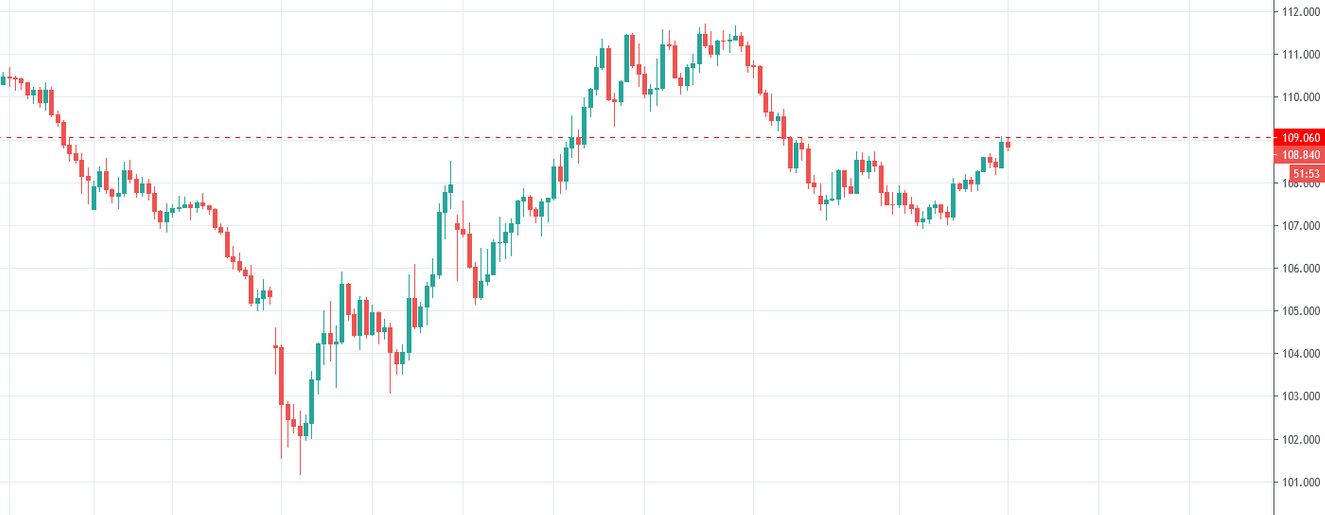
Chart 2 shows that the price produced a double bottom and headed towards the North. It consolidated and created a bullish engulfing candle. However, shallow consolidation does not provide bullish momentum. The buyers may wait for the price to make deep consolidation and a strong bullish reversal candle to go long in the pair. USD/JPY pair may find its next resistance around the level of 109.900.
Chart 3 USD/JPY H1 Chart

The chart shows that the pair has been heading towards the North with good bullish momentum. It made corrections twice and made new higher highs. It made a bullish breakout at the level of 108.630. As of writing, the price has been in consolidation. If it comes back at the breakout level and produces a bullish engulfing candle, the buyers may go long in the pair and drive the price towards the North further. The H1 chart shows that USD/JPY's price has enough space to travel towards the upside. Thus, the buyers may consider taking a partial profit and holding the rest of it. The pair may find its next resistance around the level of 109.500.
The Daily and the H4 chart look bullish, but the traders are to wait to go long in the pair. The H1 chart seems to be getting ready to offer long entries. The bullishness in the daily and the H4 chart and the breakout on the H1 chart may make the pair produce another bullish candle on the daily chart today.
Risk Warning: CFD and Spot Forex trading both come with a high degree of risk. You must be prepared to sustain a total loss of any funds deposited with us, as well as any additional losses, charges, or other costs we incur in recovering any payment from you. Given the possibility of losing more than your entire investment, speculation in certain investments should only be conducted with risk capital funds that if lost will not significantly affect your personal or institution’s financial well-being. Before deciding to trade the products offered by us, you should carefully consider your objectives, financial situation, needs and level of experience. You should also be aware of all the risks associated with trading on margin.
Recommended Content
Editors’ Picks
EUR/USD regains traction, recovers above 1.0700

EUR/USD regained its traction and turned positive on the day above 1.0700 in the American session. The US Dollar struggles to preserve its strength after the data from the US showed that the economy grew at a softer pace than expected in Q1.
GBP/USD returns to 1.2500 area in volatile session

GBP/USD reversed its direction and recovered to 1.2500 after falling to the 1.2450 area earlier in the day. Although markets remain risk-averse, the US Dollar struggles to find demand following the disappointing GDP data.
Gold climbs above $2,340 following earlier drop

Gold fell below $2,320 in the early American session as US yields shot higher after the data showed a significant increase in the US GDP price deflator in Q1. With safe-haven flows dominating the markets, however, XAU/USD reversed its direction and rose above $2,340.
XRP extends its decline, crypto experts comment on Ripple stablecoin and benefits for XRP Ledger

Ripple extends decline to $0.52 on Thursday, wipes out weekly gains. Crypto expert asks Ripple CTO how the stablecoin will benefit the XRP Ledger and native token XRP.
After the US close, it’s the Tokyo CPI

After the US close, it’s the Tokyo CPI, a reliable indicator of the national number and then the BoJ policy announcement. Tokyo CPI ex food and energy in Japan was a rise to 2.90% in March from 2.50%.