Over the past several weeks, the struggling US dollar had one of its biggest tumbles against the Swiss Franc, whose status as a safe currency solidified the constant demand for it during these volatile times. The USD/CHF fell by more than six per cent since the beginning of June alone, which manifests the robust selling pressure that continues to drive the pair lower.
Over the past couple of trading days, however, the USD/CHF established its first bullish correction since mid-July, which gave the market bulls a minor respite. Nevertheless, the underlying bullish commitment does not appear to be nearly enough to prompt a trend reversal, which means that the bears are left with an excellent opportunity to enter the market at the swing high and wait for the continuation of the broader bearish trend's development.
That is why the purpose of today's analysis is to examine the structure of this recent correction, and to outline the likely future development of the price action, as the market gets ready to resume heading lower.
Long-Term Outlook:
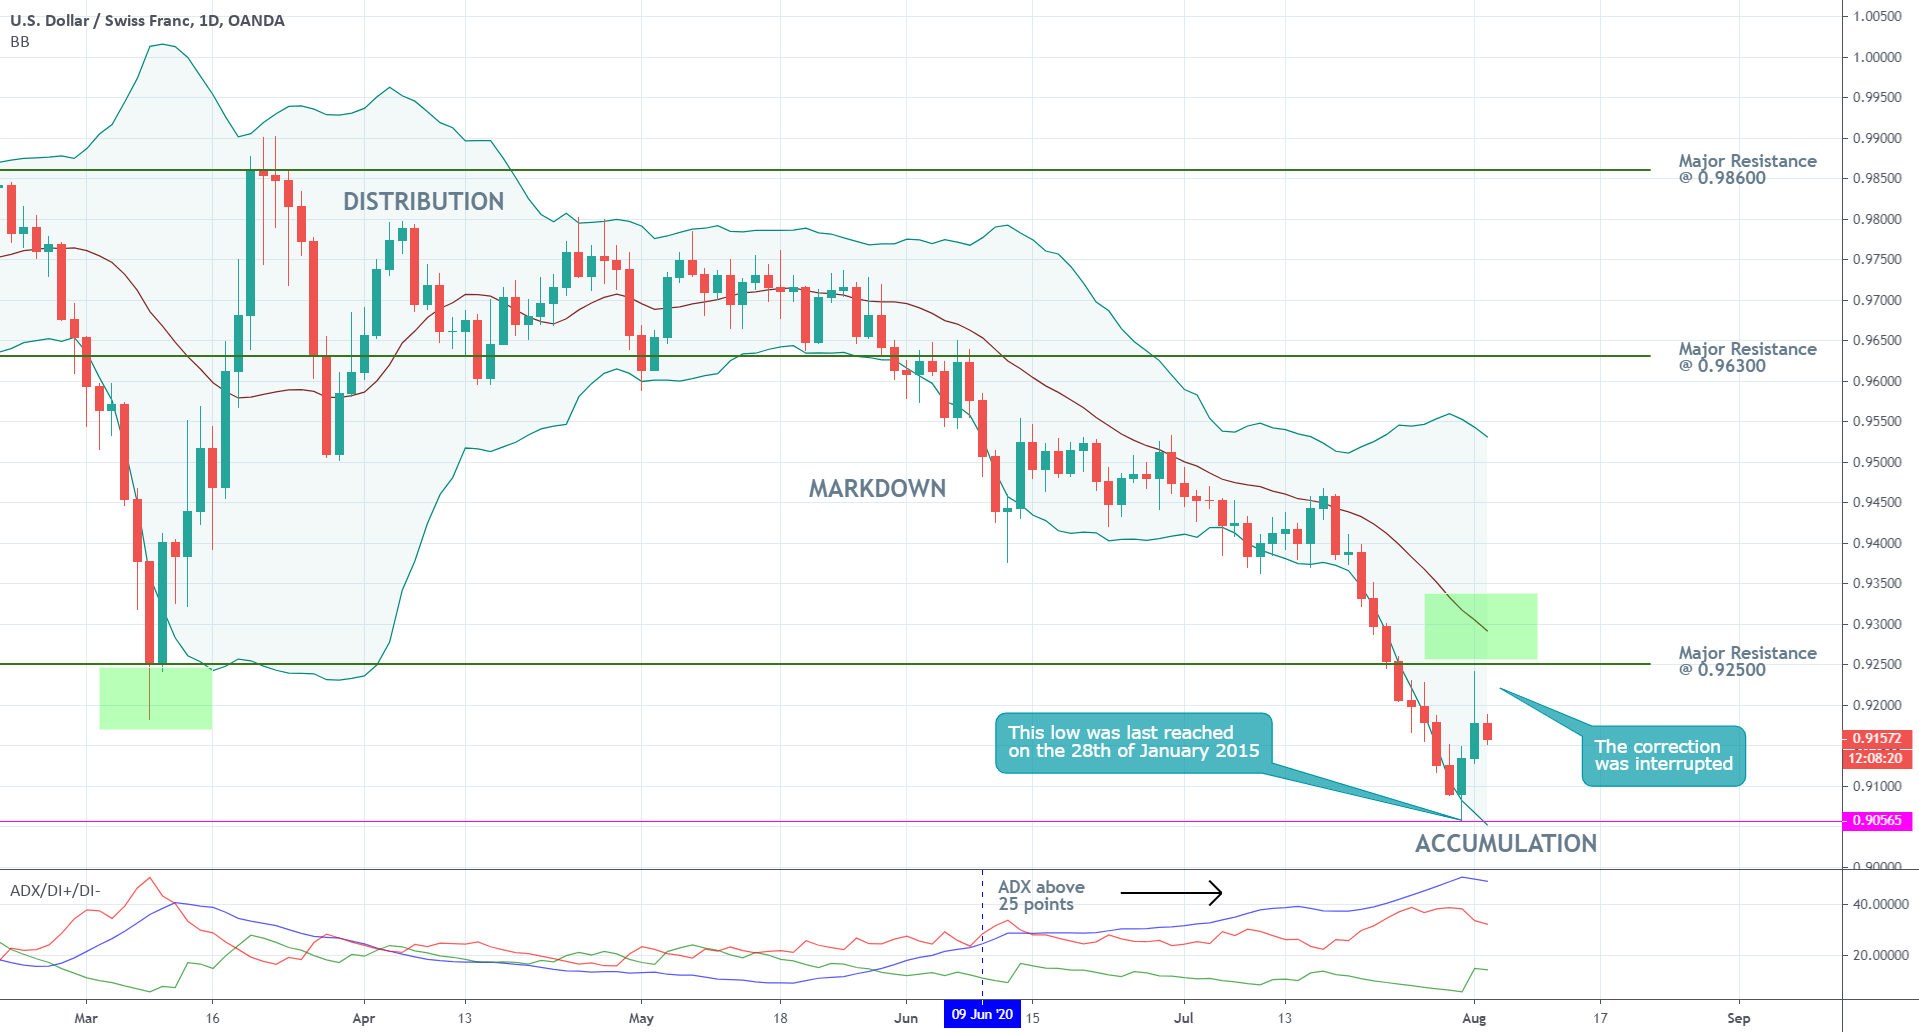
As can be seen on the daily chart below, the aforementioned bullish correction was initiated after the price action had sunken to the 0.90565 price level, which was last reached on the 28th of January 2015. Due to the fact that this support hasn't been broken in over five years is what gives the level its psychological importance, and is the reason as to why the bearish trend was at least temporarily suspended.
The emergence of this correction has made it possible for a new Accumulation range to be established between the 0.90565 support and the major resistance level at 0.92500. This expectation is substantiated by the fact that the bullish correction reached a swing high just below the latter level.
As per the characteristics of a classic Wyckoff cycle, the development of an Accumulation range towards the lower end of a preceding Markdown typically entails the future creation of a new Markup. In other words, the recent behaviour of the USD/CHF's price action could be perceived as an early indication signalling a potential trend reversal in the long run, yet the situation looks completely different in the short run, as it is about to be seen.
Yesterday's price action resulted in the creation of a candle with a huge upper shadow, which highlights mounting uncertainty, and unpreparedness of the market to continue surging further north at the present rate. Moreover, the wide Bollinger Bands underscore high levels of volatility that is complementing the behaviour of the price action at present, which diminishes the likelihood for a snap reversal. Accordingly, a likely consolidation around the current market price or a new downturn towards the previous low both seem more probable.
The ADX indicator is currently threading well-above the 25-point benchmark, which confirms the robustness of the bearish trending environment. Under these conditions, the continuation of the Markdown's further development seems like the most likely outcome.
Short-Term Outlook:
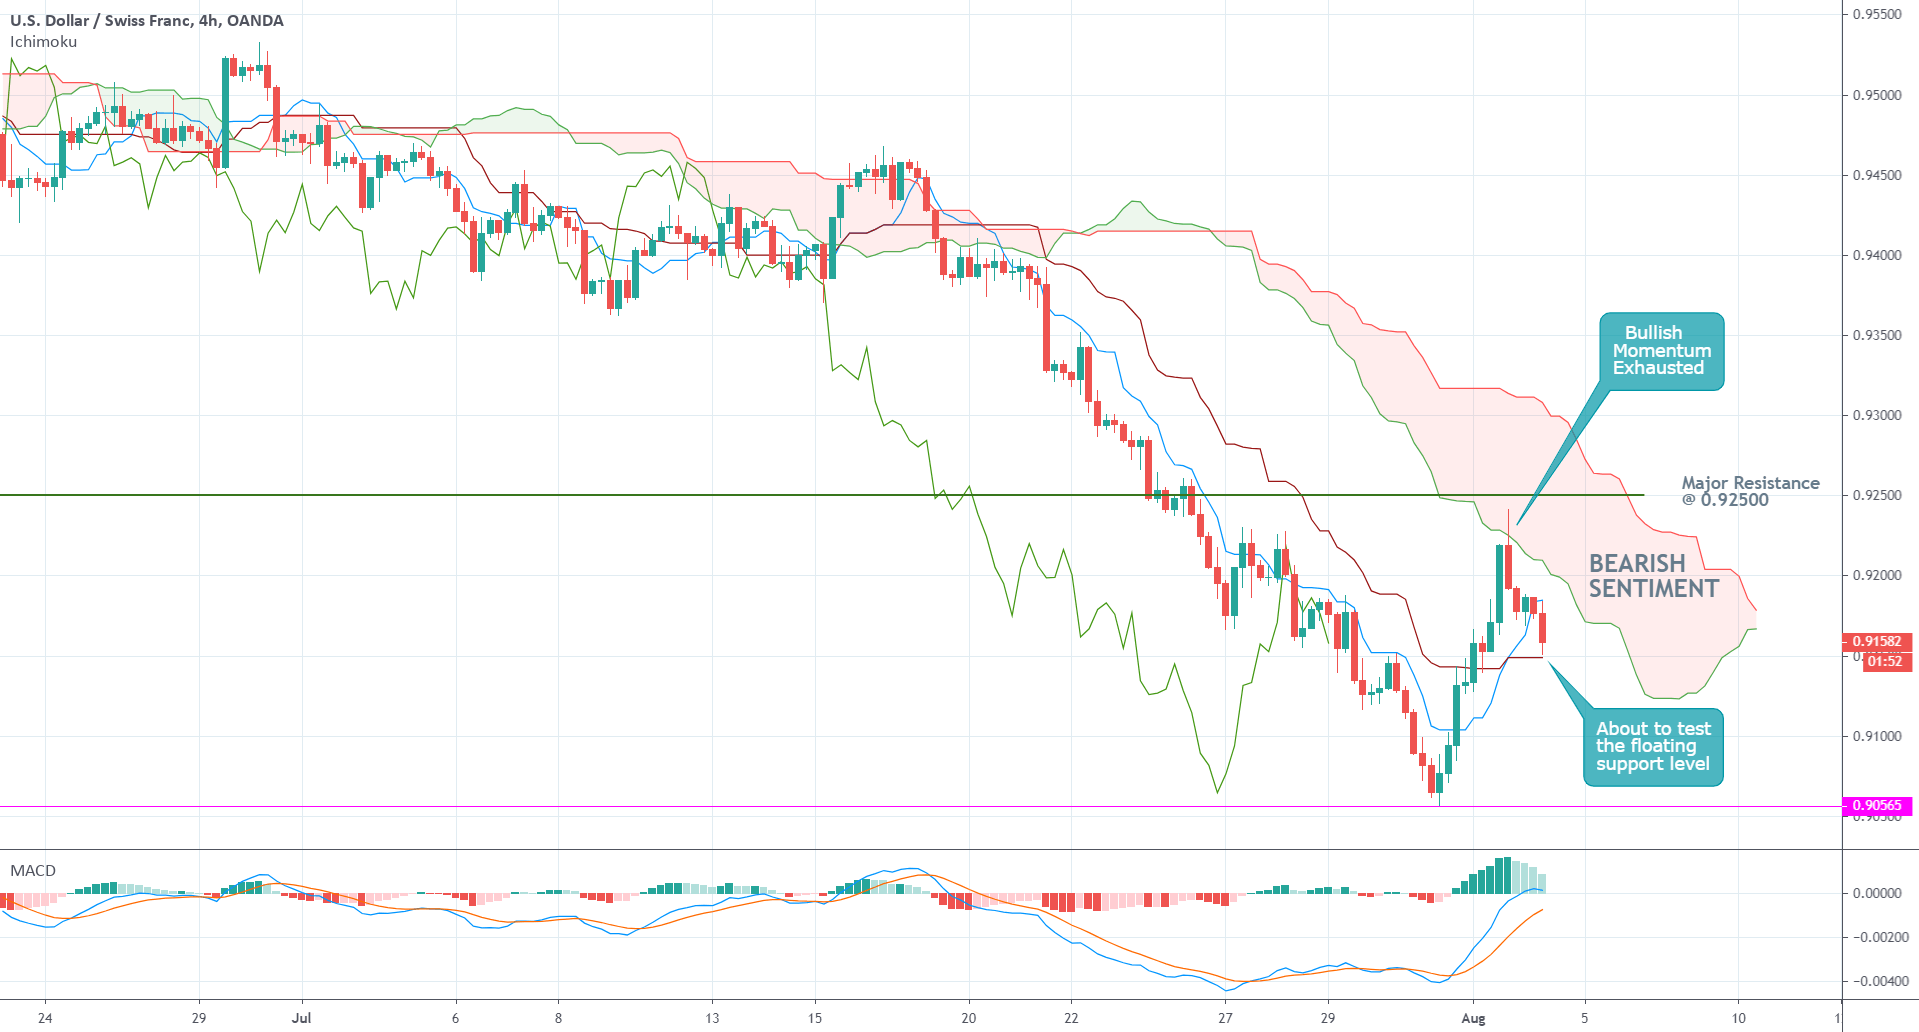
The 4H chart below demonstrates the continued prevalence of the underlying bearish sentiment in the short run. As can be seen, the Ichimoku Cloud indicator is confirming the existence of this bearish sentiment, as the cloud itself remains ostensibly bearish. The bullish correction managed to edge high enough to reach the cloud momentarily but was subsequently terminated. The rebound from the cloud indicates exhaustion of the underlying bullish commitment in the market.
As can be further observed, after the price action reversed its course from the new peak at the end of the bullish correction, it resumed falling and is currently attempting to break down below the slow-moving MA in red. If it manages to do so, this will represent a significant indication that the latest resurgence of bullish commitment is indeed exhausted, and that the price action is ready to continue making sizable downturns.
Nevertheless, the MACD indicator, which demonstrates the immediate direction of the underlying momentum, is still underlining remaining bullish strength. Hence, bears should not rush to sell just whatever, and should instead wait for the complete exhaustion of this bullish momentum – at least when the histogram turns red yet again.
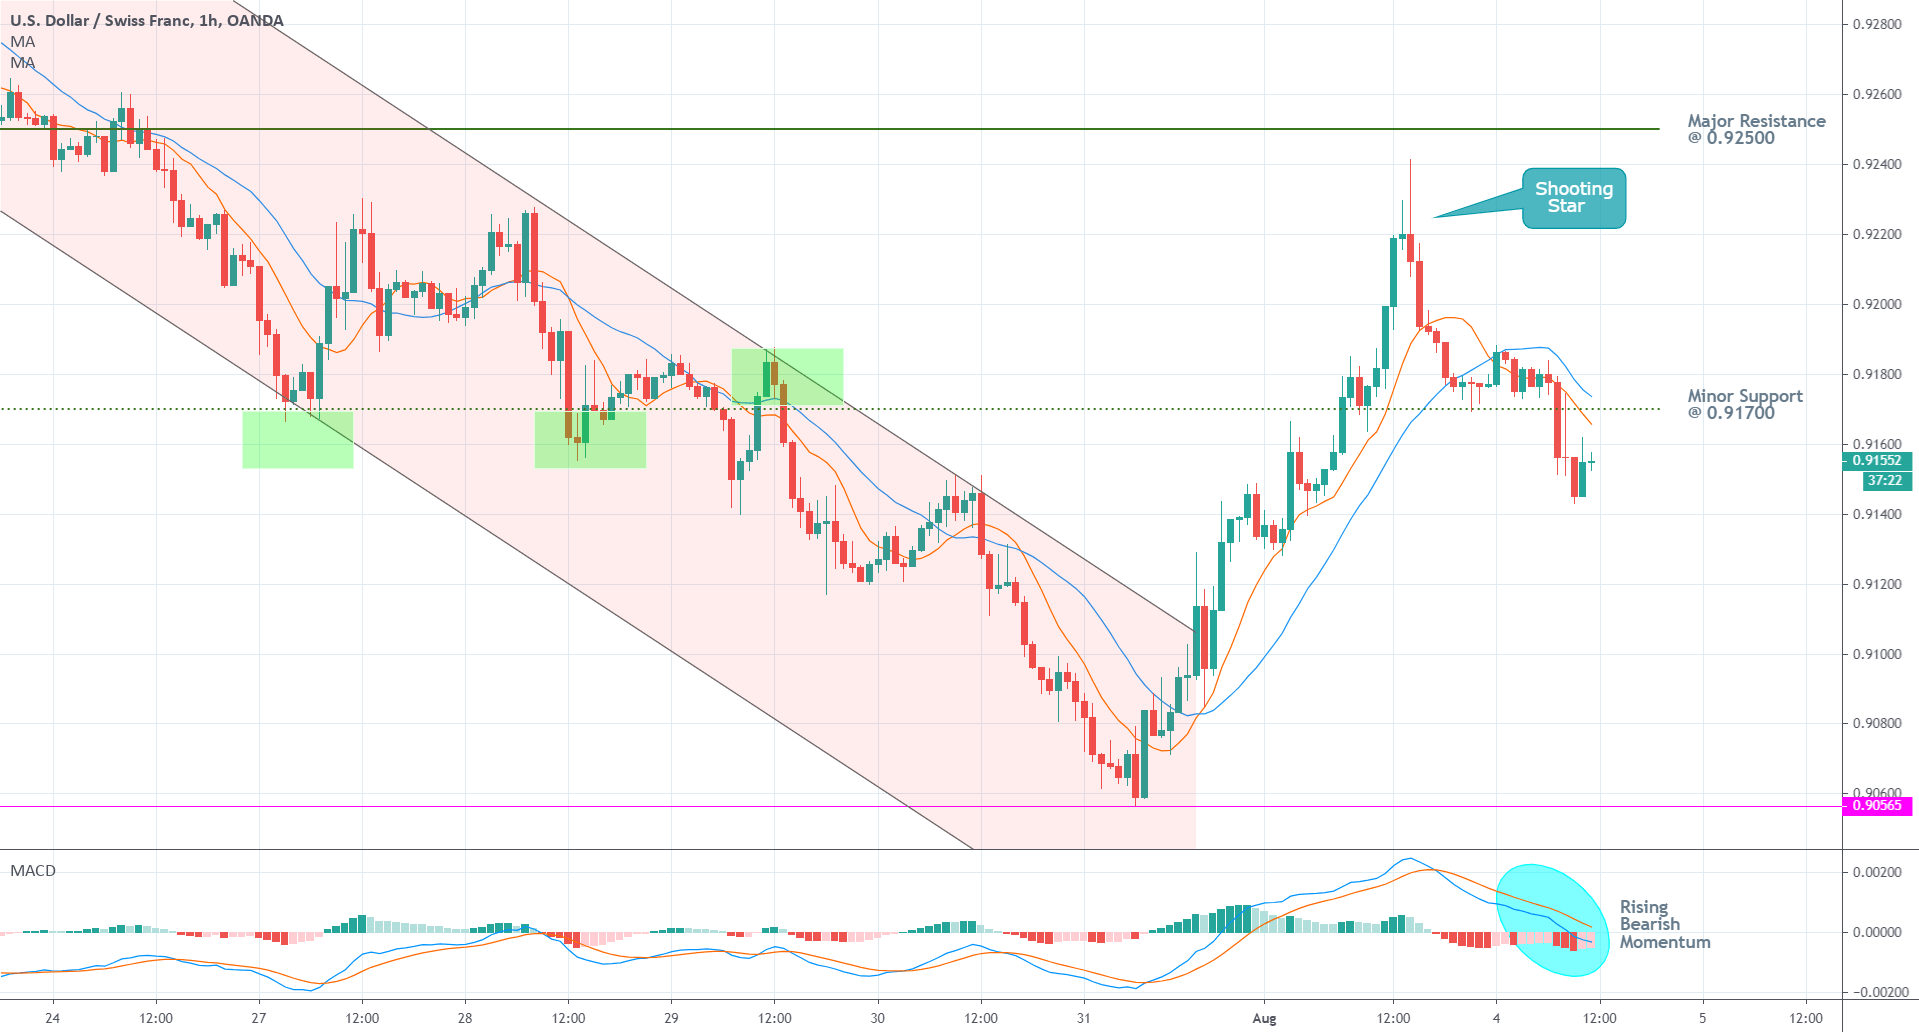
Further confirmation regarding the termination of the bullish correction can be found on the hourly chart below. As can be seen, the price action established a 'Shooting Star' candle right before it changed its direction, which is a typical behaviour commonly found before the underlying price action resumes trading lower.
Moreover, the price action is trading below the 10-day MA (in red), which, in turn, is positioned below the 20-day MA (in blue). This descending order is demonstrative of rapidly rising bearish pressure. Another confirmation of this is the fact that the price action recently managed to break down below the minor support level at 0.91700, whose significance has already been demonstrated on three separate occasions (as indicated by the green rectangles).
Finally, the MACD indicator on the hourly chart is confirming the steadily increasing bearish momentum in the very short-term, which is favourable for the continuation of the downswing's further development.
Concluding Remarks:
Overall, the USD/CHF looks ready to test the strength of the historic support level at 0.90565 at least one more time, judging by the mounting bearish outlook in the short run.
However, market bears should be mindful as the Bureau of Labour Statistics in the US is scheduled to release the crucial Non-Farm Payrolls for July this Friday. Apart from the expected rise in volatility following the publication of the labour data, a potentially better-than-expected employment numbers could strengthen the reeling greenback, which, in turn, could shift the aforementioned power dynamics that are currently affecting the price action of the USD/CHF.
On the condition that the labour force report demonstrates a sizable decrease in the US unemployment rate, the USD/CHF could revert its direction yet again, and attempt to break out above the Accumulation range's upper boundary.
Trading and investing on the financial markets carries a significant risk of loss. Each material, shown on this website, is provided for educational purposes only. A perfect, 100% accurate method of analysis does not exist. If you make a decision to trade or invest, based on the information from this website, you will be doing it at your own risk. Under no circumstances is Trendsharks responsible for any capital losses or damages you might suffer, while using the company’s products and services. For more information read our Terms & Conditions and Risk Disclaimer.
Recommended Content
Editors’ Picks
EUR/USD hovers around 1.0700 after German IFO data

EUR/USD stays in a consolidation phase at around 1.0700 in the European session on Wednesday. Upbeat IFO sentiment data from Germany helps the Euro hold its ground as market focus shifts to US Durable Goods Orders data.
USD/JPY refreshes 34-year high, attacks 155.00 as intervention risks loom

USD/JPY is renewing a multi-decade high, closing in on 155.00. Traders turn cautious on heightened risks of Japan's FX intervention. Broad US Dollar rebound aids the upside in the major. US Durable Goods data are next on tap.
Gold price trades with mild negative bias, manages to hold above $2,300 ahead of US data

Gold price (XAU/USD) edges lower during the early European session on Wednesday, albeit manages to hold its neck above the $2,300 mark and over a two-week low touched the previous day.
Worldcoin looks set for comeback despite Nvidia’s 22% crash Premium

Worldcoin price is in a better position than last week's and shows signs of a potential comeback. This development occurs amid the sharp decline in the valuation of the popular GPU manufacturer Nvidia.
Three fundamentals for the week: US GDP, BoJ and the Fed's favorite inflation gauge stand out Premium

While it is hard to predict when geopolitical news erupts, the level of tension is lower – allowing for key data to have its say. This week's US figures are set to shape the Federal Reserve's decision next week – and the Bank of Japan may struggle to halt the Yen's deterioration.