U.S. stocks posted modest losses, as uncertainties concerning the U.S.-China "Phase One" trade deal emerged. The Dow Jones Industrial Average eased 29 (-0.1%) to 26787, the S&P 500 slipped 4 points (-0.1%) to 2966, and the Nasdaq Composite was down 8 points (-0.1%) to 8048.
The U.S. Empire Manufacturing Index rose to 4.0 in October (1.0 expected) from 2.0 in September.
In his tweets, U.S. President Donald Trump said: "I agreed not to increase Tariffs from 25% to 30% on October 15th...My deal with China is that they will IMMEDIATELY start buying huge quantities of our Agricultural Product, not wait until the deal is signed over the next 3 or 4 weeks. THEY HAVE ALREADY STARTED!" However, news reports revealed that China is now asking for more talks within October to set details of the deal.
European stocks end in the red, with the Stoxx Europe 600 Index losing 0.5%. Germany's DAX dropped 0.2%, France's CAC fell 0.4%, and the U.K.'s FTSE 100 was down 0.5% The U.S. bond market was closed for Columbus Day. Spot gold rebounded 0.3% to $1,493 an ounce.
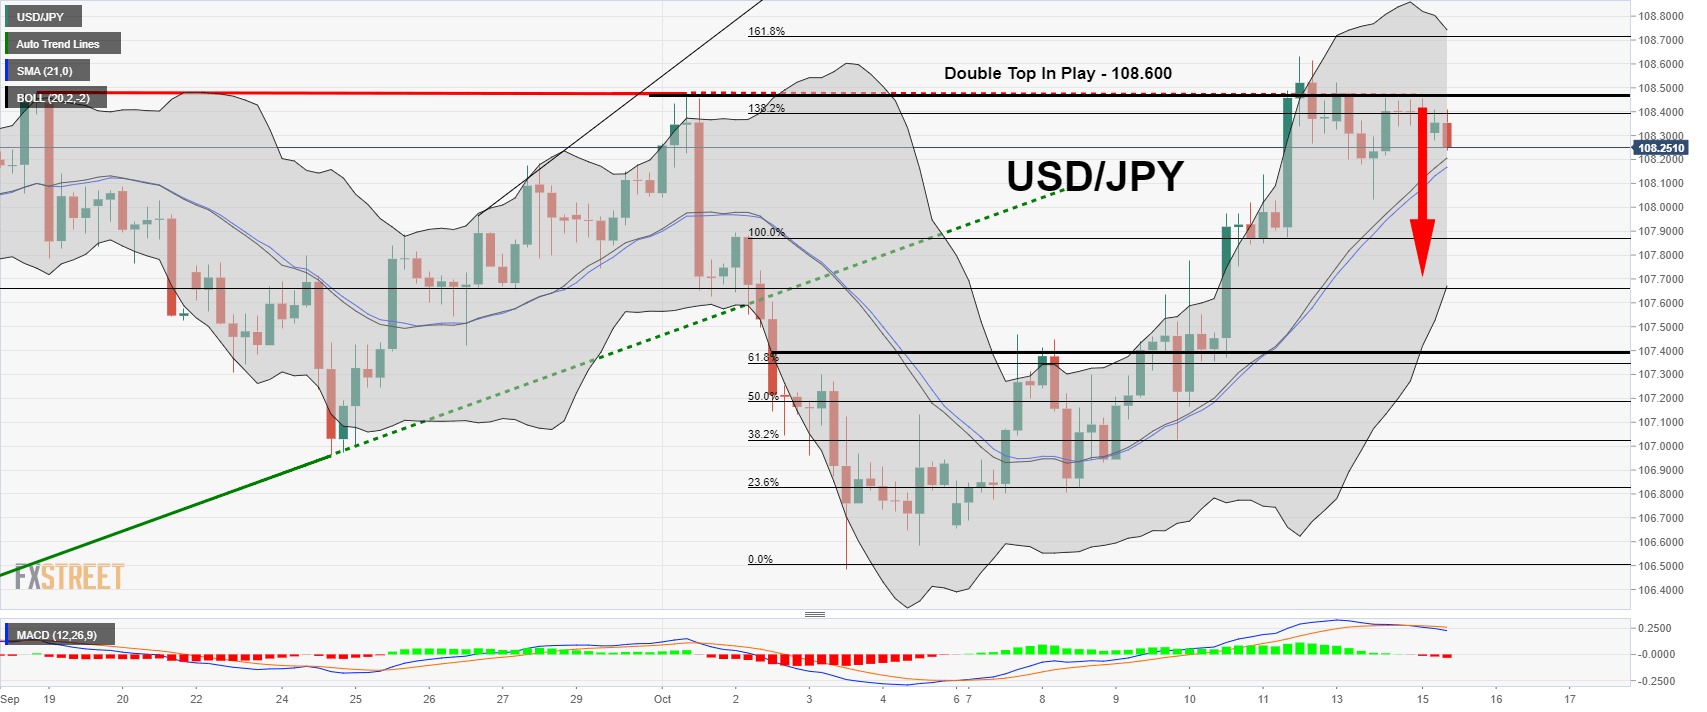
USD/JPY - Double Top Pattern Keep USD/JPY Bearish
The USD/JPY was opened at 108.339 and has placed a high of 108.521 and a low of 108.028 until now. The pair is currently trading at 108.365 and has shown a Bullish trend for this day.
At the end of last week, when risk appetite increased in the market and demand for safe-haven assets dropped, the pair USD/JPY showed an upward trend. But after the news from Bloomberg about China wanting another round of trade talks by the end of October, the risk appetite decreased somehow and gave a drop in USD/JPY prices.
This drop gave hints that investors do not have confidence in the initial agreement proposed by Trump.
Trump announced a partial deal agreement between US & China related to an end of the prevailing trade war on Friday. This news gave a sudden jump in the prices of USD/JPY on the ending day of the week. But the Chinese Government wants to have more talks before signing the document and has given a sentiment of uncertainty which created demand for safe-haven assets and weighed on USD/JPY prices on Monday.
US Treasury Yields also dropped on Monday, and increased in Gold Prices helped USD/JPY to drop further. However, the prices did not show a sharp decline due to no reply from Trump as of yet. Lack of macroeconomic release from Japan and the United States due to Bank Holiday also gave muted movement to this pair on Monday.
This week the most important US economic indicator to be published on Wednesday is Retail Sales. Investors will keep a close eye on its release, which is expected to show a rise in September to 0.3%.
The US Dollar has also suffered from weak inflation figures from last week, which gave hopes that Federal reserve will cut US interest rates for 3rd time this year at the end of October.
USD/JPY - Daily Technical Levels
Support Resistance
108 108.75
107.57 109.07
106.81 109.82
Pivot Point 108.32
USD/JPY - Daily Trade Sentiment
On Tuesday, the USD/JPY hasn't changed that much as investors seem to look for a solid reason to enter the market. On the 4 hour chart, the USD/JPY is facing strong double top resistance at 108.600 level. The pair has closed a series of neutral candles below this level, which are signifying the chances of a bearish reversal. On the lower side, support continues to stay around 108.00 and 107.800 today.
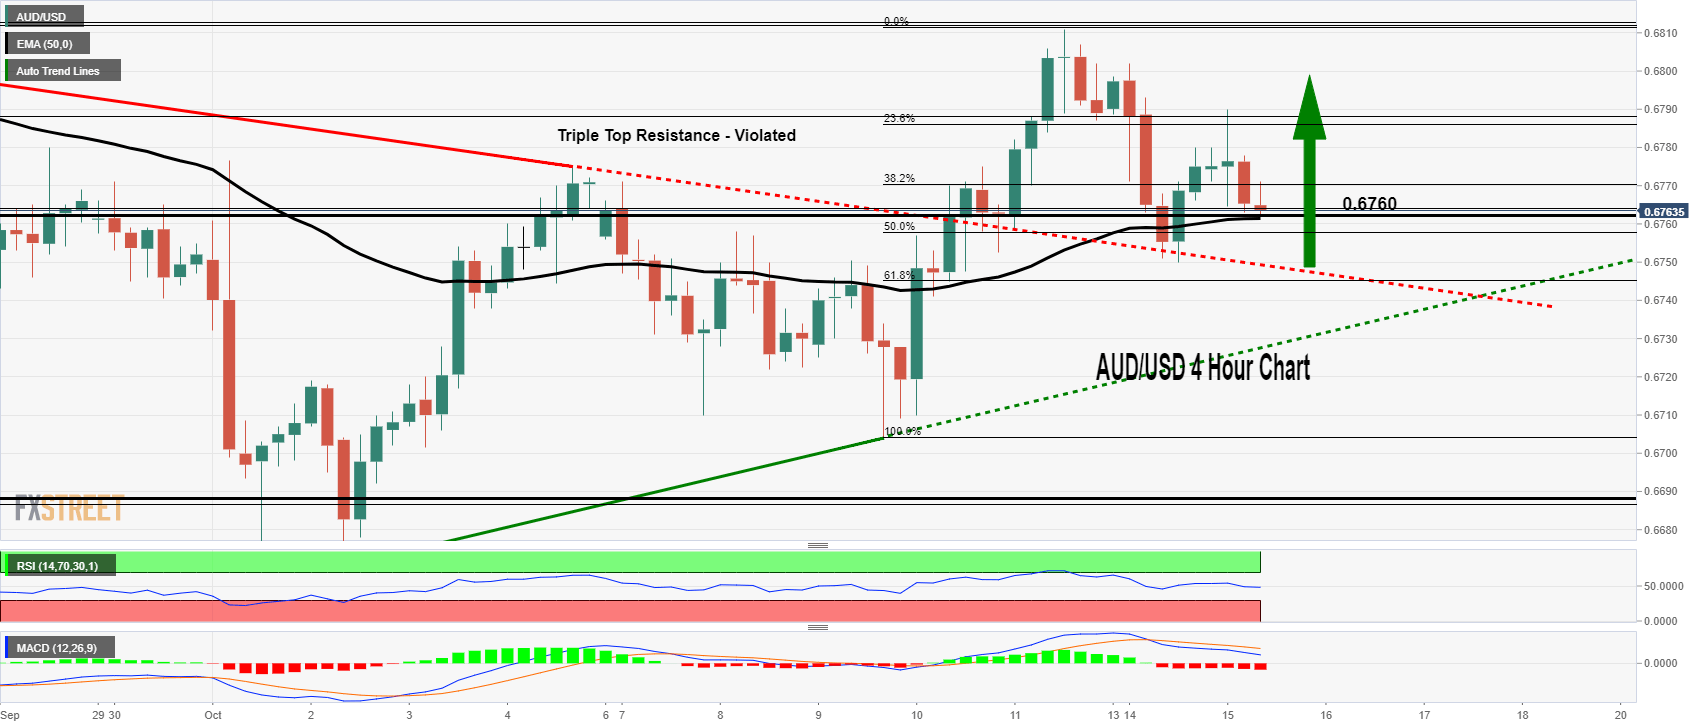
AUD/USD – Bearish Trendline Supports
The AUD/USD was opened at 0.67872 and has placed a high of 0.68013 and low of 0.67511 until now. The pair is currently trading at 0.67720 and has shown a Bearish trend for this day.
On Monday, the China Trade data gave mixed signals when the general customer administration of China released the Trade Balance for September in US Dollar terms as 39.8B against 35.1B and the trade balance in Chinese Yuan terms showed that trade surplus expanded to CNY 280B for the month of September from CNY 239.6B of August.
Further details on same format includes export declines from +2.6% to -0.7% and imports plunging -6.2% against -2.6% earlier. The Aussie traders got confused to get a clear image of the Chinese trade situation.
The latest headline from China related to the trade deal gave a hard time to this pair on Monday and made the prices to fall. The uncertainty because of no signed agreement is still in the market and can further affect the pair movement.
It should also be noted that the rejection of china to accept Trump’s proposal might turn Trump’s administration in the second round of talks. If that happens, the US-China trade war will continue for an unknown time of period, and the global economy would suffer more.
AUD/USD - Technical Levels
Support Resistance
0.6773 0.6812
0.6752 0.6831
0.6712 0.6871
Pivot Point 0.6792
AUD/USD - Daily Trade Sentiment
Recalling our previous update, the AUD/USD traded bearish to test long-held resistance become a support level of 0.6770. The MACD and Stochastics has crossed over on the lower side, suggesting chances of a further bearish trend on the Aussie Dollar.
The AUD/USD has completed 50% Fibonacci retracement around 0.6750, and below this, it can also go below 61.8% Fibo mark of 0.6740. The 50 periods EMA is supporting the pair right now, but the AUD/USD may trade bearish below 0.6792 today.
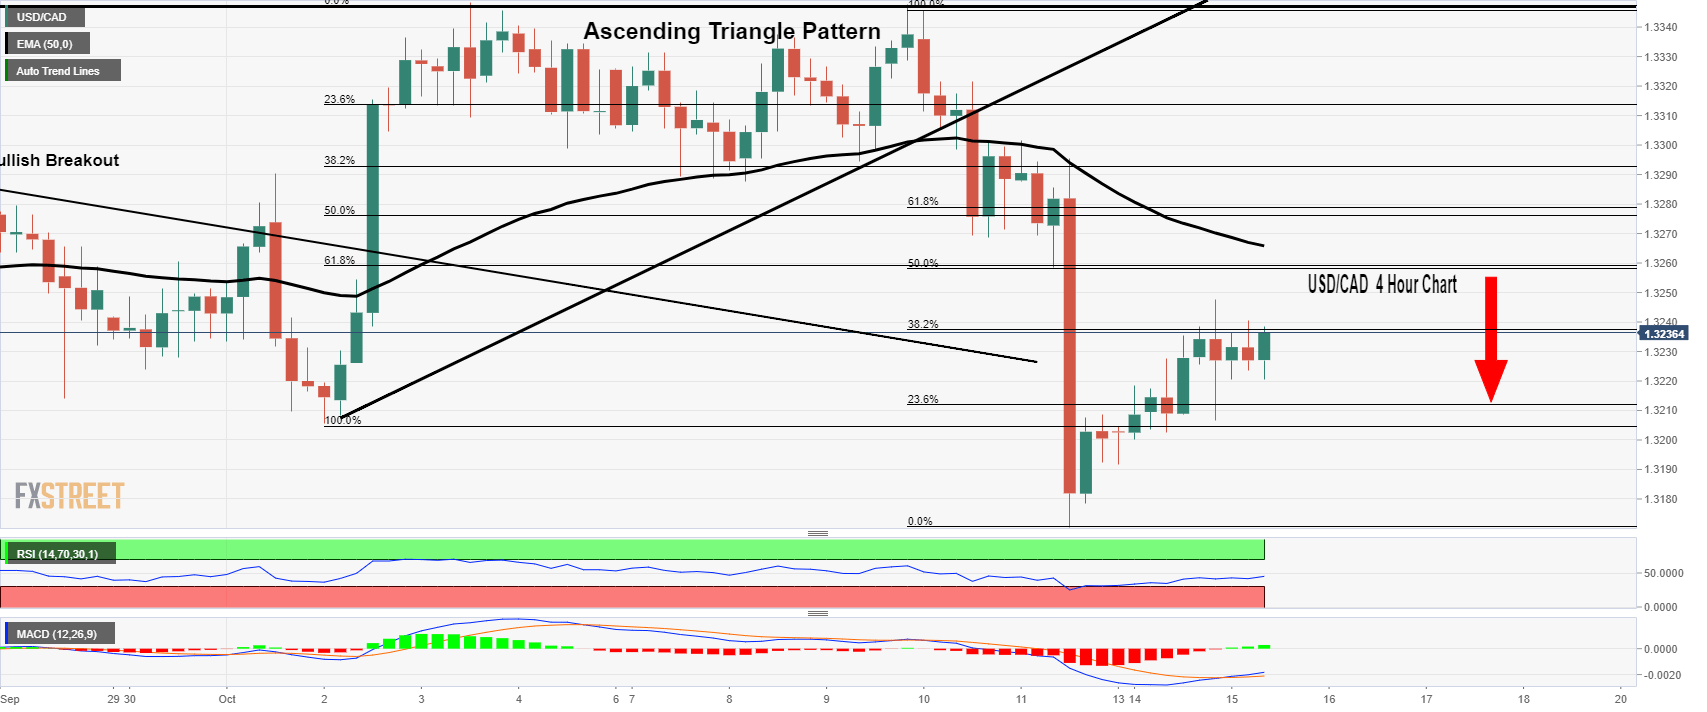
USD/CAD - 38.2% Retracement Blocking Loonie
The USD/CAD was opened at 1.32004 and has placed a high of 1.32371 and low of 1.31912 until now. The pair is currently trading at 1.32338 and has shown a Bullish trend for this day.
The Bank Holiday on Monday in Both related countries to USD/CAD, there was no macroeconomic data release that day. So, the movement of this pair USD/CAD was left with news and Crude oil price movement.
The emerging uncertainty over the “phase one” deal between US-China after Chinese demand for further trade talks before signing the agreement and heightened geopolitical tension in Middle-East gave a sharp drop in the prices of Crude Oil in the starting day of the week.
Crude Oil prices showed a rise in its prices in the second half of last week, but all of its gains were lost on Monday when it dropped down by 3.4% and traded back on $52.90 that day. The drop in crude oil prices put pressure on commodity-linked currency – Loonie and gave an upward trend to USD/CAD.
The poor performance of European currencies on Monday helped Greenback to find demand and added in the upward trend of USD/CAD on Monday.
USD/CAD - Technical Levels
Support Resistance
1.3146 1.3269
1.3097 1.3344
1.2974 1.3467
Pivot Point 1.322
USD/CAD - Daily Trade Sentiment
On the 4 hour chart, the USD/CAD as completed 38.2% retracement at 1.3240 level. After analyzing the recent price action and closing of candles, it seems like this level won't be able to survive, and we may see further buying in the USD/CAD.
To be sure, we should wait for the 1.3230 breakouts as above this; the pair can go for testing 1.3260 and 1.3272.
Risk Warning: CFD and Spot Forex trading both come with a high degree of risk. You must be prepared to sustain a total loss of any funds deposited with us, as well as any additional losses, charges, or other costs we incur in recovering any payment from you. Given the possibility of losing more than your entire investment, speculation in certain investments should only be conducted with risk capital funds that if lost will not significantly affect your personal or institution’s financial well-being. Before deciding to trade the products offered by us, you should carefully consider your objectives, financial situation, needs and level of experience. You should also be aware of all the risks associated with trading on margin.
Recommended Content
Editors’ Picks
EUR/USD clings to daily gains above 1.0650

EUR/USD gained traction and turned positive on the day above 1.0650. The improvement seen in risk mood following the earlier flight to safety weighs on the US Dollar ahead of the weekend and helps the pair push higher.
GBP/USD recovers toward 1.2450 after UK Retail Sales data

GBP/USD reversed its direction and advanced to the 1.2450 area after touching a fresh multi-month low below 1.2400 in the Asian session. The positive shift seen in risk mood on easing fears over a deepening Iran-Israel conflict supports the pair.
Gold holds steady at around $2,380 following earlier spike

Gold stabilized near $2,380 after spiking above $2,400 with the immediate reaction to reports of Israel striking Iran. Meanwhile, the pullback seen in the US Treasury bond yields helps XAU/USD hold its ground.
Bitcoin Weekly Forecast: BTC post-halving rally could be partially priced in Premium

Bitcoin price shows no signs of directional bias while it holds above $60,000. The fourth BTC halving is partially priced in, according to Deutsche Bank’s research.
Week ahead – US GDP and BoJ decision on top of next week’s agenda

US GDP, core PCE and PMIs the next tests for the Dollar. Investors await BoJ for guidance about next rate hike. EU and UK PMIs, as well as Australian CPIs also on tap.