![]() Norm Winski
Norm Winski
Independent Analyst
2022 February forecast for fun fest
It is a tradition of this letter that every year, about this time, we explore some of the fun methods of forecasting the coming year. Some have shown to have some statistical merit and some are just for fun. This year, we will explore the Chinese New Year and Chinese Astrology, the January Barometer, and the Super Bowl Stock Market indicator.
Chinese astrology
Review – 2021 – The Chinese New Year began February 12, on the New Moon.
“…In terms of 2021 being a bull year, Janet says: “The MSCI World Index Performance shows that previous Years of the Ox have seen an average rise in performance of 12.3% across mid- and large-cap corporates across 23 developed markets in 1973, 1985, 1997 and 2009. Whilst it is impossible to predict the figures for next year, we anticipate that 2021 will be a time of more durable recovery where sectors affected by the pandemic will improve. We expect recovery to remain uneven due to the scarring of economic impact caused by global lockdowns.”
Obviously, we have to count this as a win with the S&P 500 closing 2021 up 26.9% for 2021.
2022 – The Chinese New Year will begin on February 01 with the New Moon. According to Chinese Astrology, 2022 is year of the Tiger. The year of the Tiger should bring expansion thru aggression and conflict in the world.
“The Stock Market will get off to a roaring start when the new year based on the Chinese calendar kicks in from February 1, analysts Justin Chan and Stella Liu said at a briefing on Tuesday. March and September are potential pitfalls, they added. “The noble tiger will lead us on a journey of twists and turns that finishes on a high note,” they said. In the year of the Water Tiger, the lack of fire or metal presages a year of sudden changes. The Stock Market’s lucky elements are fire and wood, so wood’s abundance in the Water Tiger’s destiny chart bodes well for the Stock Market in 2022.'
January barometer & Super Bowl indicator
Two historically accurate forecasting Stock Market models are the January Barometer and the Super Bowl Stock Market Indicator.
2021 Review- “However, the 2021 January barometer charts are near the end of this letter. By the way, the January Barometer is another name for a type of Fractal Forecast.
The January Barometer forecasts an up or down year based on whether January is an up or down month. This has been shown to be statistically 75% accurate since 1950. January 2021 had a big rally into the third week and then closed lower for the month. This suggests that 2021 should be an up year in the first three quarters of the year and then down for the fourth quarter, which could result in a down year. However, please keep in mind that these models can and do invert. Follow the track that is working.”
Results – The S&P 500 was up every quarter and finished near the high of the year, up 26.9%.
2021 Super Bowl Review - “The 2021 Super Bowl will be played on Sunday, February 7. Therefore we won’t know how that game comes out for another week. Those charts will be in the March letter. The Super Bowl Indicator is based on who wins the Super Bowl. The National Football League is divided into two conferences, the NFC and the AFC. The champion from each conference meets in the Super Bowl to determine the NFL Super Bowl Champion. The pattern since the inception of the Super Bowl in 1967 is that if the NFC team wins, this is bullish for the Stock Market, indicating an up year, and if the AFC team wins, this is bearish for the Stock Market and indicates a down year. I know this sounds crazy, but it has worked over 80% of the time.”
Result – the NFC Tampa Bay Buccaneers won the Super Bowl, which is an indication for an up year and the S&P 500 closed 2021 with a 26.9% gain.
2022 Update - This year, the Super Bowl will played on Sunday, February 13, between the NFC champion Los Angeles Rams and the AFC champion Cincinnati Bengals (year of the Tiger). The old Wall Street adage that as January goes, so goes the year, not only applies to the Stock Market, but also to the Super Bowl. Given the very positive track record of both models, there should be a high correlation between these two indicators. With the exception of one trading day, January 31, we have all of January’s data to make our forecast. It is highly likely that the January Barometer will be forecasting a down year. That should also mean that the AFC champion Cincinnati Bengals (Chinese year of the Tiger) should win the Super Bowl.
Stocks
12/31 SPX CL 4766.18.
01/28 SPX CL 4431.85.
January Review – “Astrologically, January looks like it is going to be another very volatile month, with several huge events. Right off the bat, over the New Year’s weekend, we have a Full Moon at Perigee. After that, things quiet down somewhat until the second week. Following are the top Astro events of the month:
1/10 AC – Mercury 0 North Latitude; 1/12 PM – Saturn 0 US MC; 1/13 AC – Mercury turns Retrograde; 1/14 AC – Mercury Perihelion; 1/14 AC – Full Moon in Cancer; 1/14 AC – Uranus in Taurus turns Direct; 1/21 AC – Venus Perihelion; and 1/28 AC – Venus in Capricorn turns Direct. Please note the big cluster for the weekend of 1/14.”
Results
Market math
1/02 – 683 Music Math from the 2/19/2020 major high. 1/02 was a Sunday. 1/03 was the first day of the new year, and the S&P was very close in price to the high of the month, which was on 1/04.
1/11 – 14,400 (120^2) from the 8/09/1982 major low. 1//11 was close in price and one day past a good short term low.
Score – 2 out of 2 good dates = 100%.
DJIA* – 1/3, 1/10, 1/18, 1/20, 1/24, 1/25-26, 1/28 AC.
1/03 was the first trading day of the new year and very close in price to the high of the month, which was on 1/04.
1/10 was a good short term low. 1/18 and 1/20 were not effective. 1/24 was the exact low of the month.
1/25 was close in price and one day past the 1/24 low of the month. 1/26 was a short term high.
Score – 5 out of 7 good dates = 71.43.
S&P 500* - 1/4, 1/10, 1/18, 1/19, 1/28 AC.
1/4 was the exact high of the month. 1/10 was a good short term low. 1/18 and 1/19 were not effective.
Score – 2 out of 4 good dates = 50%.
Fibonacci – 1/10, 1/13, 1/21, 1/25.
1/10 was a good short term low. 1/13 was very close in price and one day past a very good high.
1/21 was not effective. 1/25 was close in price and one day past the 1/24 low of the month.
Score – 3 out of 4 good dates = 75%.
Astro – 1/3, 1/10, 1/11, 1/12-13, 1/14, 1/18, 1/24, 1/25-26, 1/28 AC.
1/3 was close in price and one day ahead of the high of the month. 1/10 was a good short term low. 1/11 was close in price and one day ahead of the 1/12 high. 1/12 was a very good high. 1/13 was very close in price and one day past the 1/12 high. 1/14 and 1/18 were not effective. 1/24 was the exact low of the month. 1/25 was close in price and one day past the 1/24 low of the month. 1/26 was a short term high. Score – 8 out of 10 good dates = 80%.
Total Score – 22 out of 29 good dates = 75.86%.
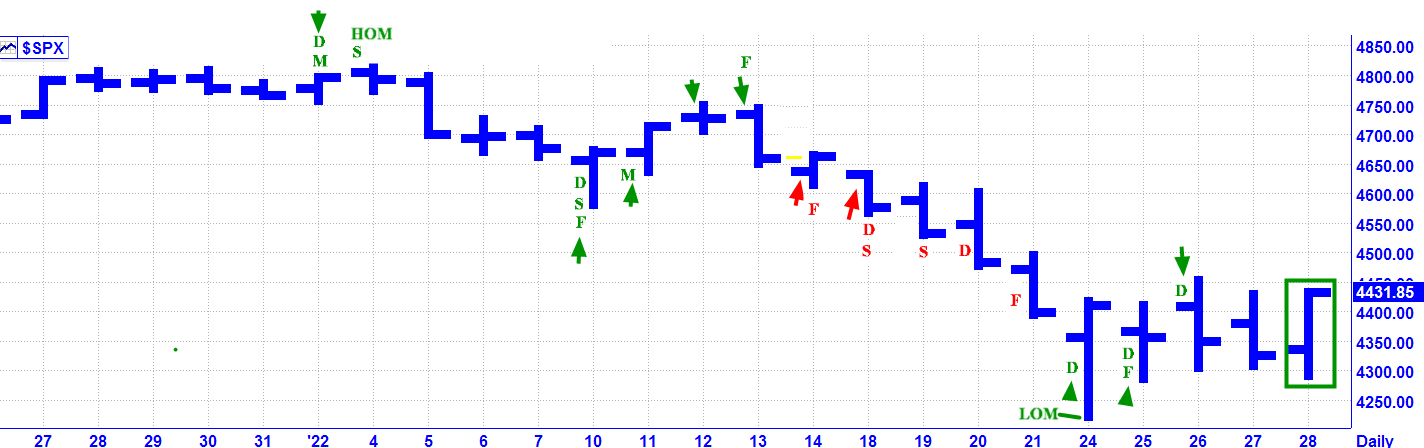
LEGEND: If it is Green it is a winner. If it is Red it is a miss. A Green encircled bar at the end of the month, is still open to evaluation due to a lack of time. A Yellow Bar is a Pass. Astro Date = Arrow. D = DJIA. F = Fibonacci. M = Market Math. N = NYSE. S = S&P. U = US Fed. B = BankEn/Fed. LOM = Low of the Month. HOM = High of the Month.
February Update – This month is another high energy month with some huge cycles culminating. Following are some of the biggest and best Astro events for the coming month: 1/28 AC – Venus turns Direct; 1/31 – New Moon; 2/3 AC – Mercury turns Direct; 2/4 PM – Saturn Parallel US MC; 2/10 AM – Helio Jupiter Parallel Neptune; 2/16 AM – Full Moon; 2/16 AC - Mercury Maximum Elongation; 2/17 AC – Saturn Parallel US Moon & Mercury 0 South Latitude; 2/18 – Neptune Contra-Parallel US Neptune & Pluto 0 US Pluto (248 year cycle WOW!); and 2/22 AC – Saturn 0 US Moon. Please note the huge long term cycles hitting the US. This has the potential for some major crisis to develop. Technically, the S&P 500 is currently in a downtrend. The strong rally on 1/28 sets up a possible high into our 1/31 change in trend window.
Market math
2/03/22 – 20,449 (143^2) days from the 2/09/1966 major high.
2/17/22 – 729 (27^2) from the 2/19/2020 major high.
2/22/22 – 12,544 (112^2) days from the 10/20/1987 major low.
DJIA* – 2/7, 2/14, 2/22.
S&P 500* - 1/31. 2/25.
Fibonacci – 2/6, 2/15-16, 2/18.
Astro – 1/31, 2/7, 2/14, 2/16, 2/18, 2/22, 2/23, 2/24.
Note: All information on this page is subject to change. The use of this website constitutes acceptance of our user agreement. Please read our privacy policy and legal disclaimer. Opinions expressed at FXstreet.com are those of the individual authors and do not necessarily represent the opinion of FXstreet.com or its management. Risk Disclosure: Trading foreign exchange on margin carries a high level of risk, and may not be suitable for all investors. The high degree of leverage can work against you as well as for you. Before deciding to invest in foreign exchange you should carefully consider your investment objectives, level of experience, and risk appetite. The possibility exists that you could sustain a loss of some or all of your initial investment and therefore you should not invest money that you cannot afford to lose. You should be aware of all the risks associated with foreign exchange trading, and seek advice from an independent financial advisor if you have any doubts.
Recommended Content
Editors’ Picks
AUD/USD jumps above 0.6500 after hot Australian CPI data

AUD/USD extended gains and recaptured 0.6500 in Asian trading, following the release of hotter-than-expected Australian inflation data. The Australian CPI rose 1% in QoQ in Q1 against 0.8% forecast, providing extra legs to the Australian Dollar upside.
USD/JPY hangs near 34-year high at 154.88 as intervention risks loom

USD/JPY is sitting at a multi-decade high of 154.88 reached on Tuesday. Traders refrain from placing fresh bets on the pair as Japan's FX intervention risks loom. Broad US Dollar weakness also caps the upside in the major. US Durable Goods data are next on tap.
Gold price cautious despite weaker US Dollar and falling US yields

Gold retreats modestly after failing to sustain gains despite fall in US Treasury yields, weaker US Dollar. XAU/USD struggles to capitalize following release of weaker-than-expected S&P Global PMIs, fueling speculation about potential Fed rate cuts.
Crypto community reacts as BRICS considers launching stablecoin for international trade settlement

BRICS is intensifying efforts to reduce its reliance on the US dollar after plans for its stablecoin effort surfaced online on Tuesday. Most people expect the stablecoin to be backed by gold, considering BRICS nations have been accumulating large holdings of the commodity.
US versus the Eurozone: Inflation divergence causes monetary desynchronization

Historically there is a very close correlation between changes in US Treasury yields and German Bund yields. This is relevant at the current juncture, considering that the recent hawkish twist in the tone of the Fed might continue to push US long-term interest rates higher and put upward pressure on bond yields in the Eurozone.