![]() Norm Winski
Norm Winski
Independent Analyst
Recap 6/29 – Tuesday, the S&P opened with a rally high, up 6 handles, in the first minute. From that high, the S&P declined 29 handles into a 9:45 AM low of the day. From that low, the S&P rallied 38 handles into a 10:03 AM high of the day. From that high, the S&P zig zagged 38 handles lower into a 12:29 PM low. From that low, the S&P rallied 31 handles into a 2:05 AM high. From that high, the S&P declined 20 handles into a 3:03 PM low. From that low, the S&P rallied 19 handles into a 3:30 PM high. From that high, the S&P declined 19 handles into a 3:53 PM low. From that low, the S&P bounced about 10 handles into the close.
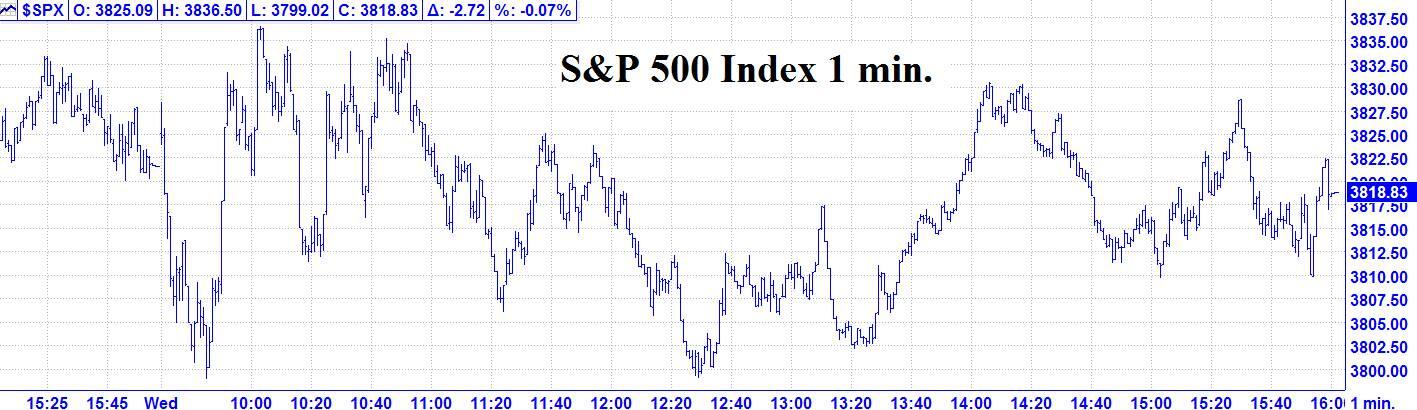
6/29 – The major indices had a whipsaw mixed day to finish with the following closes: DJIA + 82.32; S&P 500 – 2.72; and the Nasdaq Composite - 3.65.
Looking Ahead & Review - Wednesday’s price action for the S&P was not constructive. At this writing, about 4:00 AM EDT, the S&P futures are down about 40 handles. Last chance for a low, that we will allow, is the first half hour on Thursday. If the S&P hasn’t turned by then, it’s time to cut losses. Next change in trend is due 7.01 AC.
The good news is that the Crude Oil trade worked very well on Wednesday. You were alerted that the September contract was approaching the $111 level, which is the .618 retracement level, from last week’s decline. In fact, the September Crude Oil rallied to a high of $111.14 before dropping about 4 –1/2 handles, which on the big contract is $4,500, in a few hours.
The Now Index has moved to the BUY ALERT ZONE. This is a cautionary indication of a moderate imbalance of too many shorts. It is not an outright buy signal.
Coming events
(Stocks potentially respond to all events).
5. D. 6/28 AC – New Moon in Cancer Apogee. Major change in trend Financials, Grains, Precious Metals, Silver.
E. 7/01 AC – Jupiter 120 US North Node. Major change in trend US Stocks, T-Bonds, US Dollar.
Stock market key dates
Market math
6/29 = 861 Music days > 2/19/2020 MAJOR HIGH.
Astro – 6/29, 7/1 AC.
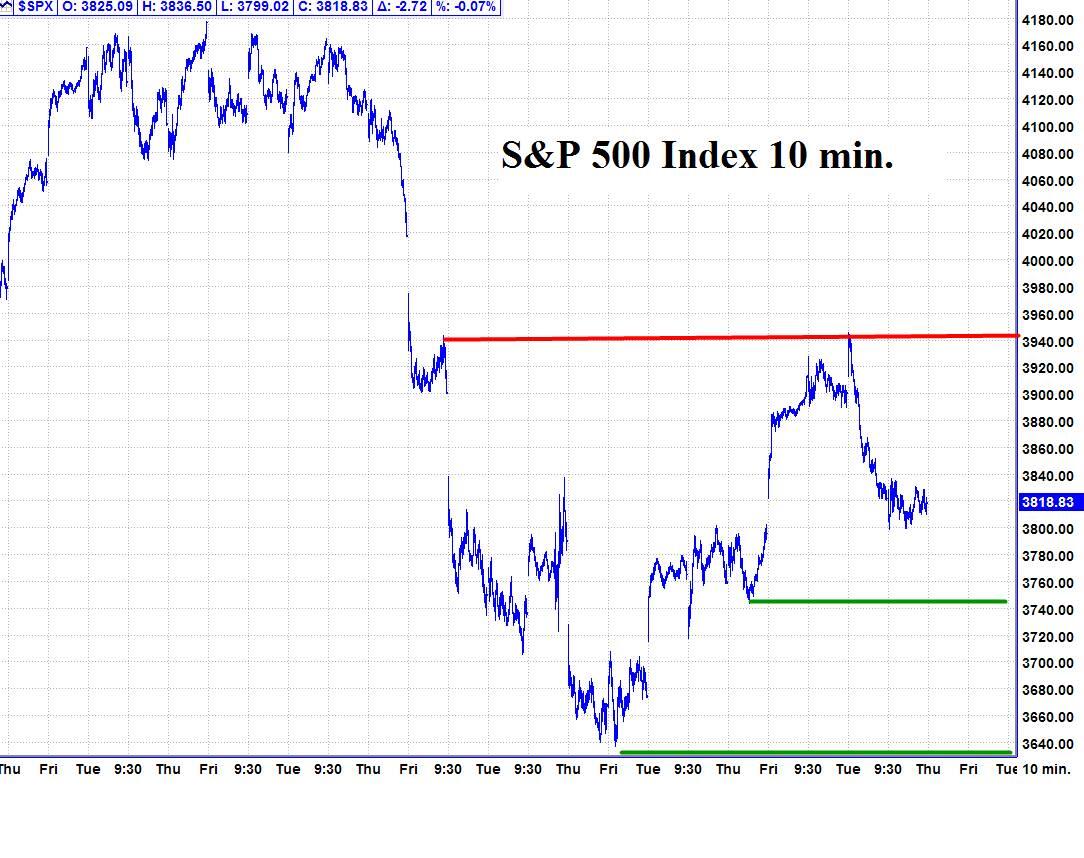
Please see below the S&P 500 10 minute chart.
Support - 3744 Resistance – 3944.
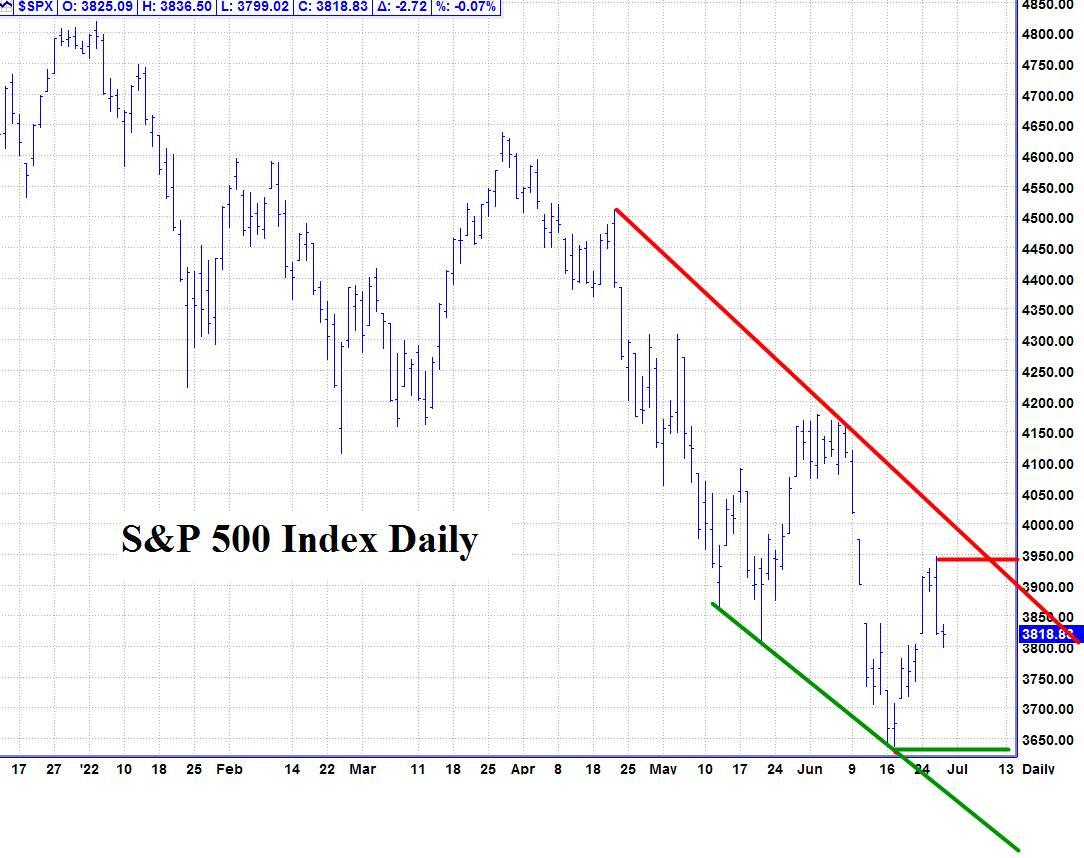
Please see below the S&P 500 Daily chart.
Support - 3820 Resistance – 3945.
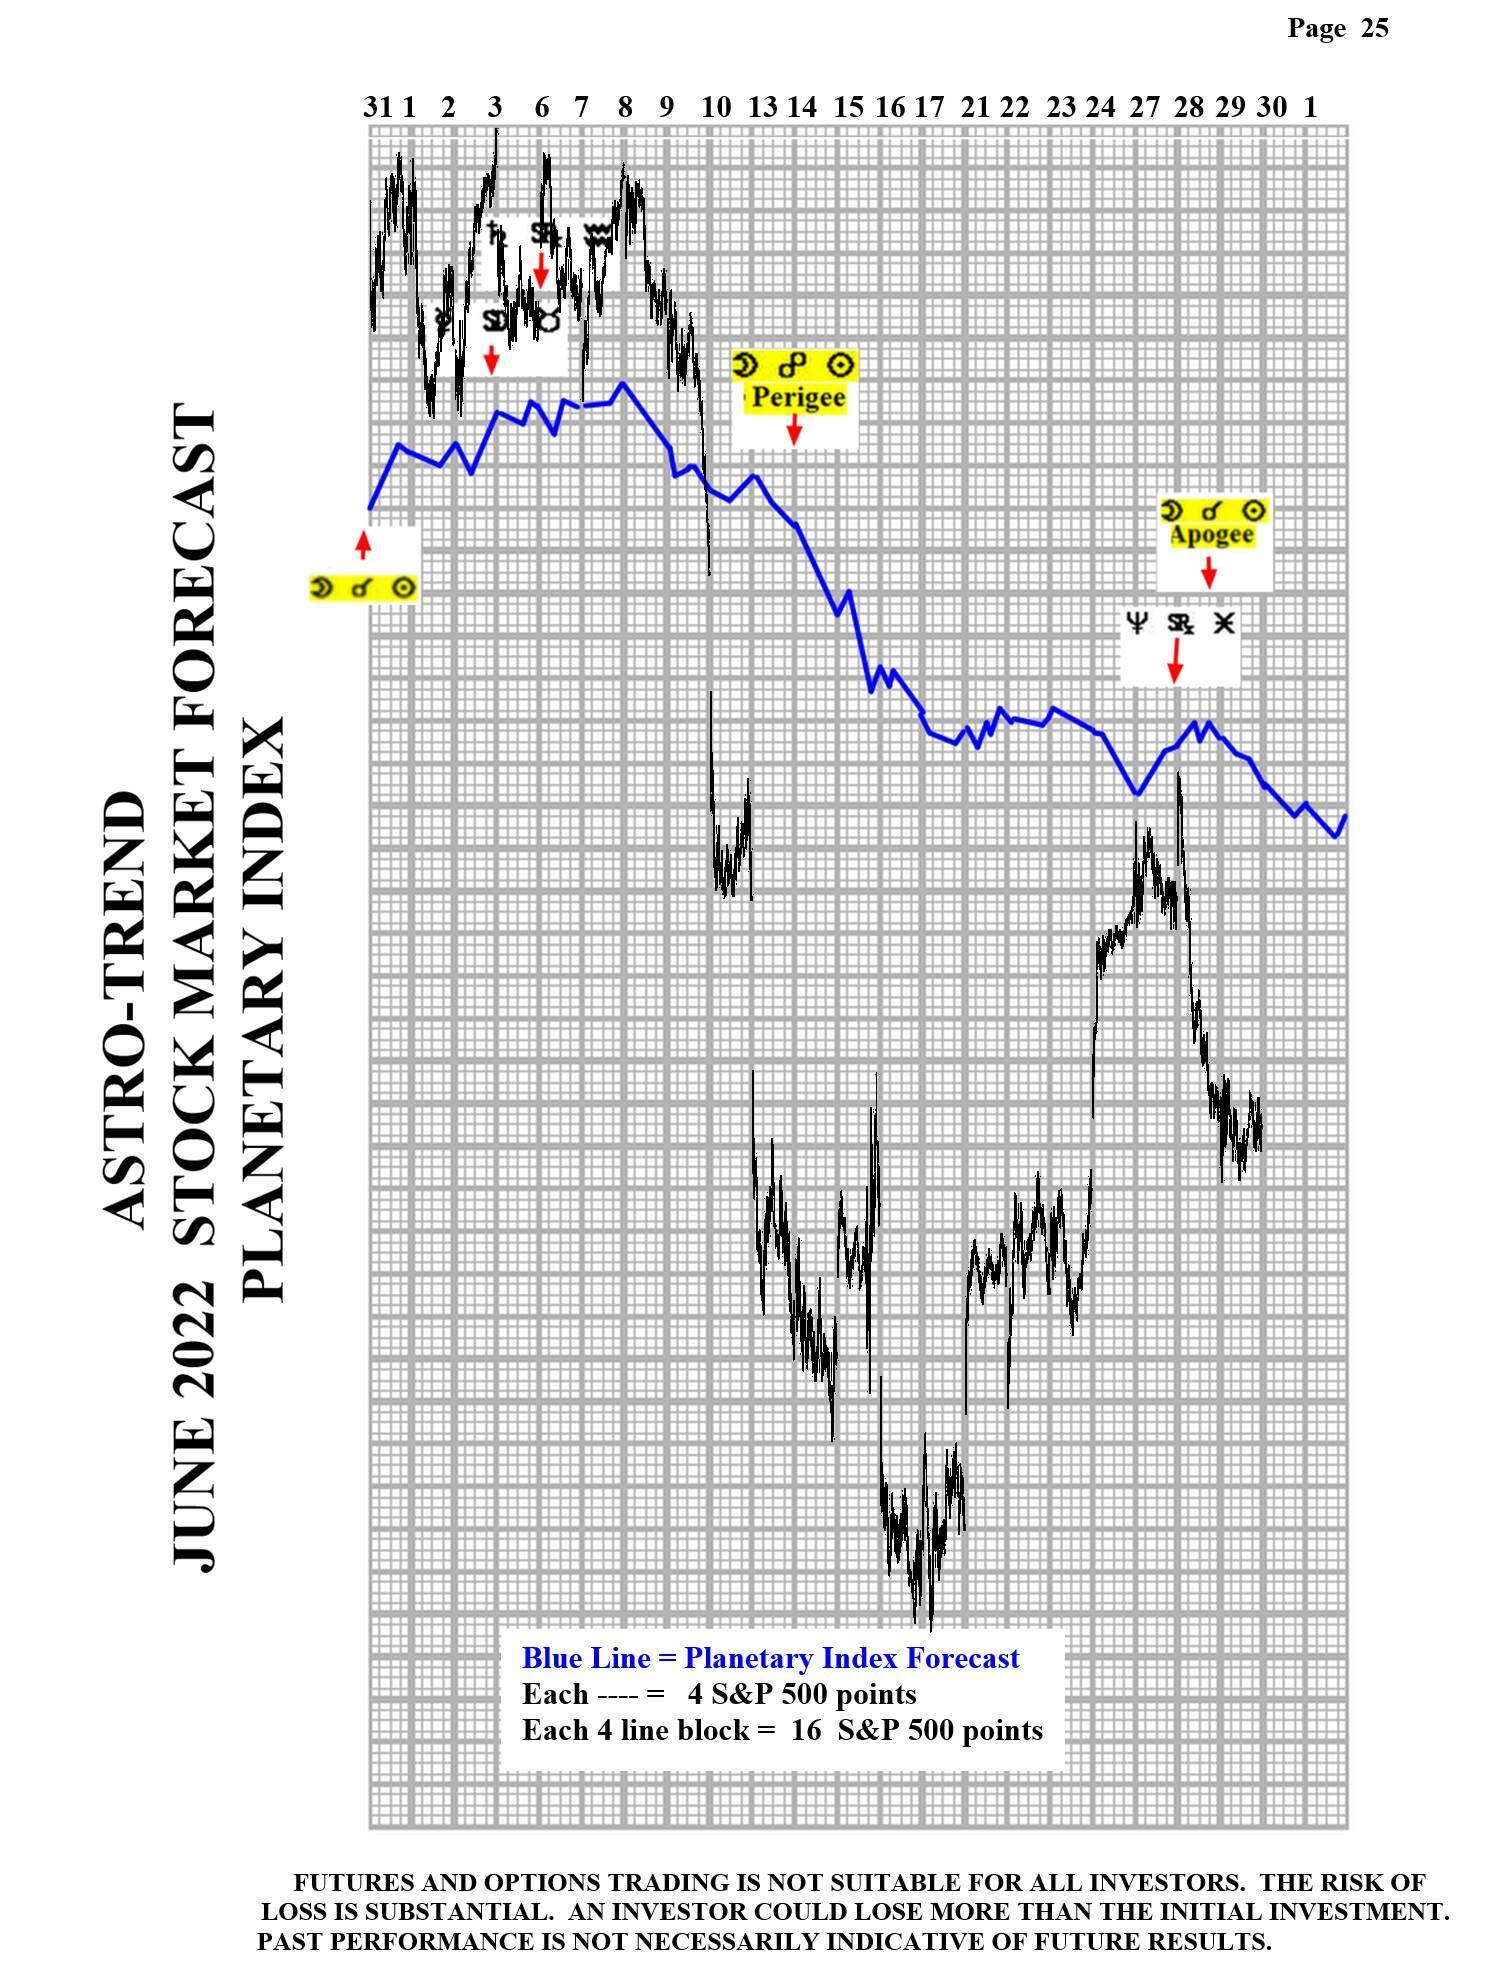
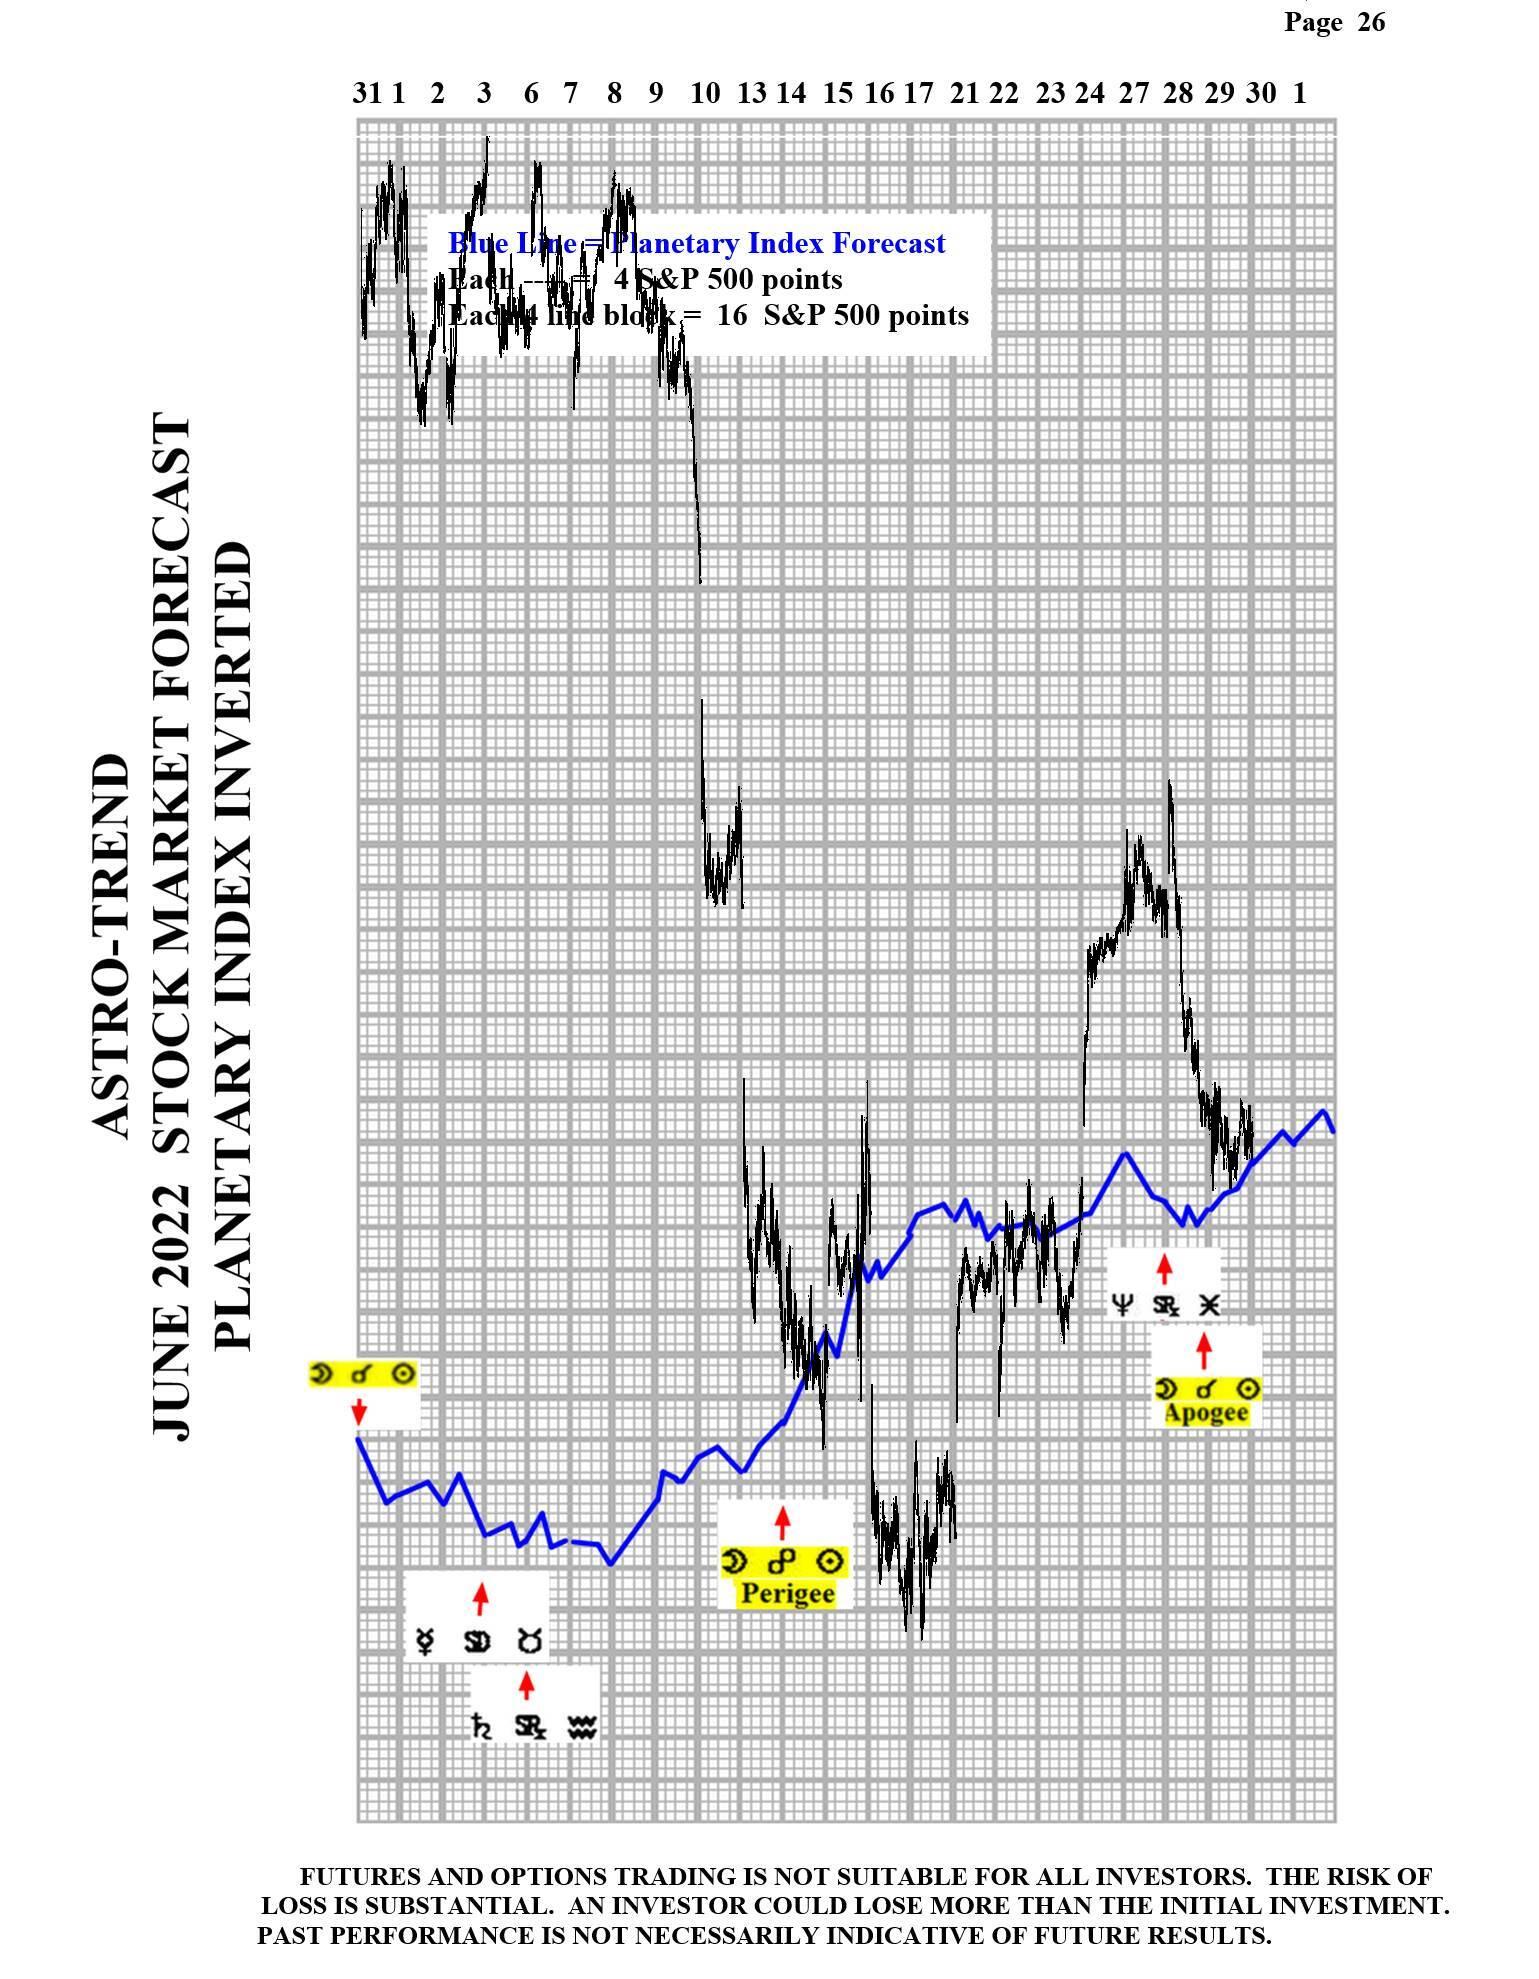
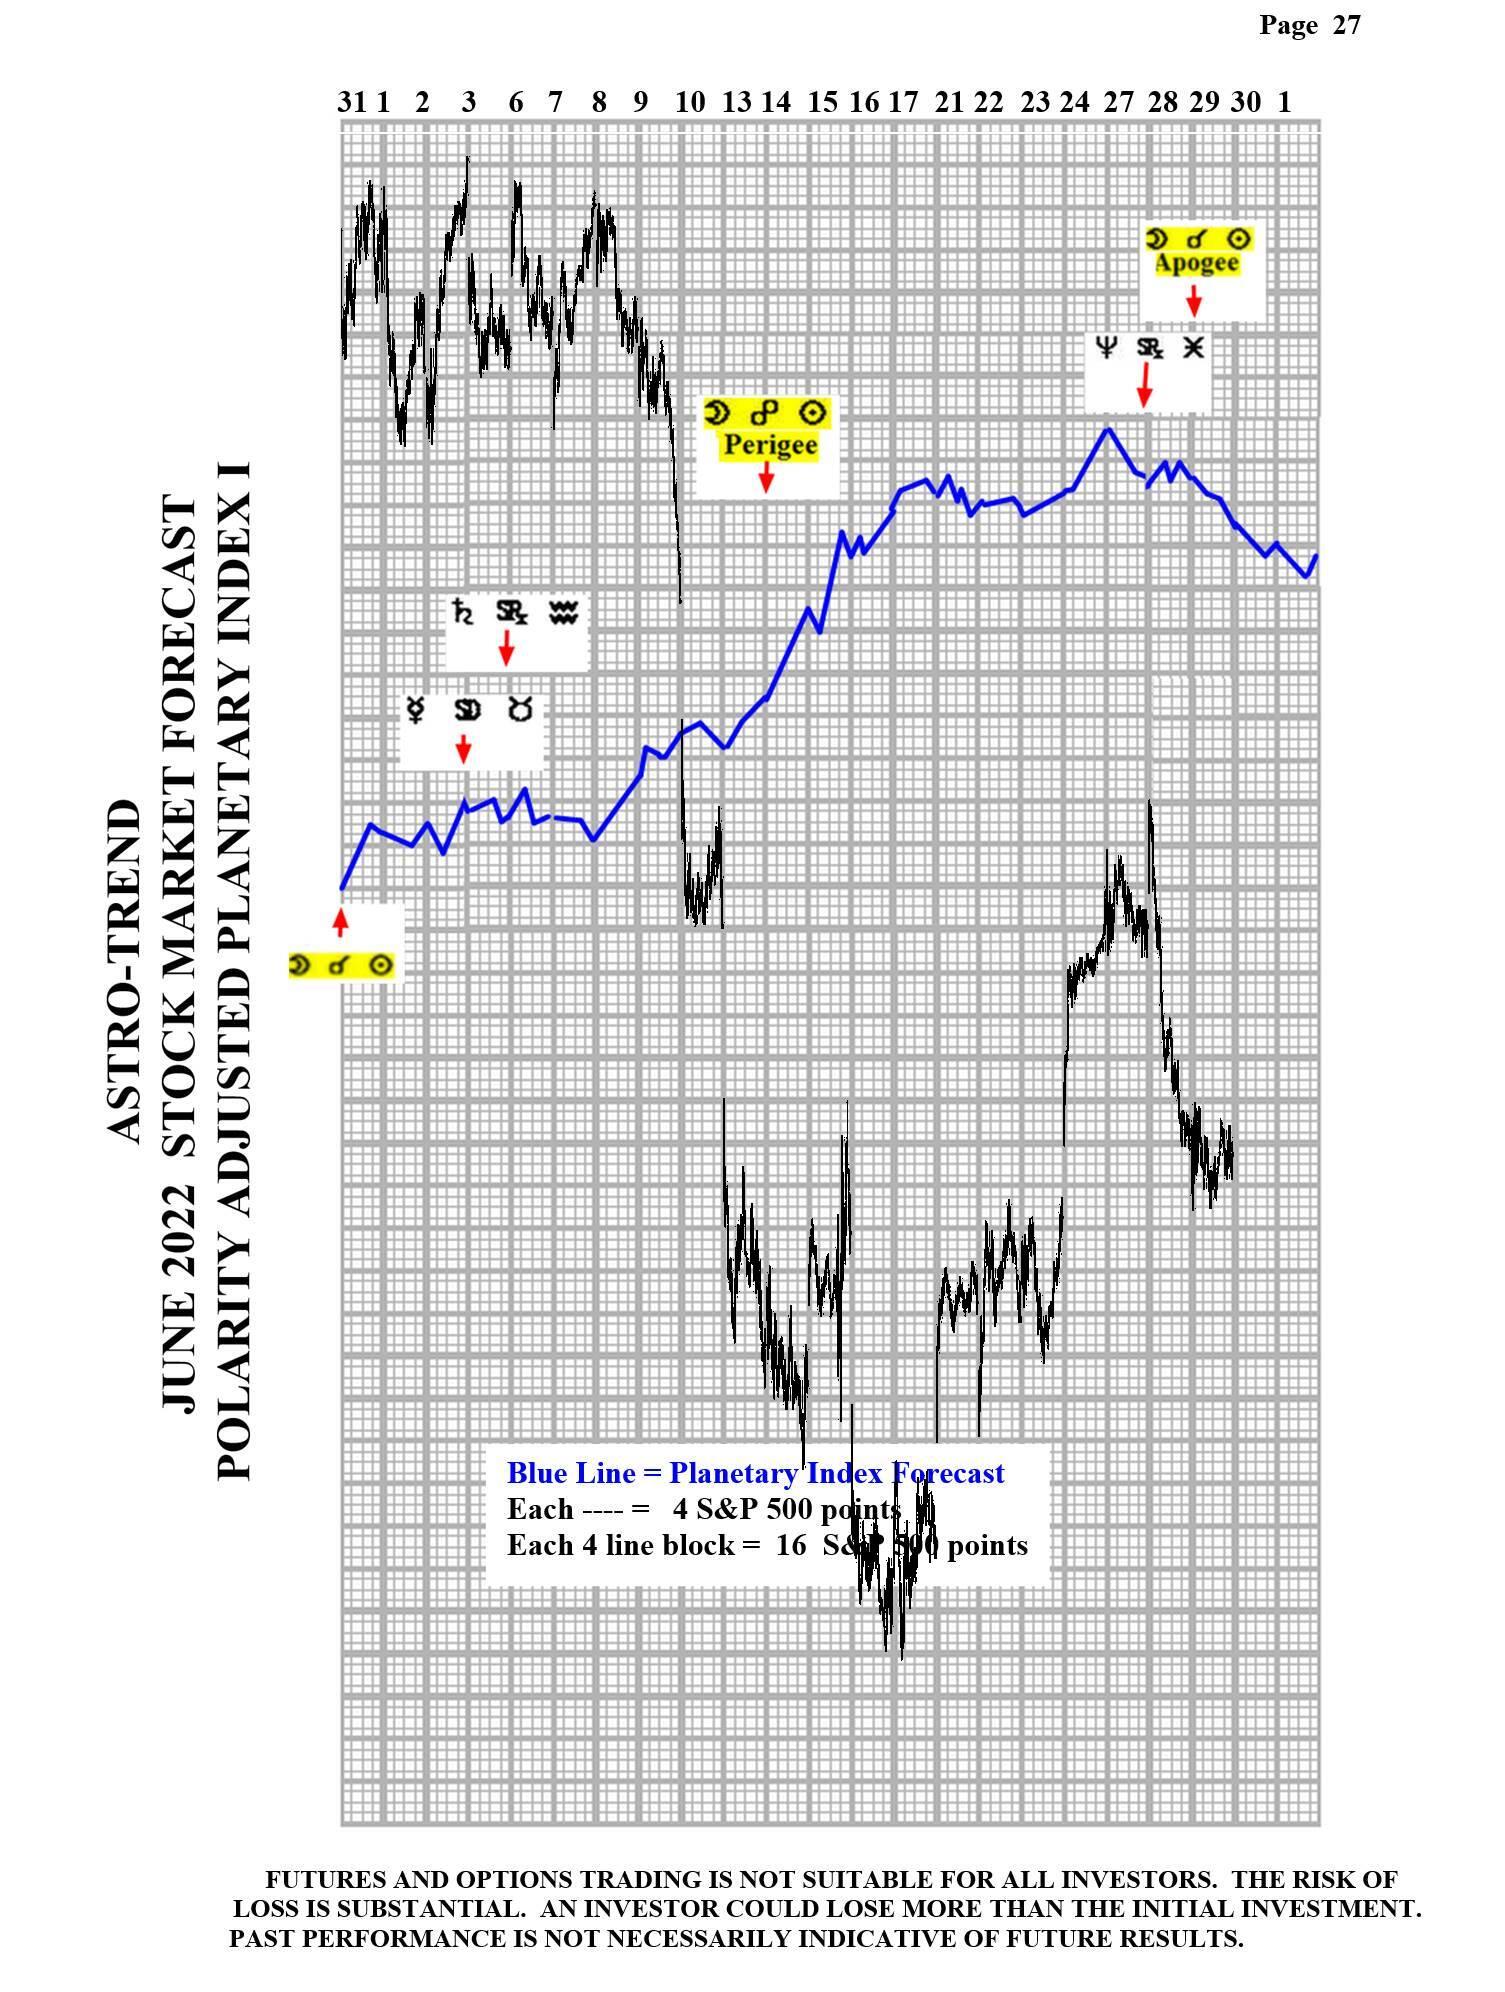
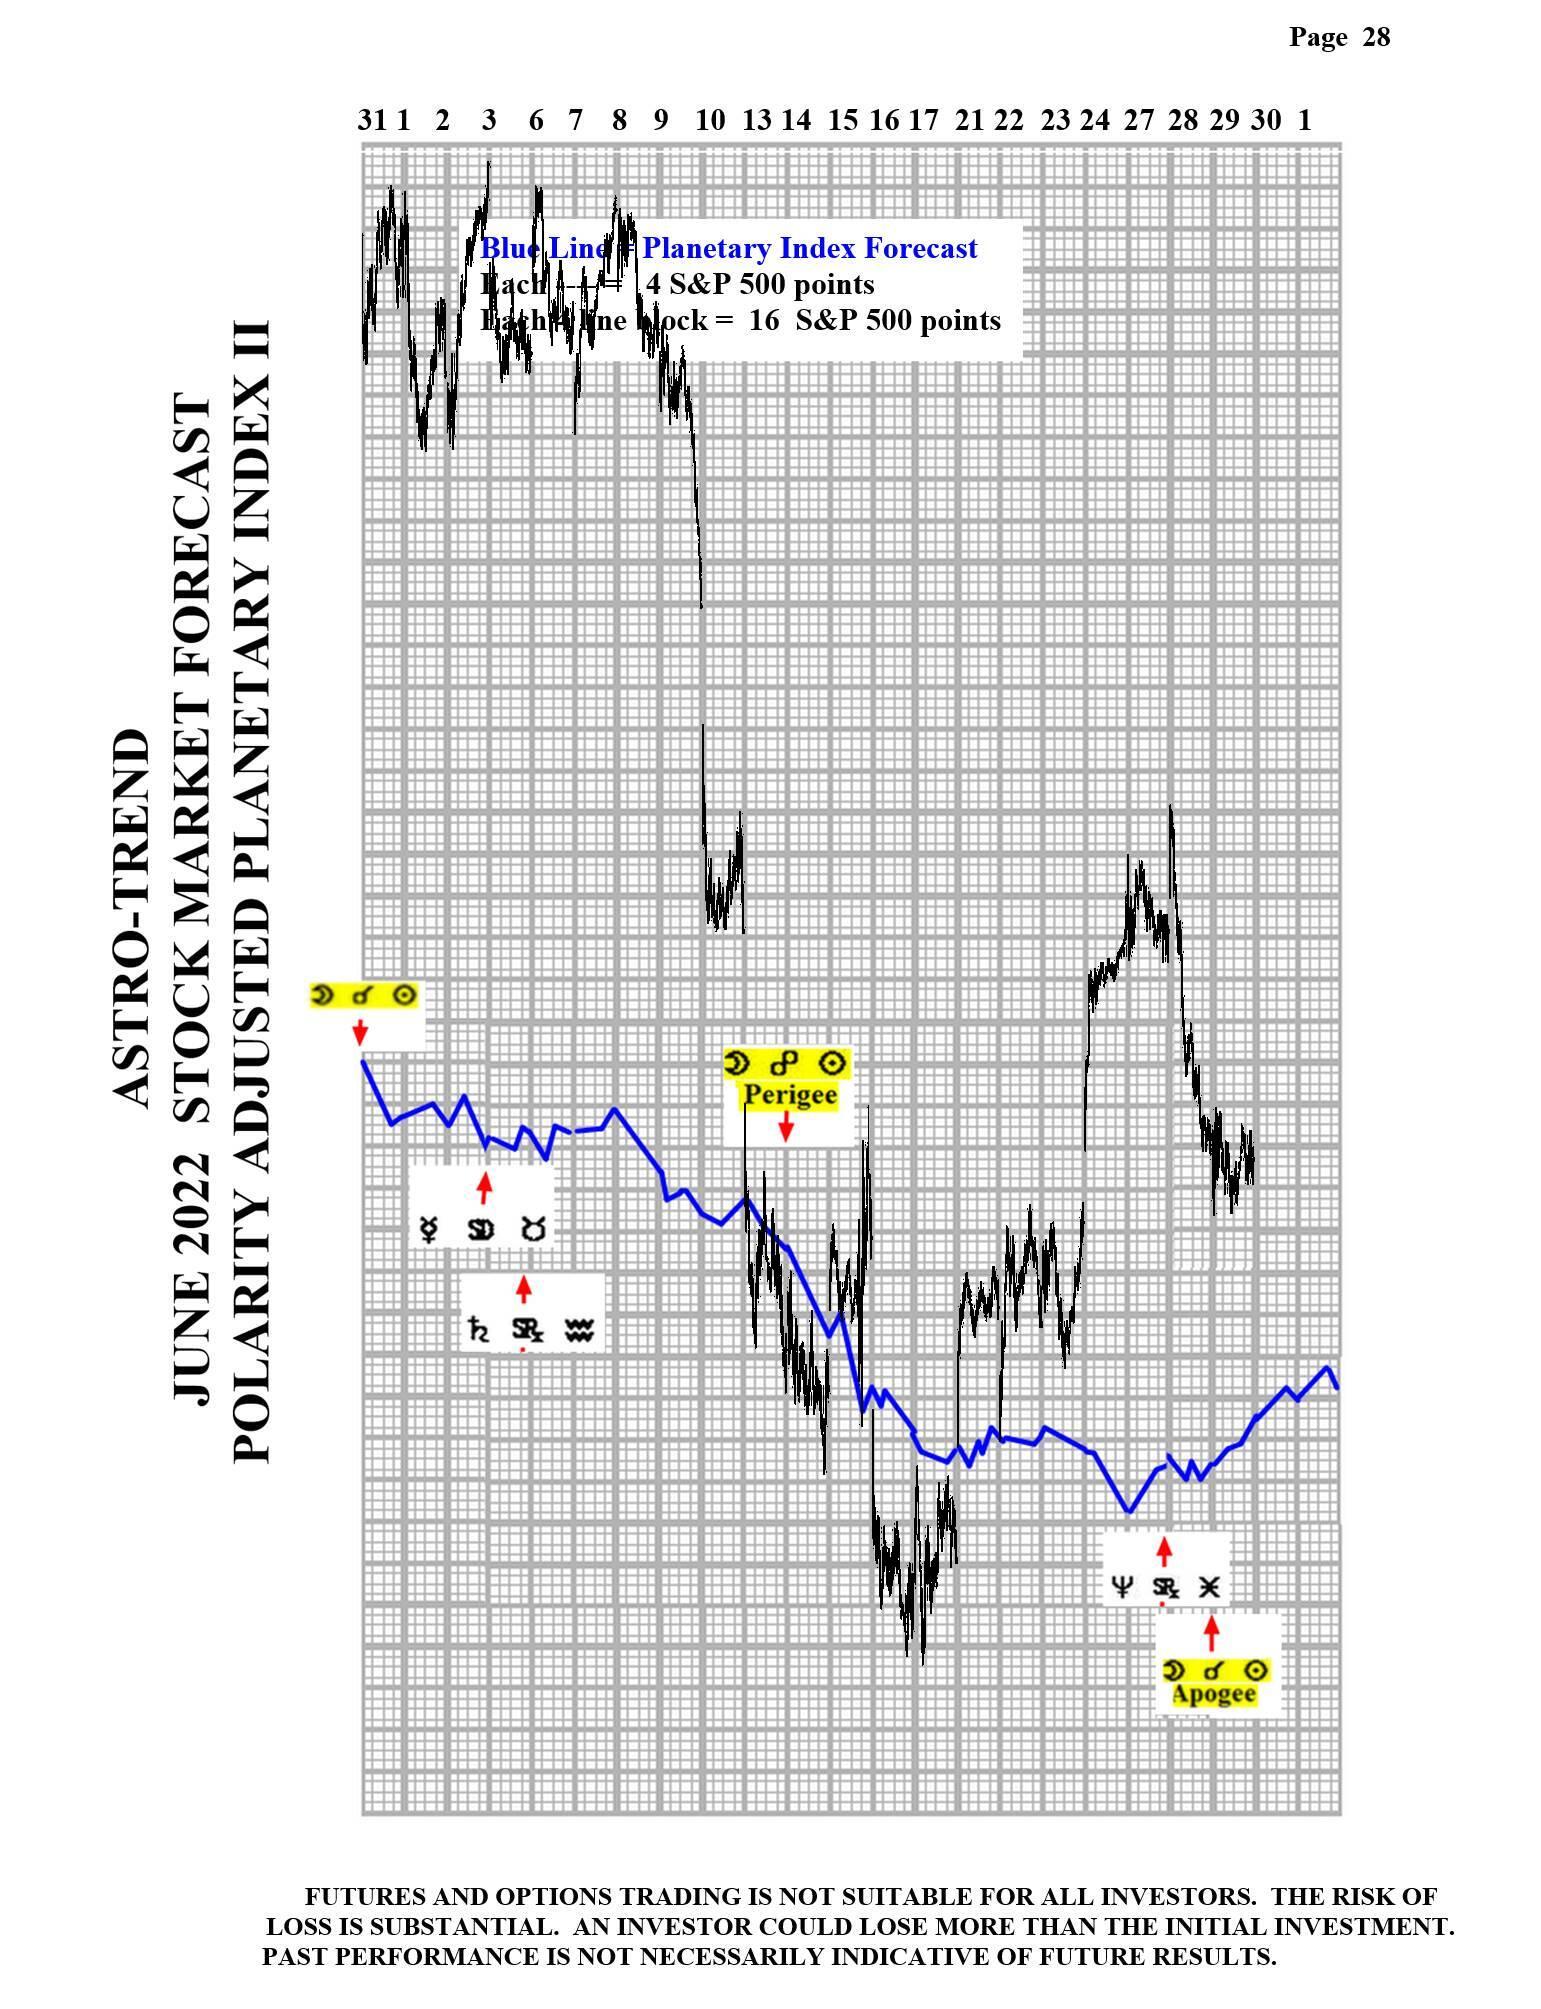
Please see below the June Planetary Index chart with S&P 500 10 minute bars for results.
Note: All information on this page is subject to change. The use of this website constitutes acceptance of our user agreement. Please read our privacy policy and legal disclaimer. Opinions expressed at FXstreet.com are those of the individual authors and do not necessarily represent the opinion of FXstreet.com or its management. Risk Disclosure: Trading foreign exchange on margin carries a high level of risk, and may not be suitable for all investors. The high degree of leverage can work against you as well as for you. Before deciding to invest in foreign exchange you should carefully consider your investment objectives, level of experience, and risk appetite. The possibility exists that you could sustain a loss of some or all of your initial investment and therefore you should not invest money that you cannot afford to lose. You should be aware of all the risks associated with foreign exchange trading, and seek advice from an independent financial advisor if you have any doubts.
Recommended Content
Editors’ Picks
EUR/USD clings to daily gains above 1.0650

EUR/USD gained traction and turned positive on the day above 1.0650. The improvement seen in risk mood following the earlier flight to safety weighs on the US Dollar ahead of the weekend and helps the pair push higher.
GBP/USD recovers toward 1.2450 after UK Retail Sales data

GBP/USD reversed its direction and advanced to the 1.2450 area after touching a fresh multi-month low below 1.2400 in the Asian session. The positive shift seen in risk mood on easing fears over a deepening Iran-Israel conflict supports the pair.
Gold holds steady at around $2,380 following earlier spike

Gold stabilized near $2,380 after spiking above $2,400 with the immediate reaction to reports of Israel striking Iran. Meanwhile, the pullback seen in the US Treasury bond yields helps XAU/USD hold its ground.
Bitcoin Weekly Forecast: BTC post-halving rally could be partially priced in Premium

Bitcoin price shows no signs of directional bias while it holds above $60,000. The fourth BTC halving is partially priced in, according to Deutsche Bank’s research.
Week ahead – US GDP and BoJ decision on top of next week’s agenda

US GDP, core PCE and PMIs the next tests for the Dollar. Investors await BoJ for guidance about next rate hike. EU and UK PMIs, as well as Australian CPIs also on tap.