![]() Norm Winski
Norm Winski
Independent Analyst
Recap 6/21 – Tuesday, the S&P opened with a 40 handles gap up and then rallied another 62 handles into an 11:04 AM high. From that high, the S&P declined 22 handle into a 12;11 PM low. From that low, the S&P gradually rallied 25 handles into a 3:13 PM high of the day. From that high, the S&P declined 15 handles into the close.
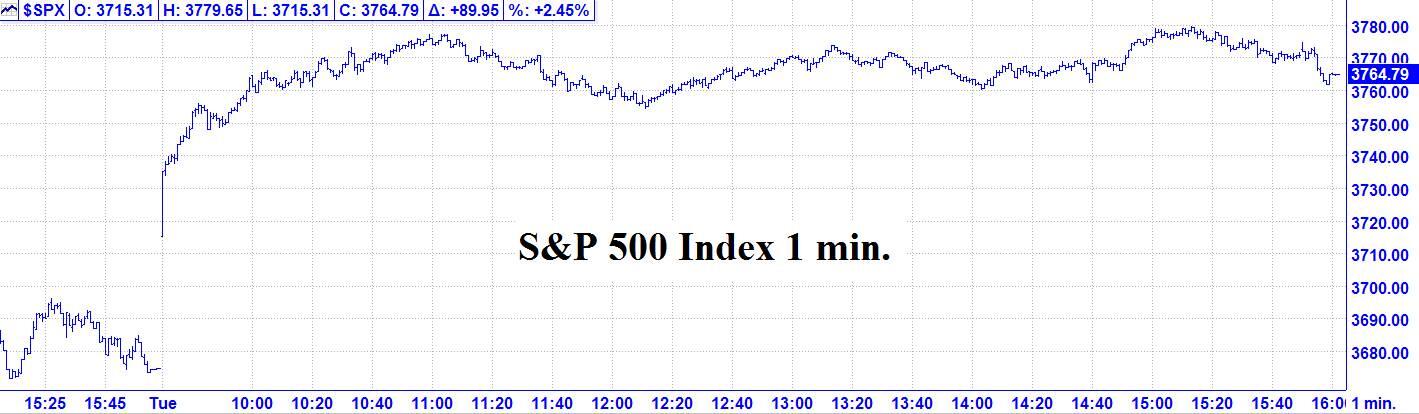
6/21 – The major indices had a huge up day. However, most of the gains were in the morning and that was followed by a gradual uptrend into the last hour to finish with the following closes: DJIA + 641.47; S&P 500 + 89.95; and the Nasdaq Composite + 270.95.
Review – We had a major change in trend window due over the 6/17 weekend. However, you may recall that following a hard down week, the market made a low Friday morning and then had an upward bias into the close. This is contrary to our ideal model. We want to see the market close near it low if the market has been declining or near it’s high if the market has been in an uptrend. The typical pattern is that the market would be expected to spill over into the next trading day. For example, if the market declined into our change in trend window, we would look for a low during the morning of the next trading day, often within the first hour. This is not the setup we had on Friday. In fact, the market jumped the gun. This means there were too many eager buyers. This pattern often leads to a shortened move. And at this writing, that is what we are seeing, as the S&P futures are down significantly in over-night trading, and have given back most of Tuesday’s rally. It very well could be that rather than the low we were looking for over the 6/17 weekend, the market was setting up for a high on Tuesday. Additionally, we had a change in trend point due for 6/21 PM and the market made it’s high around 3:15 PM.
Looking ahead we don’t have anything until 6/23 AM. Please see the details below.
The Now Index has now moved back to the NEUTRAL ZONE.
Coming events
(Stocks potentially respond to all events).
5. B. 6/23 AM – Jupiter 60 US Ascendant. Moderate change in trend US Stocks, T-Bonds, US Dollar.
C. 6/27 AC – Neptune in Pisces turns Retrograde. MAJOR change in trend Commodity Index & Oil.
D. 6/28 AC – New Moon in Cancer Apogee. Major change in trend Financials, Grains, Precious Metals, Silver.
E. 7/01 AC – Jupiter 120 US North Node. Major change in trend US Stocks, T-Bonds, US Dollar.
Stock market key dates
Market math
6/29 = 861 Music days > 2/19/2020 MAJOR HIGH.
*DJIA – 6/27
Fibonacci – 6/21, 6/27.
Astro – 6/28, 6/29, 7/1 AC.
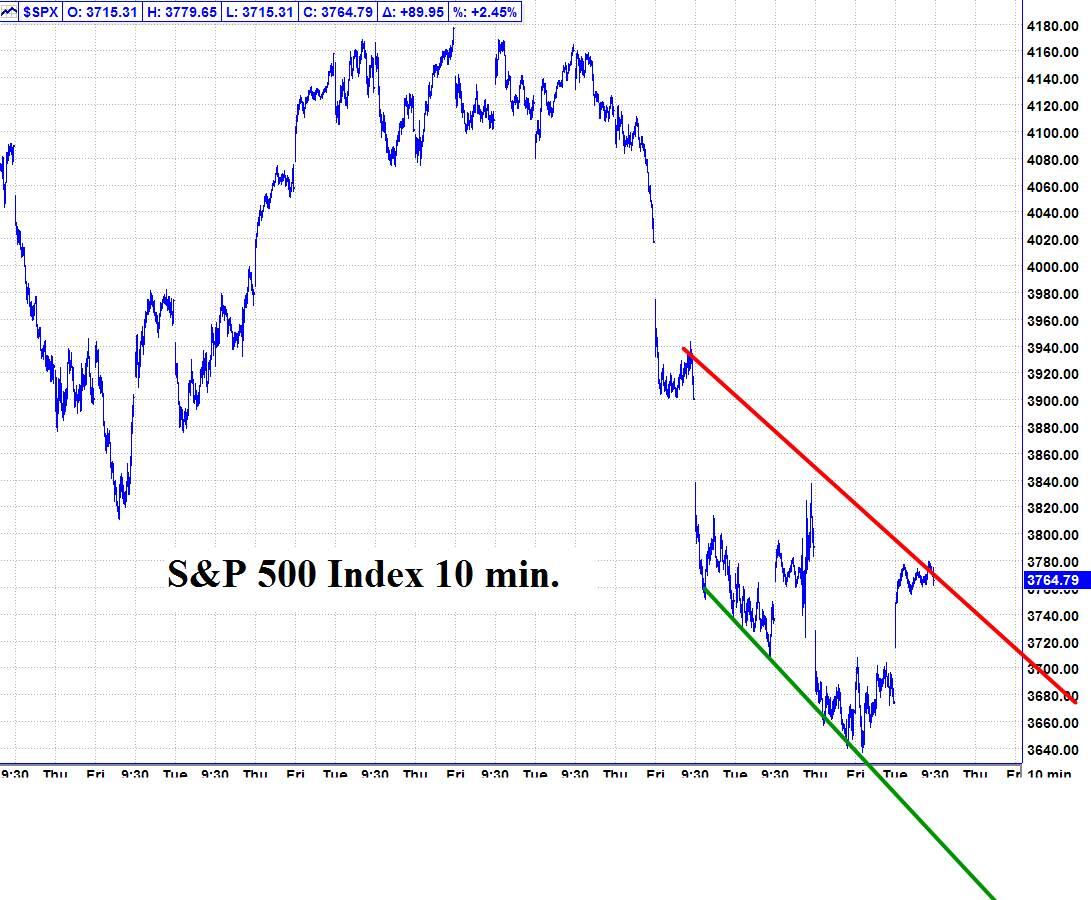
Please see below the S&P 500 10 minute chart.
Support - 3636, 3580 Resistance – 3780.
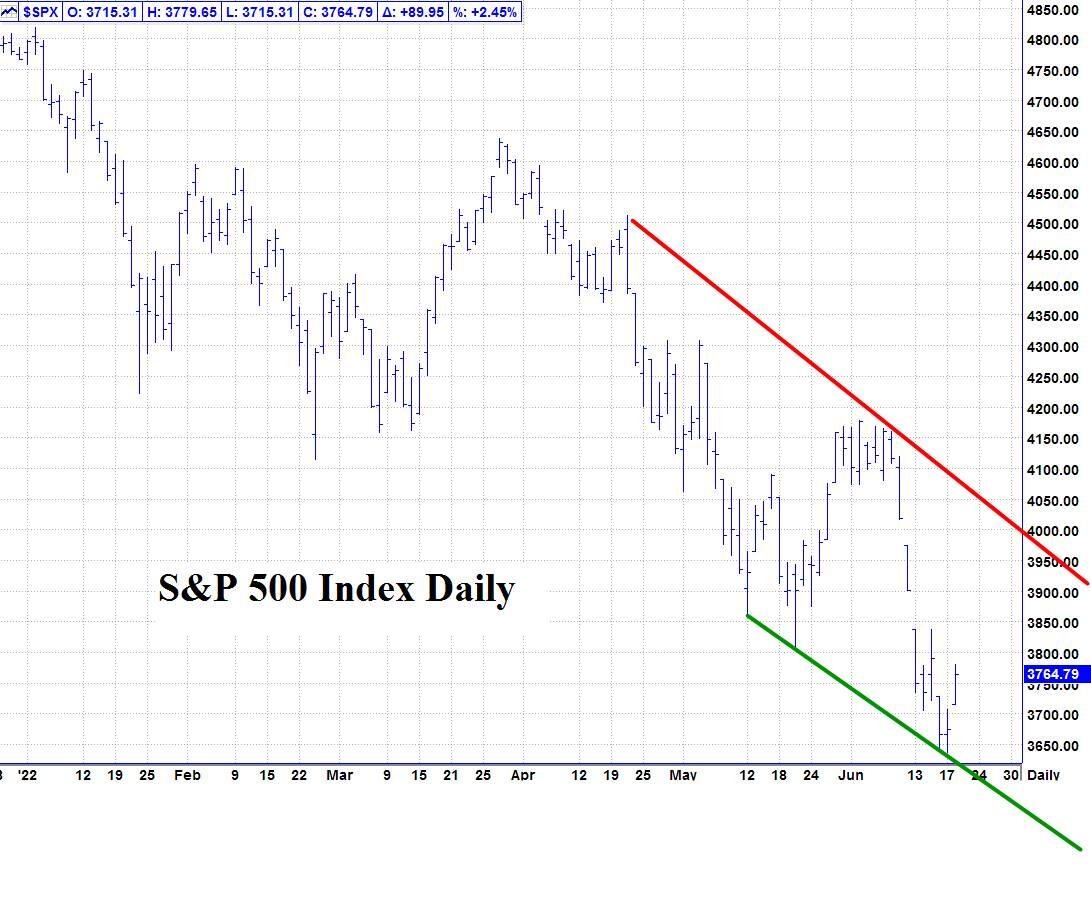
Please see below the S&P 500 Daily chart.
Support - 3636, 3580 Resistance – 3780.
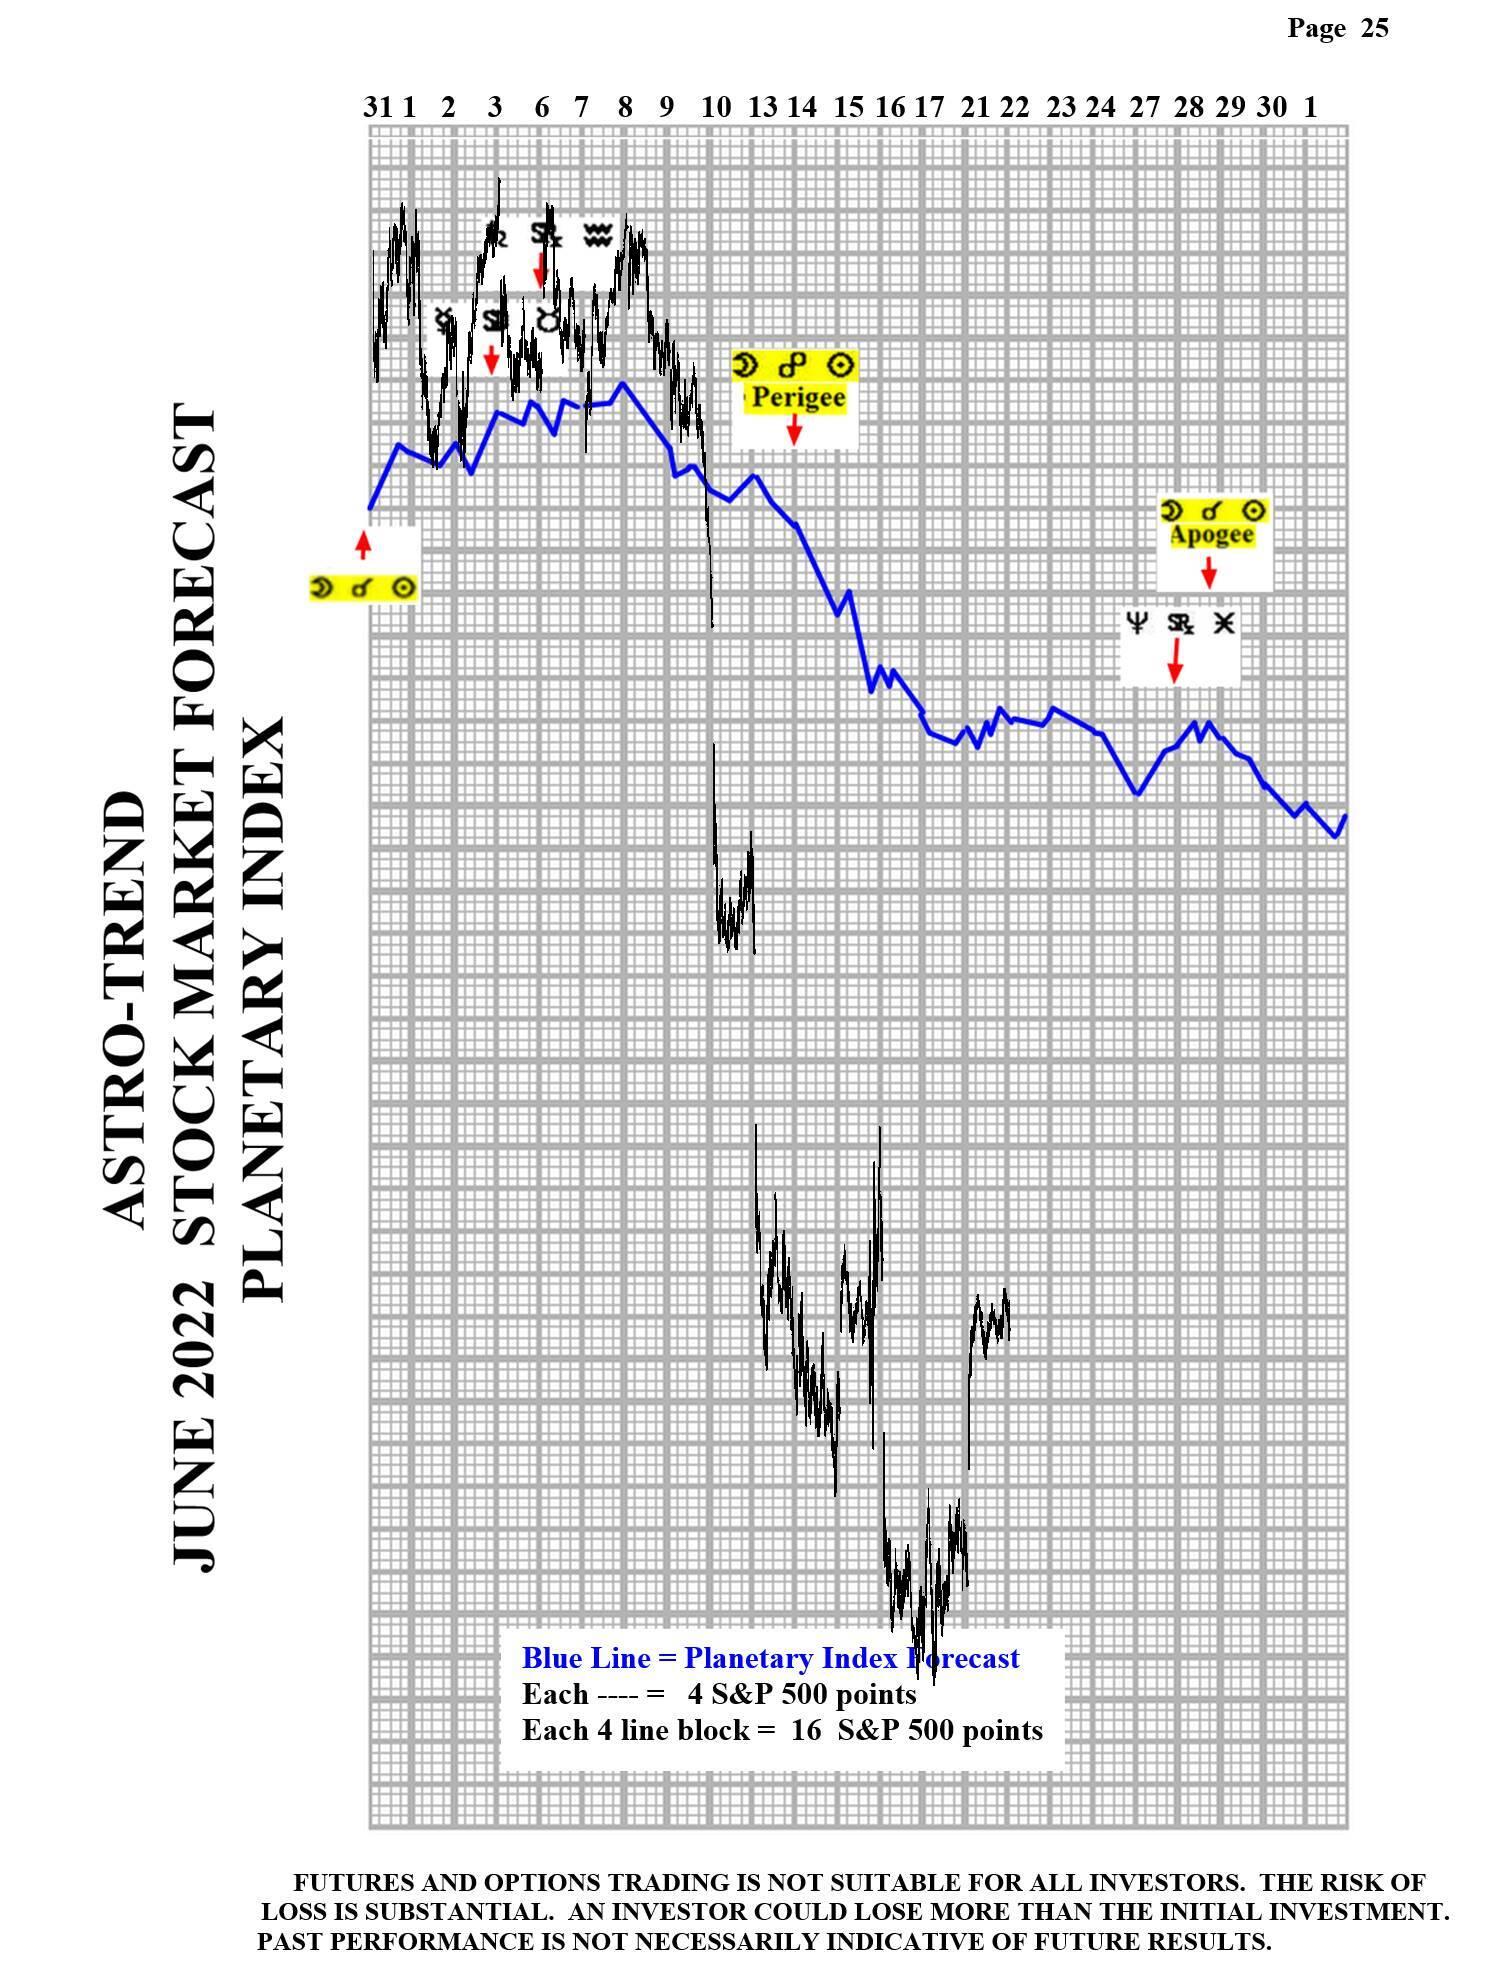
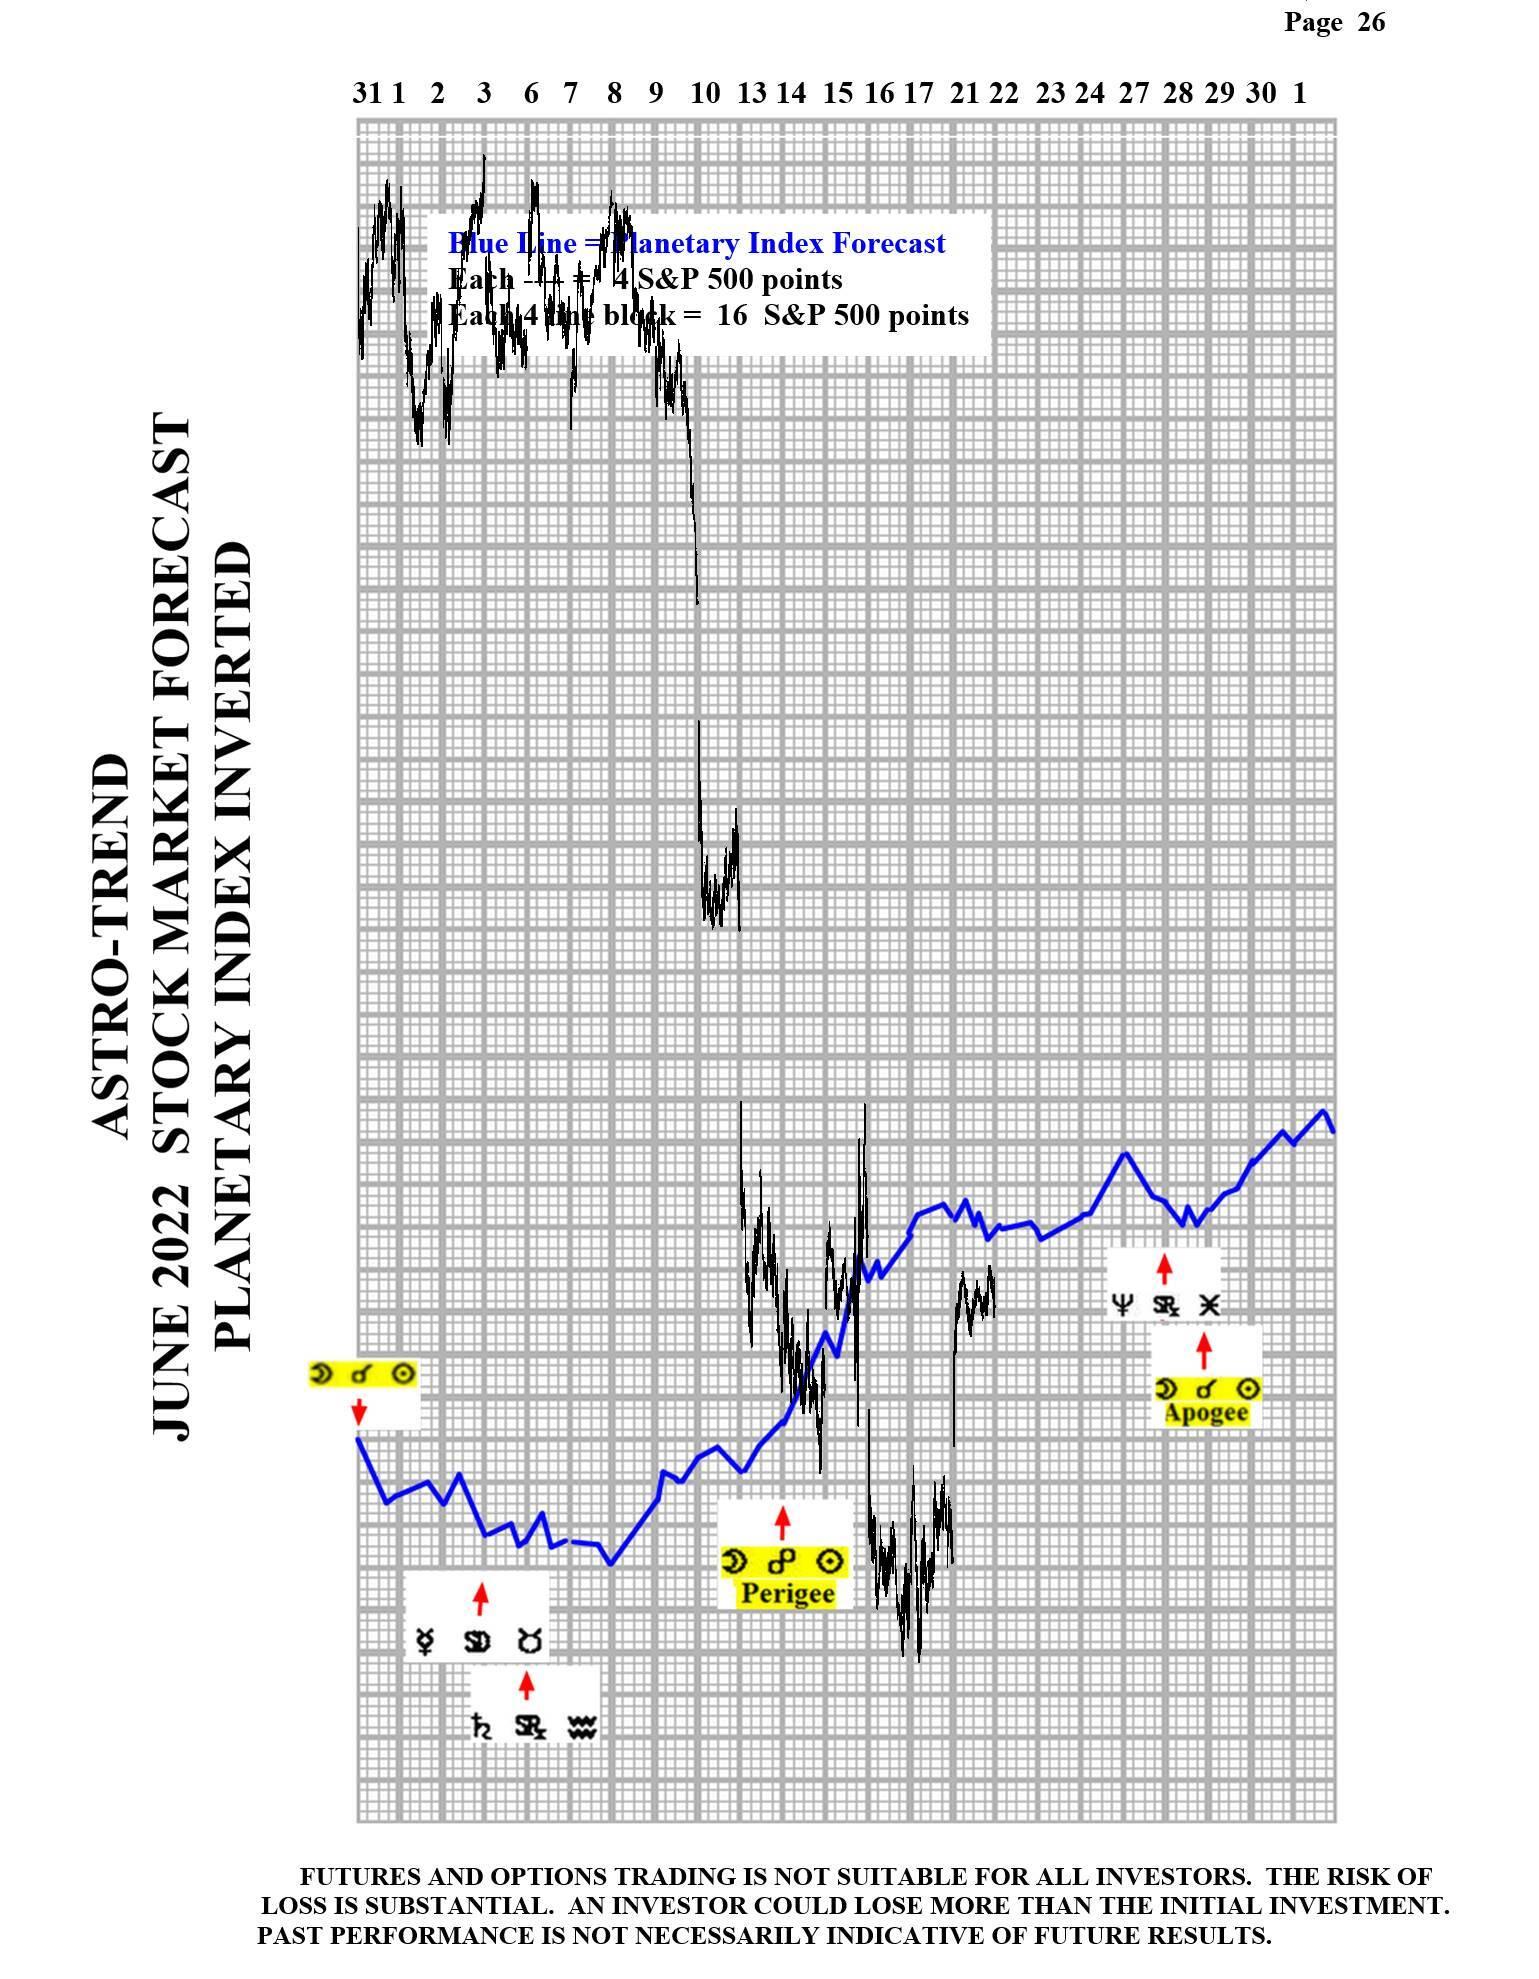
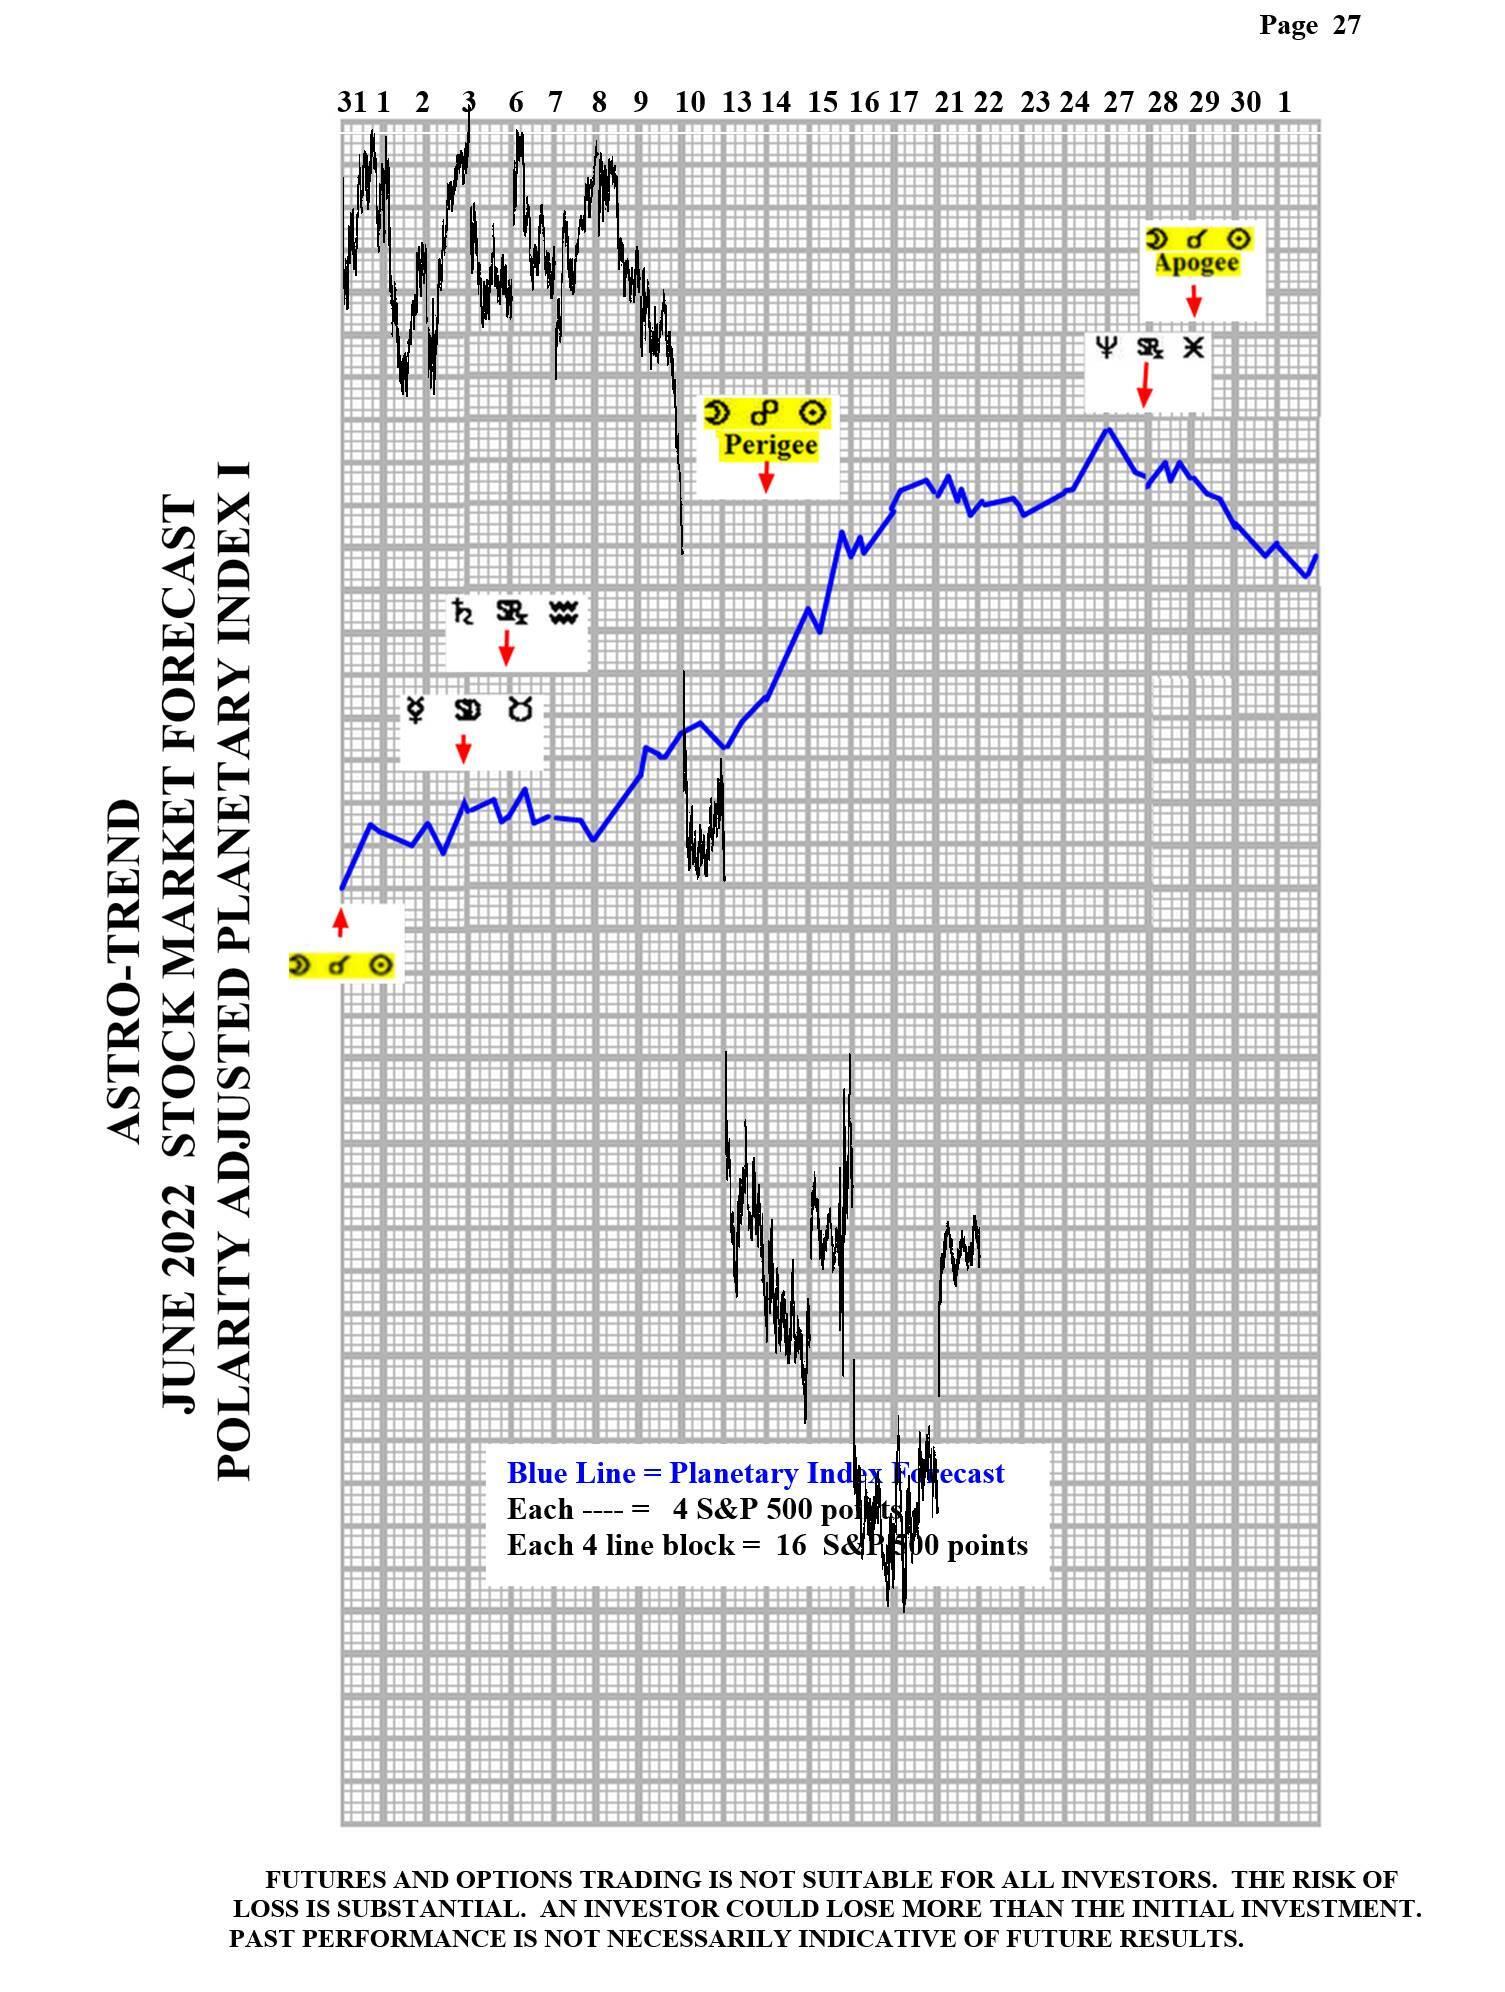
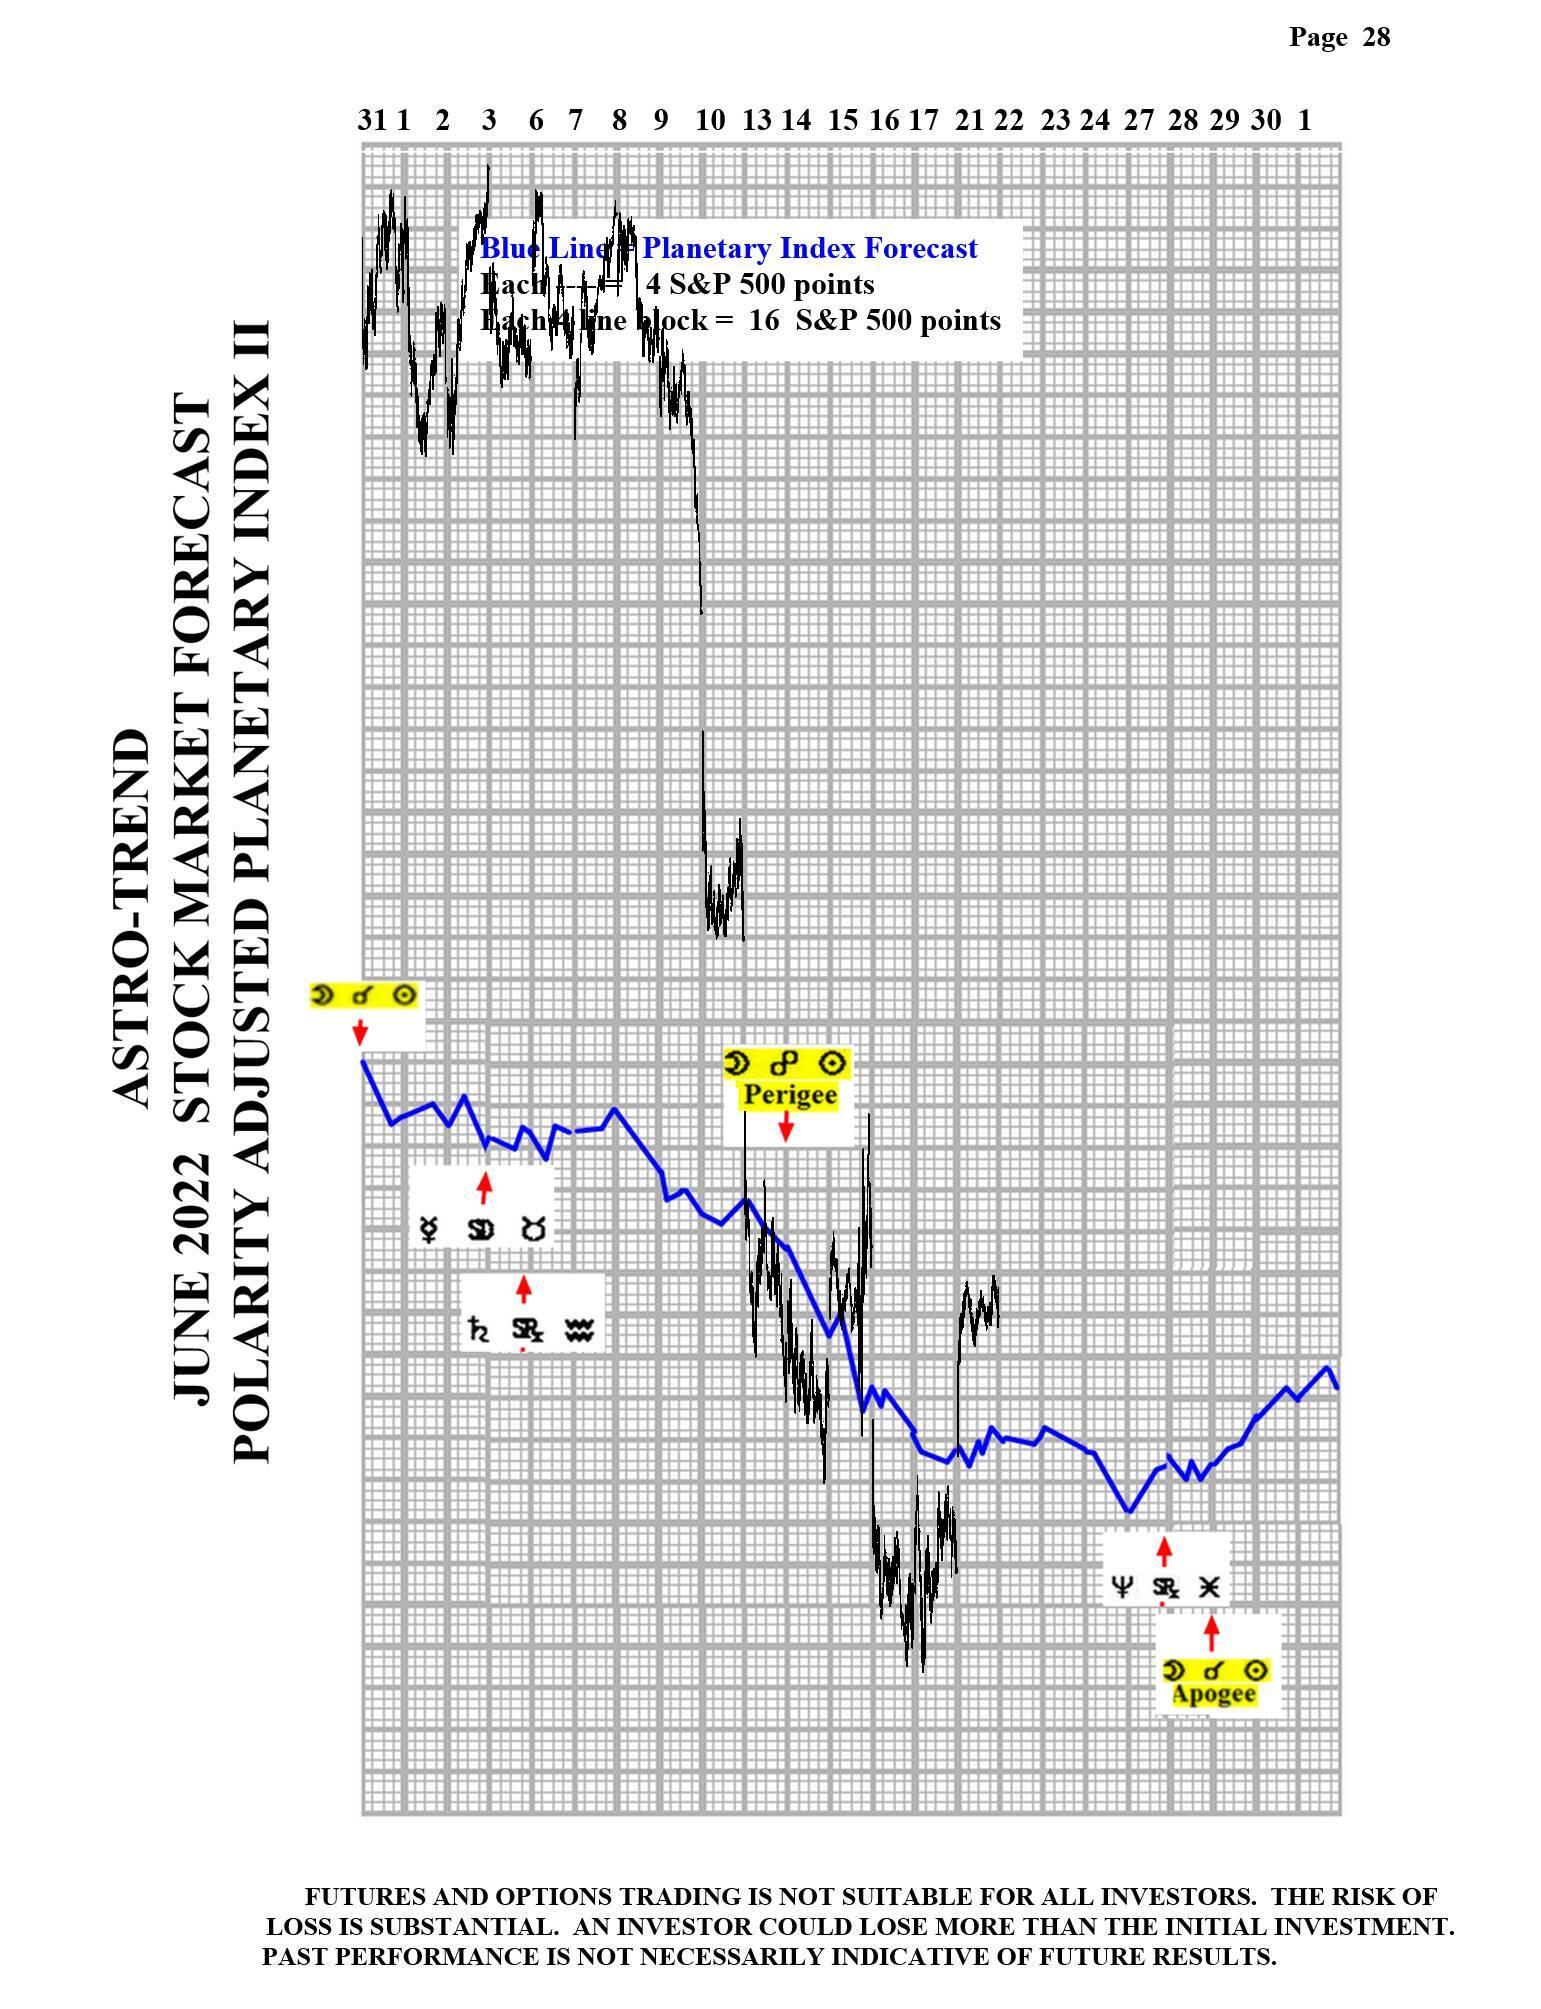
Please see below the June Planetary Index chart with S&P 500 10 minute bars for results.
Note: All information on this page is subject to change. The use of this website constitutes acceptance of our user agreement. Please read our privacy policy and legal disclaimer. Opinions expressed at FXstreet.com are those of the individual authors and do not necessarily represent the opinion of FXstreet.com or its management. Risk Disclosure: Trading foreign exchange on margin carries a high level of risk, and may not be suitable for all investors. The high degree of leverage can work against you as well as for you. Before deciding to invest in foreign exchange you should carefully consider your investment objectives, level of experience, and risk appetite. The possibility exists that you could sustain a loss of some or all of your initial investment and therefore you should not invest money that you cannot afford to lose. You should be aware of all the risks associated with foreign exchange trading, and seek advice from an independent financial advisor if you have any doubts.
Recommended Content
Editors’ Picks
AUD/USD tumbles toward 0.6350 as Middle East war fears mount

AUD/USD has come under intense selling pressure and slides toward 0.6350, as risk-aversion intensifies following the news that Israel retaliated with missile strikes on a site in Iran. Fears of the Israel-Iran strife translating into a wider regional conflict are weighing on the higher-yielding Aussie Dollar.
USD/JPY breaches 154.00 as sell-off intensifies on Israel-Iran escalation

USD/JPY is trading below 154.00 after falling hard on confirmation of reports of an Israeli missile strike on Iran, implying that an open conflict is underway and could only spread into a wider Middle East war. Safe-haven Japanese Yen jumped, helped by BoJ Governor Ueda's comments.
Gold price jumps above $2,400 as MidEast escalation sparks flight to safety

Gold price has caught a fresh bid wave, jumping beyond $2,400 after Israel's retaliatory strikes on Iran sparked a global flight to safety mode and rushed flows into the ultimate safe-haven Gold. Risk assets are taking a big hit, as risk-aversion creeps into Asian trading on Friday.
WTI surges to $85.00 amid Israel-Iran tensions

Western Texas Intermediate, the US crude oil benchmark, is trading around $85.00 on Friday. The black gold gains traction on the day amid the escalating tension between Israel and Iran after a US official confirmed that Israeli missiles had hit a site in Iran.
Dogwifhat price pumps 5% ahead of possible Coinbase effect

Dogwifhat price recorded an uptick on Thursday, going as far as to outperform its peers in the meme coins space. Second only to Bonk Inu, WIF token’s show of strength was not just influenced by Bitcoin price reclaiming above $63,000.